The next report will be the Friday Chart Fix (31 Oct).
The next Premium report/video will be on Tuesday, November 4th.
Watch Gold for Clues on Silver and the Miners
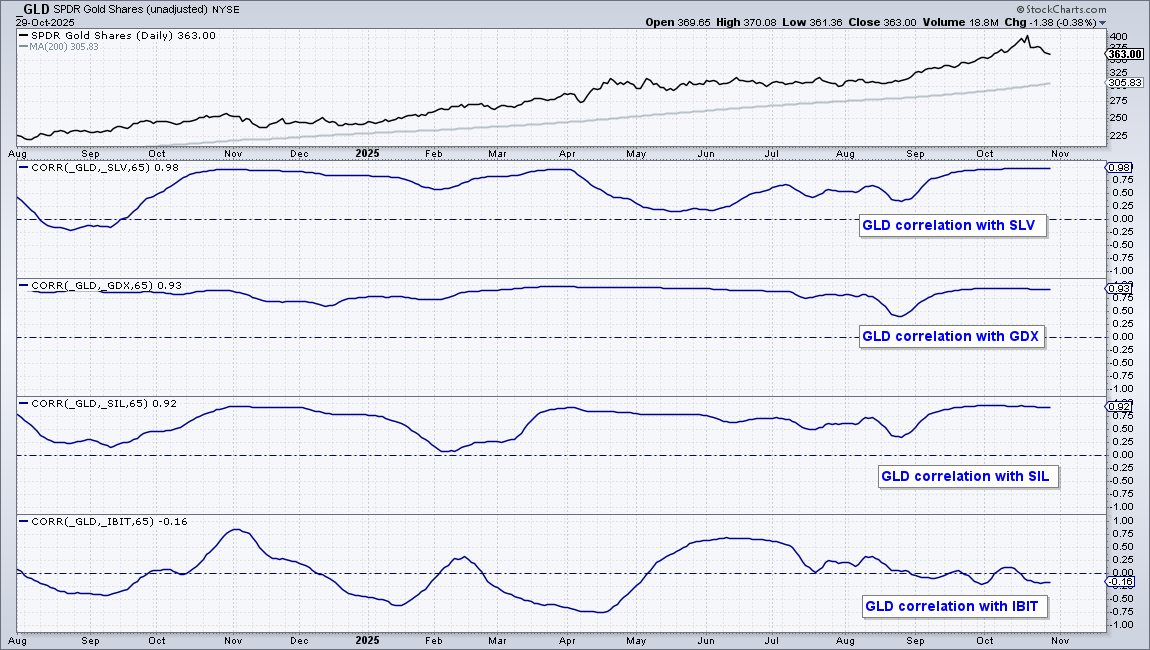
Gold, silver and their respective miners show the same chart characteristics: long-term uptrends, explosive moves from late August to mid October, sharp corrections the last eight days and short-term oversold conditions. We will start with the Gold SPDR (GLD) chart because gold is the main driver here. As gold goes, so go Silver, Gold Miners and Silver Miners. They are positively correlated and move in the same direction. The latter three, however, have significantly more volatility (risk).
The chart above shows GLD and the Correlation Coefficient for SLV, GDX, SIL and IBIT. Values above zero mean they are positively correlated with GLD (move in the same direction). The higher above zero, the stronger the positive correlation. Note that Bitcoin ETF (IBIT) currently has a negative correlation with GLD (-.16). Also, the GLD-IBIT correlation is not consistent because it fluctuates above/below the zero line.
Gold: Surge, Consolidate, Repeat
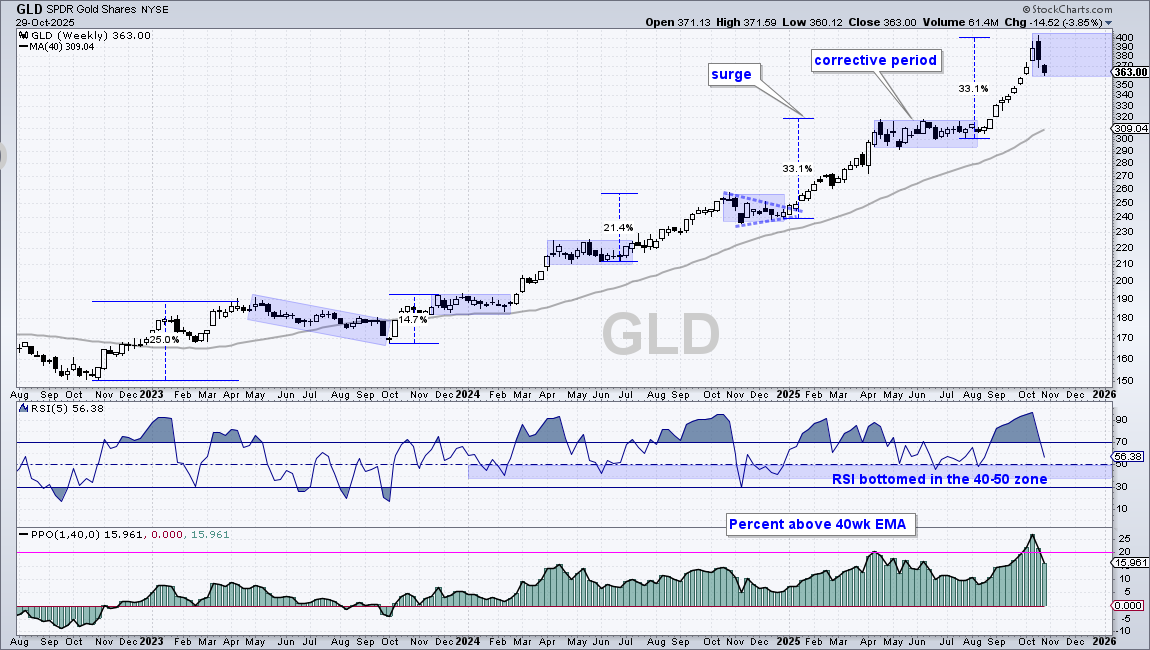
The chart below shows weekly candlesticks for GLD over the last three years. We can see a series of double digit advances followed by consolidations or corrections that lasted two to five months (blue shading). GLD surged 33% at the beginning of the year and then consolidated from April to August (four months). The ETF surged another 33% and fell sharply the last two weeks. This decline could signal the start of a corrective period. The middle window shows RSI(5) pulling back to the 40-50 area during these consolidation periods (blue shading). RSI is currently at 56.38 and not yet in this zone.
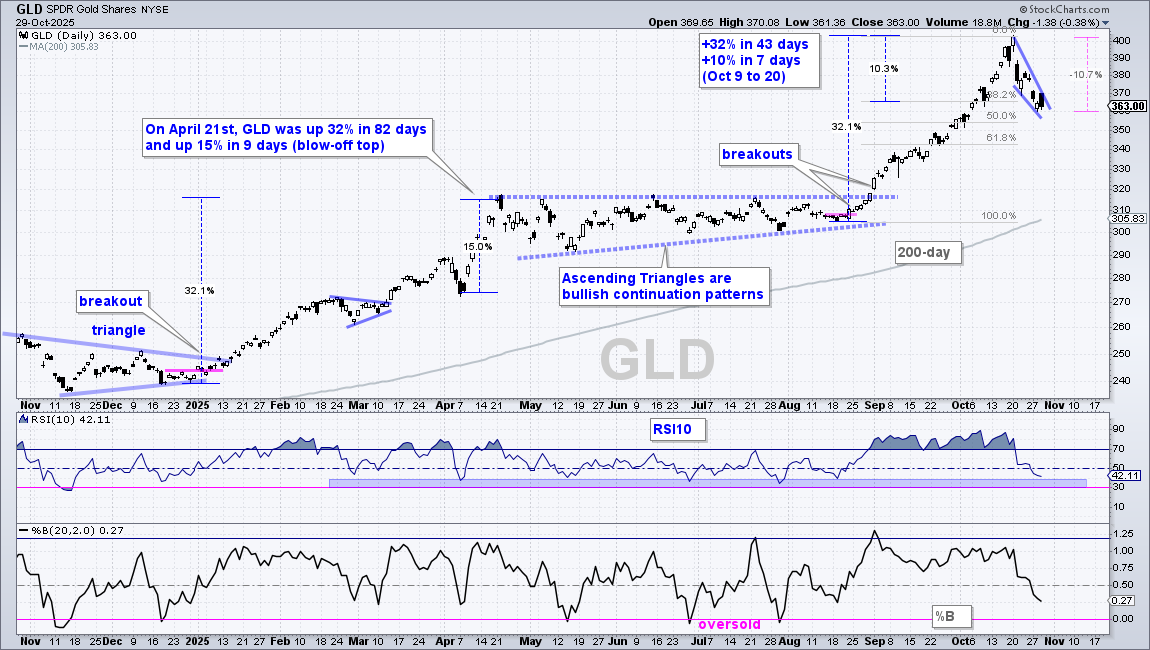
The next chart shows daily candlesticks over the past year. For the second time this year, GLD experienced a blow-off top as it accelerated higher after an extended advance. A 9-day 15% surge in mid April foreshadowed a four month consolidation. Most recently, a 10% surge in 7 days foreshadowed the October pullback. The long-term trend is still up, and GLD is still and leading asset. Thus, this decline is viewed as a correction within the long-term uptrend.
Corrections are like a box of chocolates: you never know what you are going to get. We could see an extended consolidation, a short-sharp pullback, an extended zigzag pullback, a 50% retracement or a 61.8% retracement. Right now, GLD retraced 38-50 percent of the prior advance with a falling wedge. A break above 370 would reverse this short-term downswing. The indicator windows show RSI(10) in the low 40s and %B at .27, both mildly oversold readings. Despite mild oversold readings from the indicators, GLD is clearly short-term oversold after an 8-day 10% decline.
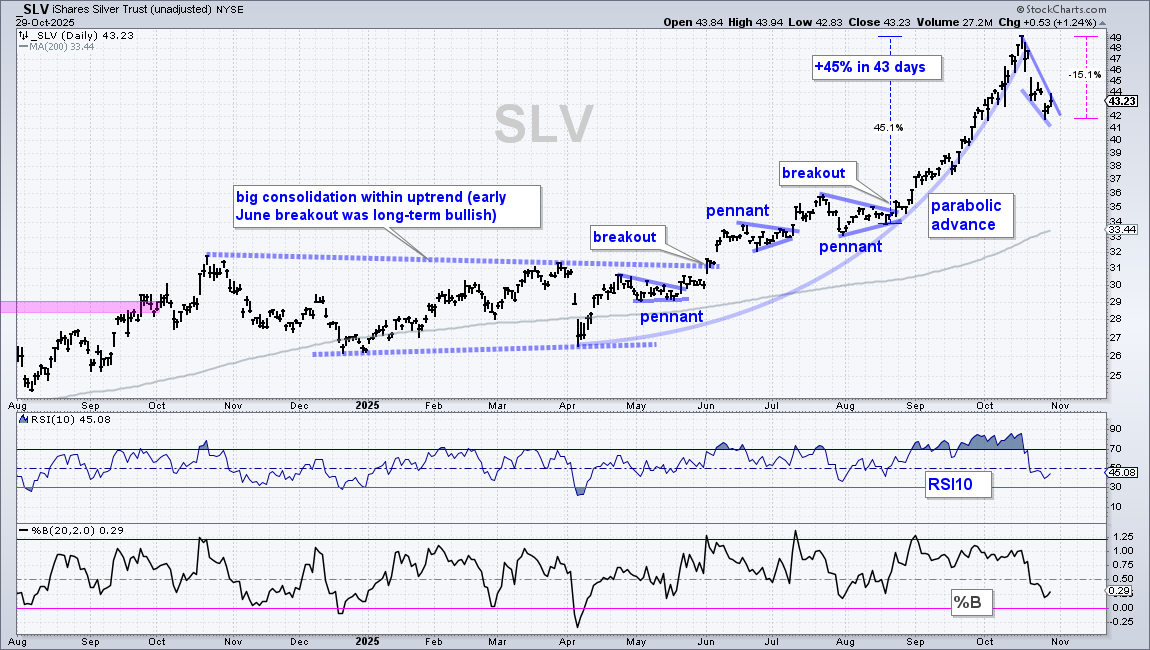
The next chart shows the Silver ETF (SLV) going parabolic with a 45% advance in 43 days (August 19 to October 16). SLV then fell 15% in eight days. Parabolic advances often end with sharp declines/pullbacks. Picking the top, however, is a challenge. As with GLD, I view the decline as a correction within a long-term uptrend. A breakout at 44 would reverse the short-term downswing and provide the first bullish sign.
%B Dips below zero for the Gold Miners ETF
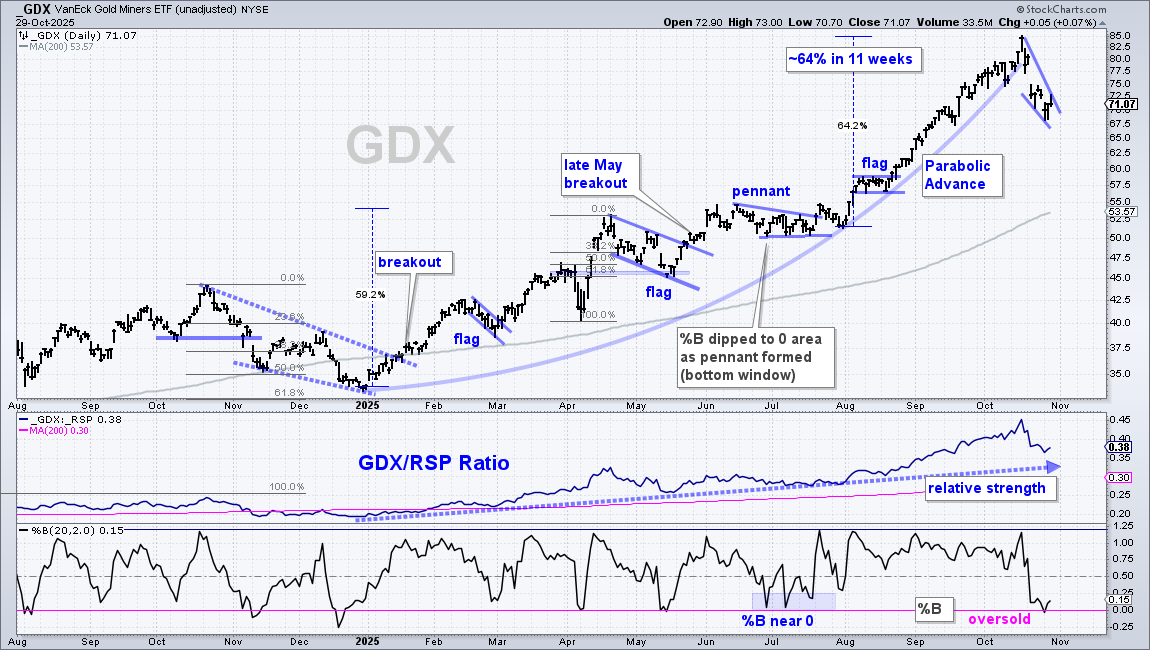
The next chart shows the Gold Miners ETF (GDX) with a falling wedge and short-term resistance at 72.50. GDX also became oversold as %B dipped below zero for the first time since mid May.
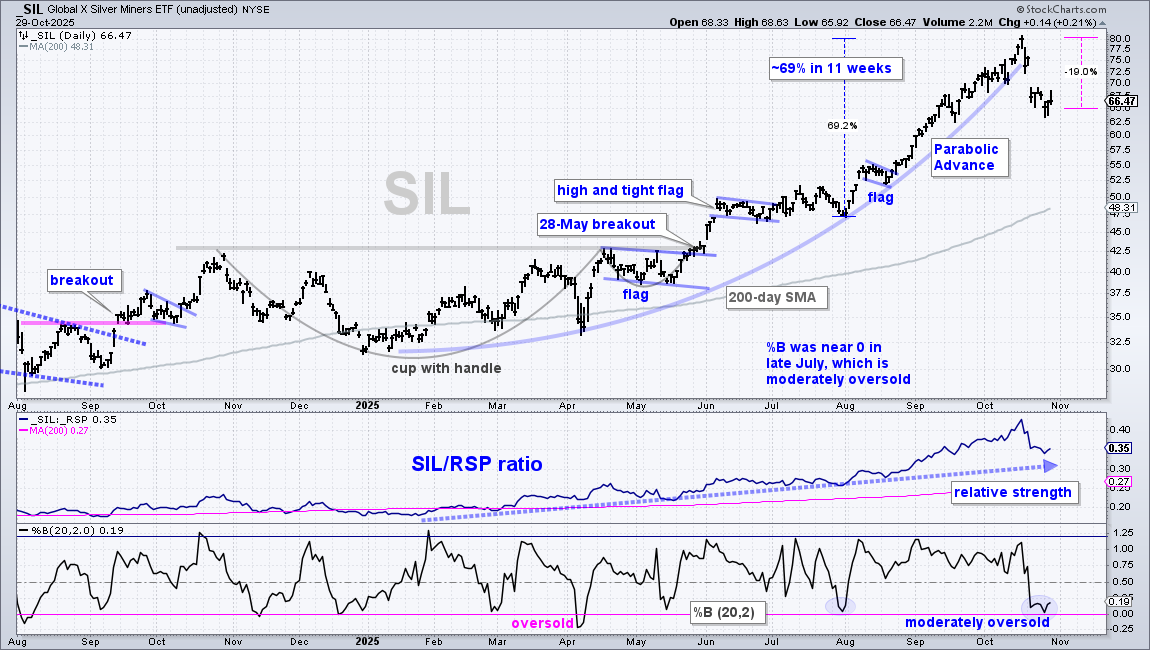
The next chart shows the Silver Miners ETF (SIL) with a parabolic advance and 19% 8-day decline from the mid October high. SIL is still in a long-term uptrend and still outperforming the broader market. Even though %B did not dip below zero, SIL was clearly short-term oversold after the 19% decline.
Copper and Base Metals Advance as Gold Corrects
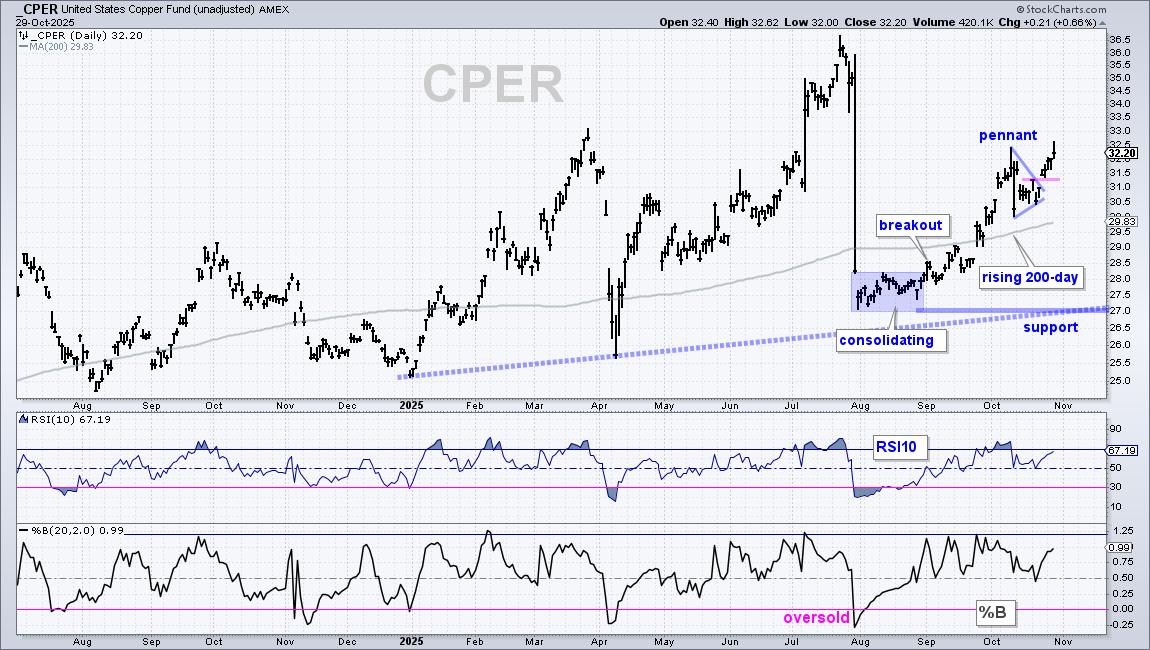
The Copper ETF (CPER) and DB Base Metals ETF (DBB) ignored precious metals and moved higher the last five days. The first chart shows CPER in a long-term uptrend with higher lows and higher highs in 2025. CPER is also above the rising 200-day SMA. Short-term, the ETF formed a pennant into mid November and broke out with a surge the last five days. I remain bullish on copper with support set at 27. I will look to raise this level as price action unfolds.
The next chart shows the DB Base Metals ETF (DBB) with a pennant breakout on September 2nd and a move to new highs. There is no setup on this chart, just a strong and leading uptrend. Outside of Technology, not many names hit 52-week highs this week.
Uranium ETFs Surge within Uptrends
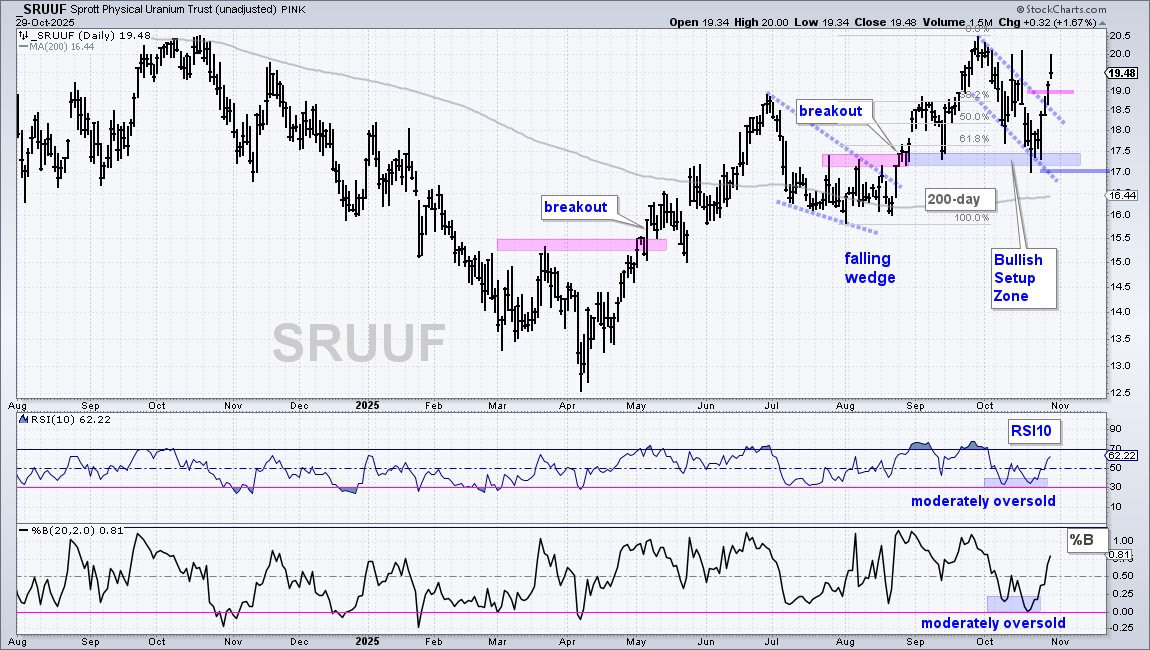
The next chart shows the Sprott Physical Uranium (SRUUF) finding support in the 17-17.5 area and breaking out with a surge the last four days. Overall, SRUUF is in a long-term uptrend with price above the rising 200-day SMA and a 10 month high in September. Price fell back with a falling channel to the Bullish Setup Zone in October (blue shading). This week’s breakout signals an end to the correction and a resumption of the bigger uptrend. I am marking re-evaluation support at 17. Note that this ETF has extremely high volatility and 5+ percent weekly swings are not uncommon.
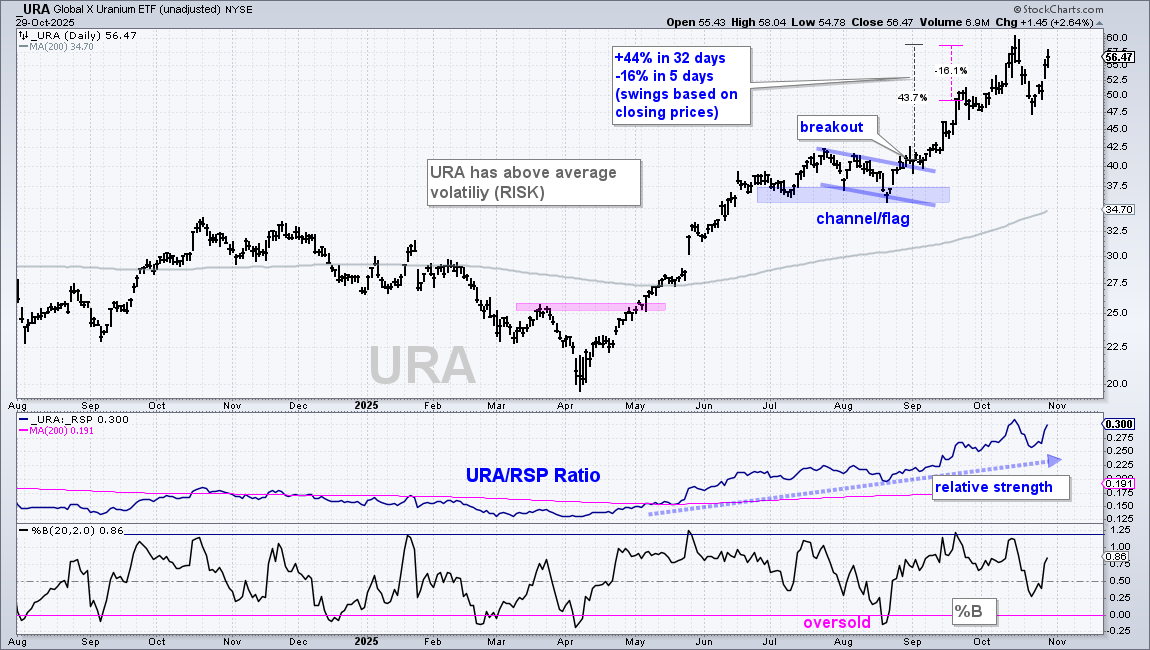
The next chart shows the Uranium ETF (URA) with some big moves since September. URA surged some 44% in 32 days and then fell 16% in five days. The long-term trend is up, but the swings are big and volatility is well above average. After the 15.4% surge the last five days, I do not see a setup on this chart (just in hindsight, sigh).
Bitcoin Battles Support Zone
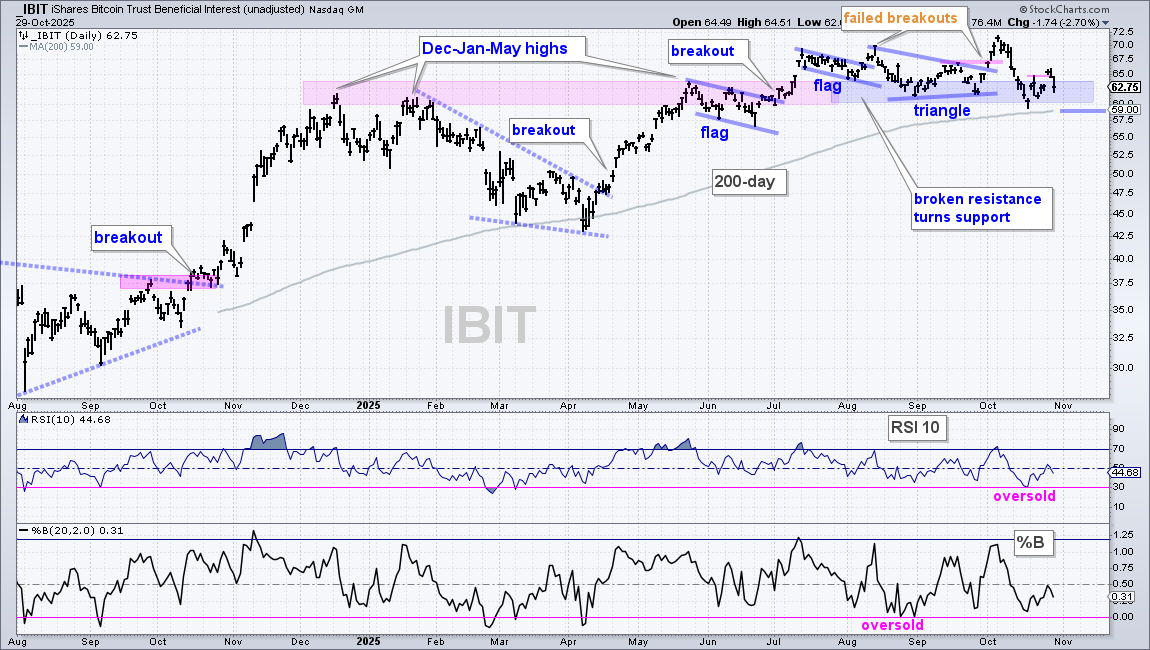
The Bitcoin ETF (IBIT) continues to trade flat with nothing to show since late May. IBIT closed at 63.23 on May 22nd and at 62.75 on Wednesday. As an asset class, it is lagging SPY, IWM, GLD and DBB the last six months (125 days). Despite failed breakouts and a trading range since July, I still see more uptrend than downtrend on the chart. IBIT is above the rising 200-day SMA and hit new highs in July, August and October. It is currently trading in a support zone marked by prior resistance (pink-blue shading). This is the make or break zone. IBIT became oversold two weeks ago and bounced, but this bounce is already struggling as the ETF fell 2.7% on Wednesday. Support is still holding so the bulls get the benefit of the doubt. A close below 59 would break support and the 200-day SMA. This would be bearish.
Bonds Rocked by Fed, but Still in Uptrend
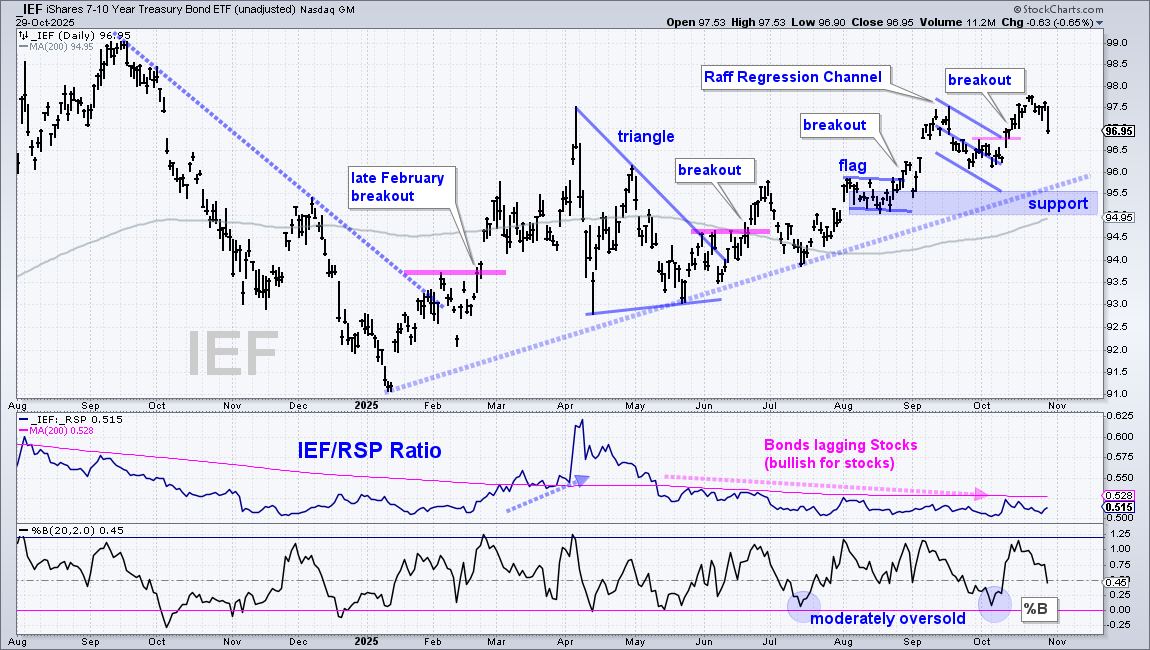
The 7-10Yr TBond ETF (IEF) took a hit on Wednesday after hawkish comments from Fed Chariman Powell. IEF fell .65%, which was the largest one-day decline since early June. This decline is not enough to reverse the overall uptrend. IEF has been trending higher since the February breakout and remains above its rising 200-day SMA. The August lows, January trendline and the 200-day mark support in the 95-95.5 area (blue shading). A break here would reverse the uptrend. Until then, I view pullbacks as corrections within the bigger uptrend.
The middle window shows the IEF/RSP ratio below its 200-day SMA as stocks continue to outperform bonds. This is net bullish for stocks. An upside breakout would show relative strength in bonds, which would be negative for stocks.
ITB, XHB and Home Depot Take a Hit
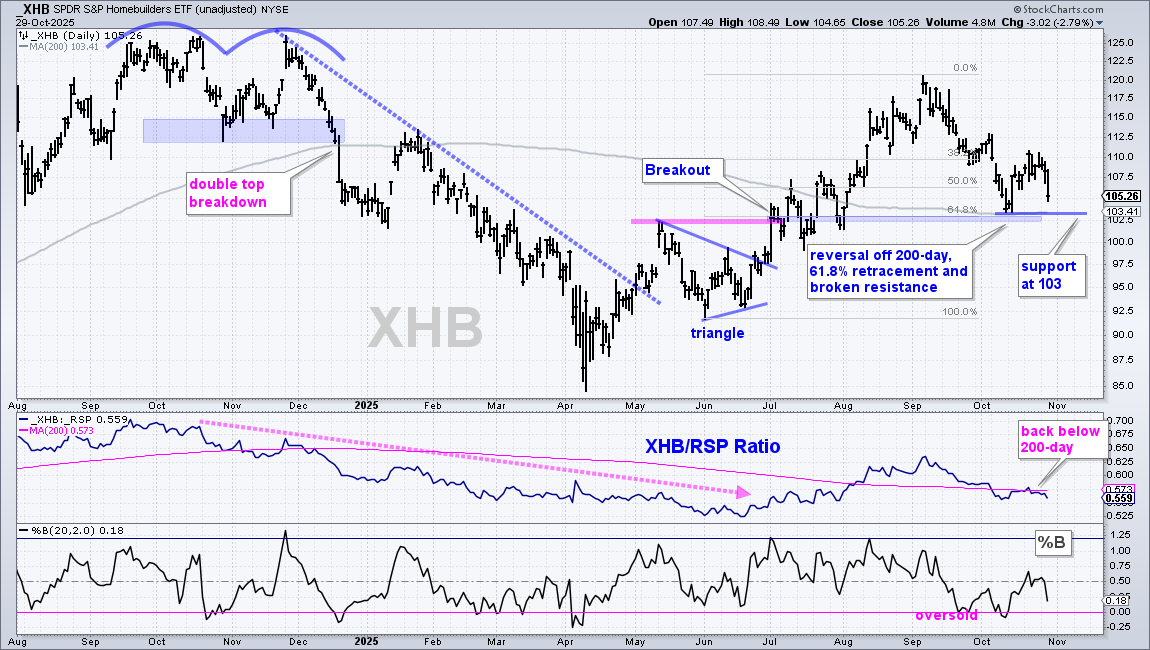
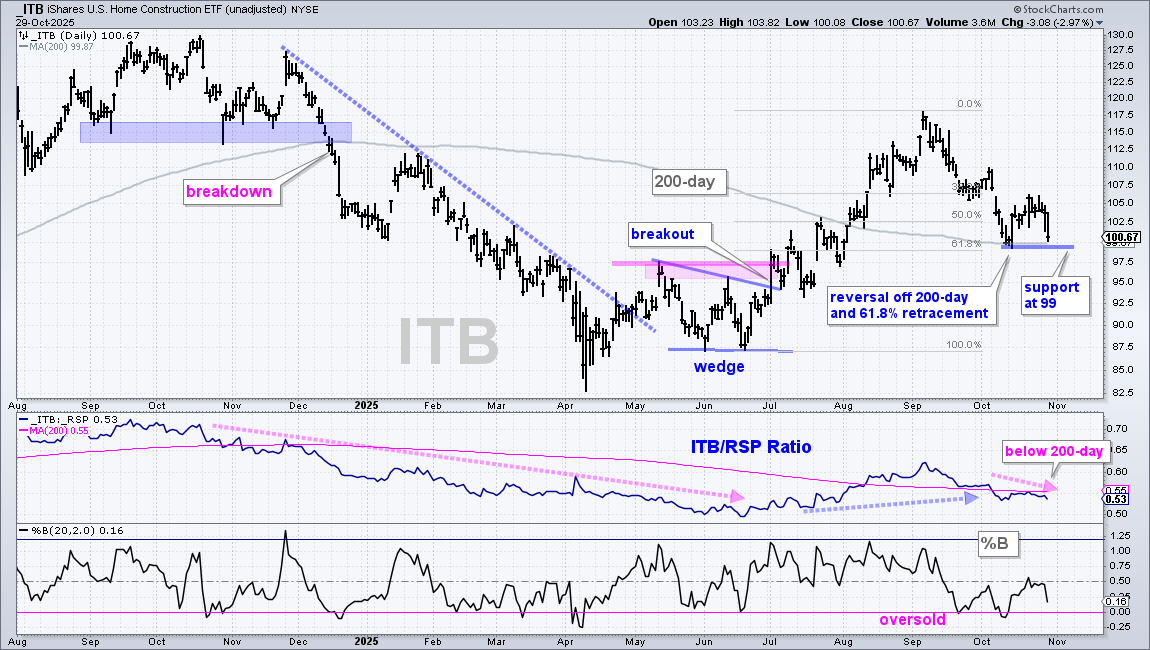
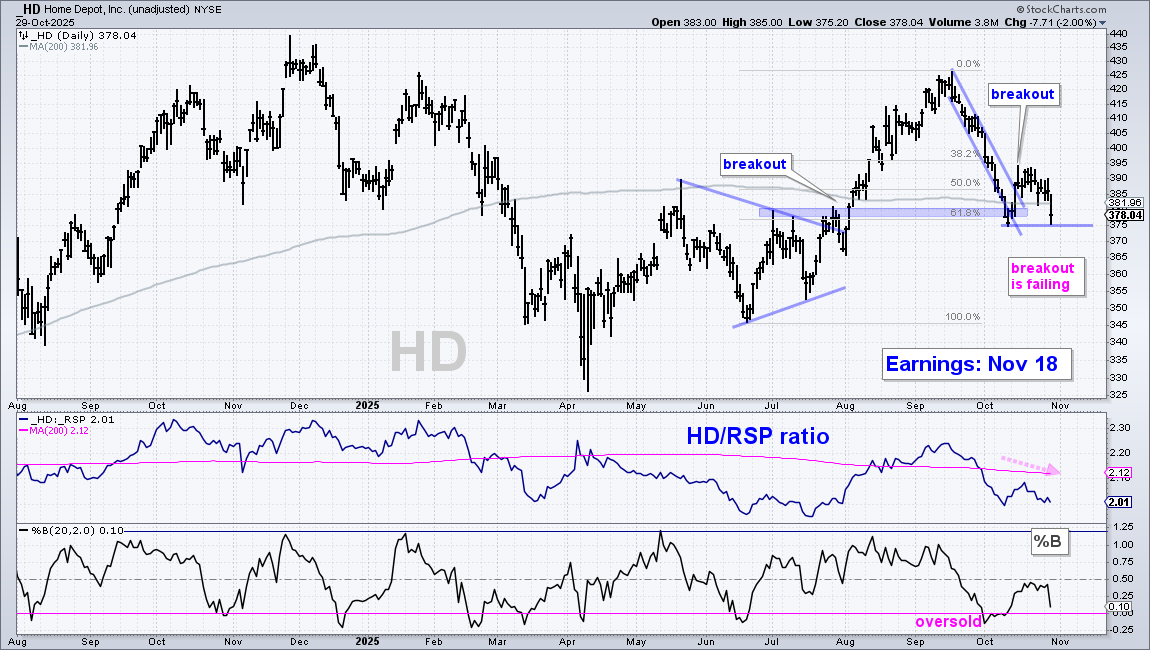
The Home Construction ETF (ITB), Homebuilders ETF (XHB) and Home Depot (HD) were hit hard on Wednesday as bonds fell and the 10yr T-Yield moved above 4%. I featured these three last week as they bounced off their 200-day SMAs. These breakouts are in danger with Wednesday’s sharp decline. The chart below shows XHB with the bounce off the Bullish Setup Zone in mid October and a 2.8% plunge on Wednesday. Further weakness below 103 would break the 200-day SMA and early October low. This would be bearish. The middle window shows the price-relative turning back down with a move below its 200-day SMA. XHB is again underperforming. The ITB and HD charts are also shown for reference.
DISCLAIMER: This content provided strictly for informational and educational purposes. It should not be interpreted as an offer to buy or sell any security, nor as a solicitation to engage in any investment activity. Nothing here constitutes a recommendation regarding any specific security, portfolio, transaction, or investment strategy.
At times, the author or affiliates may hold positions or interests in securities discussed. Any stocks or examples mentioned are not endorsements or suggestions to purchase. This material does not consider your individual financial goals or circumstances, and you should seek guidance from a qualified financial or investment adviser before making any trading or investment decisions.
Past performance does not guarantee future results.
Send feedback to support(at)trendinvestorpro.com or use the contact form.