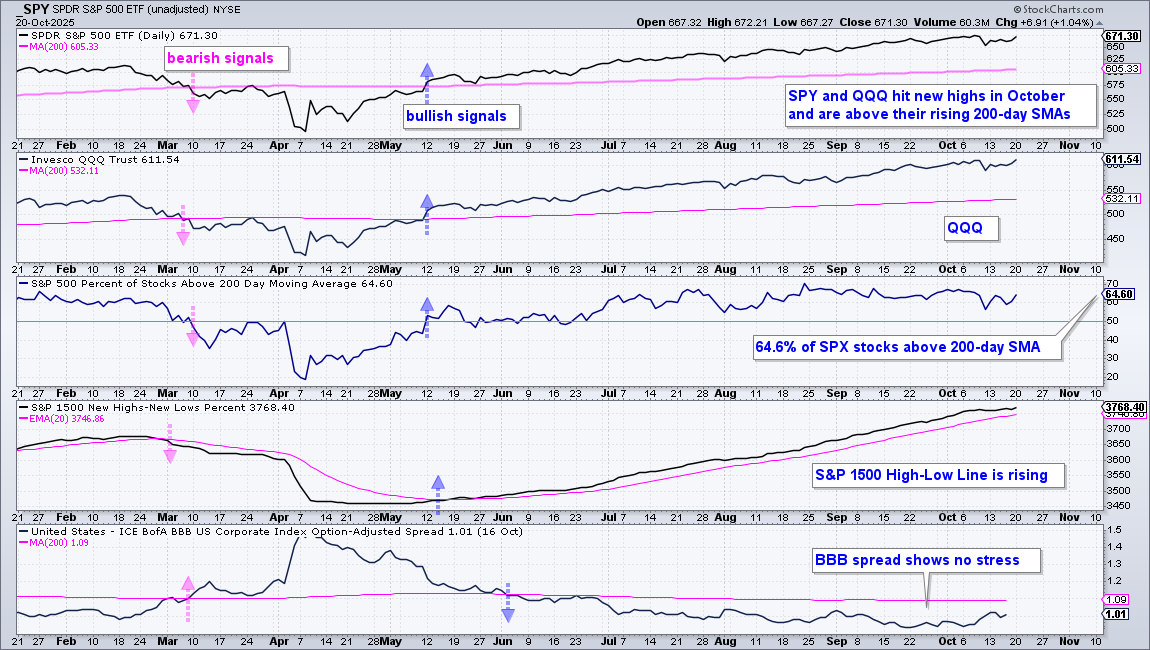
The weight of the evidence remains bullish for stocks. SPY, QQQ and IWM hit new highs in October and remain in leading uptrends. Around 65% of S&P 500 stocks are above their 200-day SMAs. Even though this means 35% are below (long-term downtrend), the vast majority of stocks are in uptrends and this supports the bull market.
The S&P 1500 High-Low Line is rising because it remains above its 20-day EMA. This means new highs are consistently outpacing new lows, which is net bullish. And finally, the BBB yield spread remains narrow (low) and shows no signs of stress in the credit markets. These indicators have been majority bullish since mid May. The pink arrows show when they turned bearish in early March.
18 Leading Groups
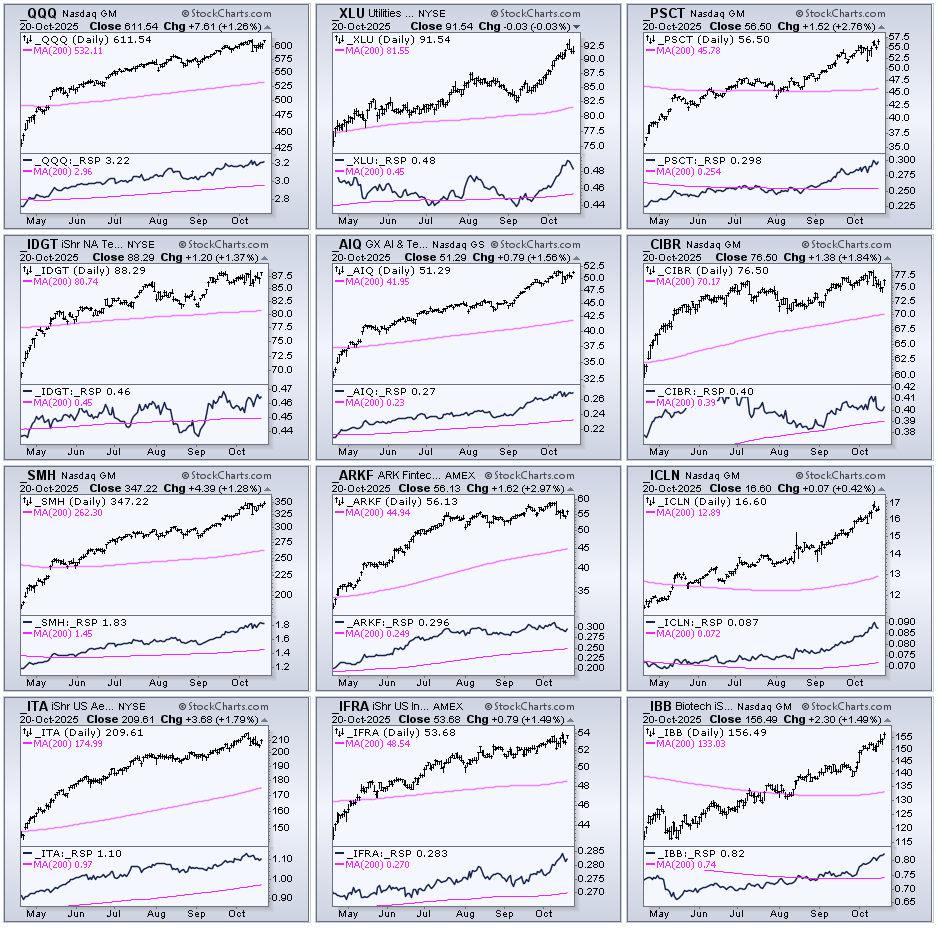
The list and CandleGlance charts show ETFs that hit new highs in price and relative strength within the last 10 days. Relative strength is relative to the S&P 500 EW ETF (e.g. SPY/RSP, QQQ/RSP or SMH/RSP ratios). SPY (large-caps), QQQ (large-cap techs), IWM (small-caps) and IWC (micro-caps) are strong and outperforming the average stock in the S&P 500. There is also strength in groups from the Technology, Industrials, Healthcare and Utilities sectors.
S&P 500 SPDR (SPY)
Nasdaq 100 ETF (QQQ)
Russell 2000 ETF (IWM)
Russell Microcap ETF (IWC)
Technology SPDR (XLK)
Utilities SPDR (XLU)
Global AI & Tech ETF (AIQ)
Robotics AI ETF (ARTY)
ARK Fintech Innovation ETF (ARKF)
Semiconductor ETF (SMH)
Transformational Data Sharing ETF (BLOK)
Aerospace & Defense ETF (ITA)
Global Clean Energy ETF (ICLN)
Infrastructure ETF (IFRA)
Biotech ETF (IBB)
ARK Genomic Revolution ETF (ARKG)
Metals & Mining SPDR (XME)
Telecom ETF (IYZ)
SPY, QQQ and IWM Maintain Leading Uptrends
Large-caps (SPY), large-cap tech stocks (QQQ) and small-caps (IWM) are leading the broader market. These three are stronger than the S&P 500 EW ETF (RSP), the S&P MidCap 400 ETF (IJH) and S&P SmallCap 600 SPDR (IJR).
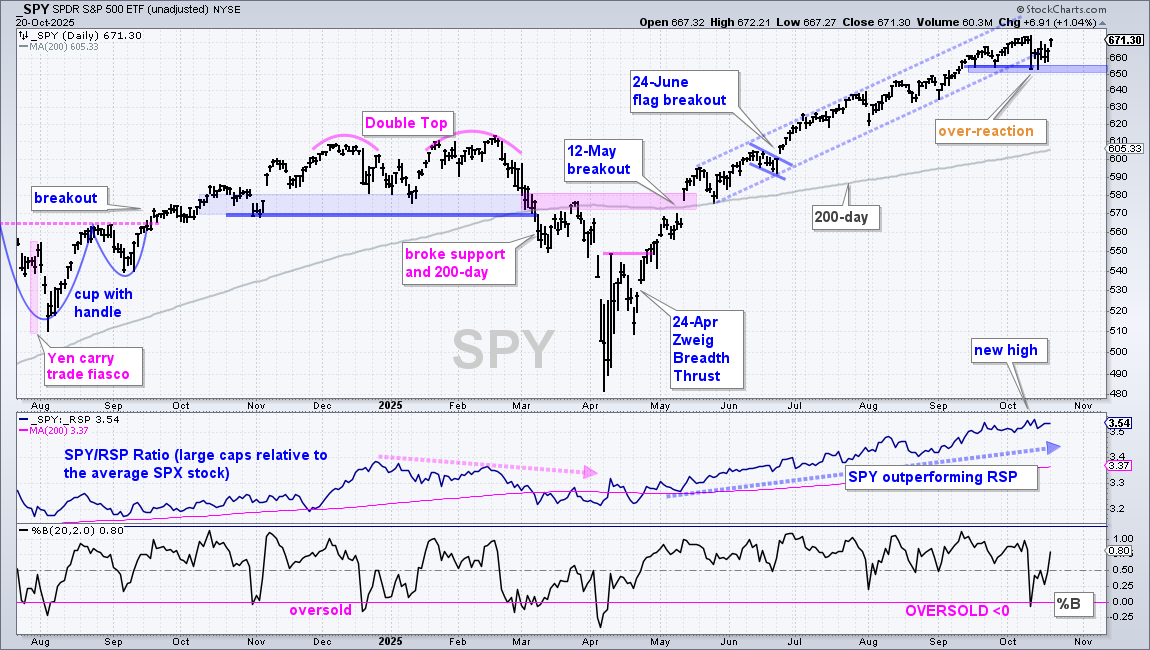
The chart below shows SPY taking a -2.7% hit on October 10th (Friday) as the market reacted negatively to a tariff threat. SPY broke the channel trendline and closed below the mid September low for a short-term support break. This was a news-induced overreaction at the end of the week. SPY rebounded on Monday, held strong throughout the week and popped 1% on Monday. With the 2.7% drop erased, the uptrend is back in play and I am marking support in the 650-655 area (blue shading). A break here would be short-term negative and argue for a correction within the bigger uptrend.
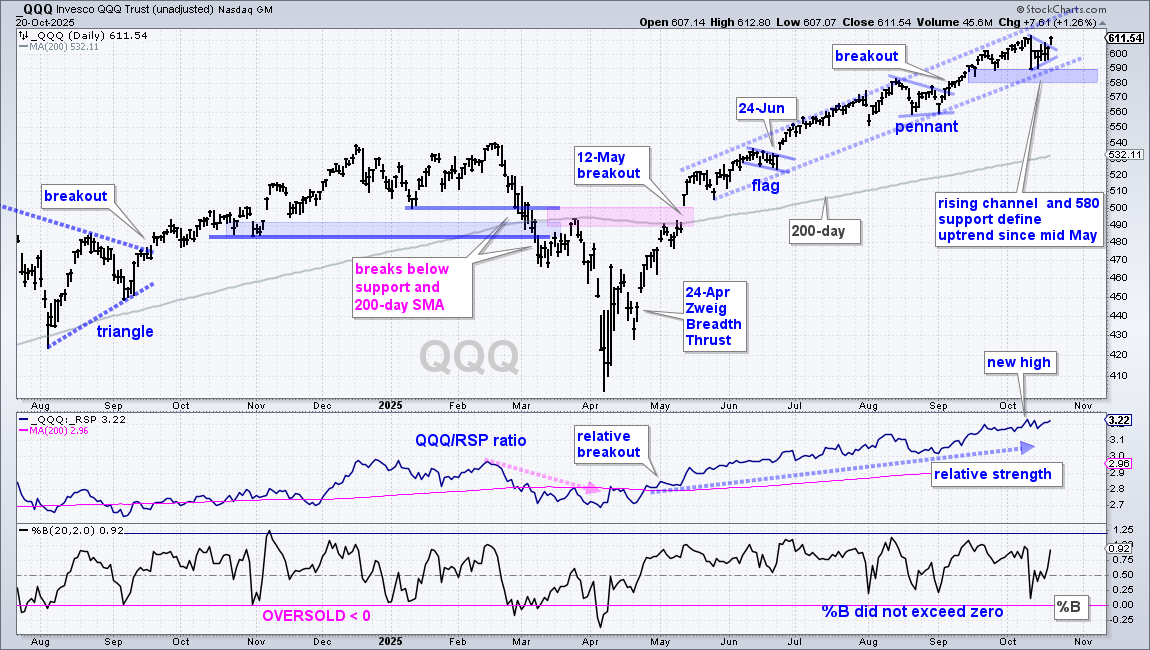
The next chart shows QQQ falling 3.5% on October 10th, but holding above support at 580 and not becoming oversold (%B>0). QQQ held up better than SPY. QQQ remains in a leading uptrend with support marked at 580. In fact, the ETF formed four inside days last week and a small pennant from Friday to Friday (October 10 to 17). The ETF broke the pennant line with a 1.26% surge on Monday and forged a new closing high. Pennants are short-term continuation patterns that take their bias from the prior move, which was up. Thus, the breakout signals a continuation higher. The middle window shows the price-relative in a strong uptrend, which means QQQ is leading.
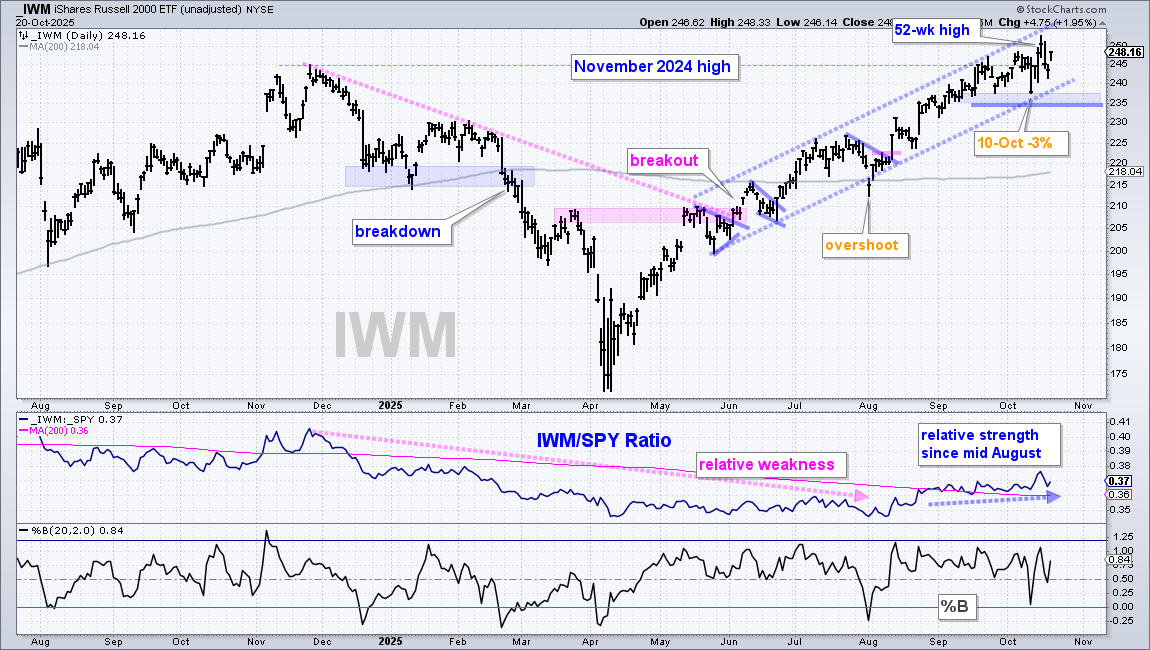
Even though the Russell 2000 ETF (IWM) hit a new high in October, it is still trading near its November 2024 high (dashed line) and has little to show over the past 11 months. SPY is some 10% above its November 2024 high, and QQQ is some 16% above this high. IWM is in the midst of a great run since April, but still lagging the big boys long-term. On the price chart, IWM stalled the last four weeks with support marked at 237. A break here would reverse the immediate uptrend and argue for a corrective period.
There are plenty of ETFs and stocks with long-term uptrends and relative strength. Most of these broke out between late April and mid May. They also recorded new highs over the last few weeks and show relative strength. Once in an uptrend, traders can look for short-term pullbacks and bullish setups to trade in the direction of the leading uptrend.
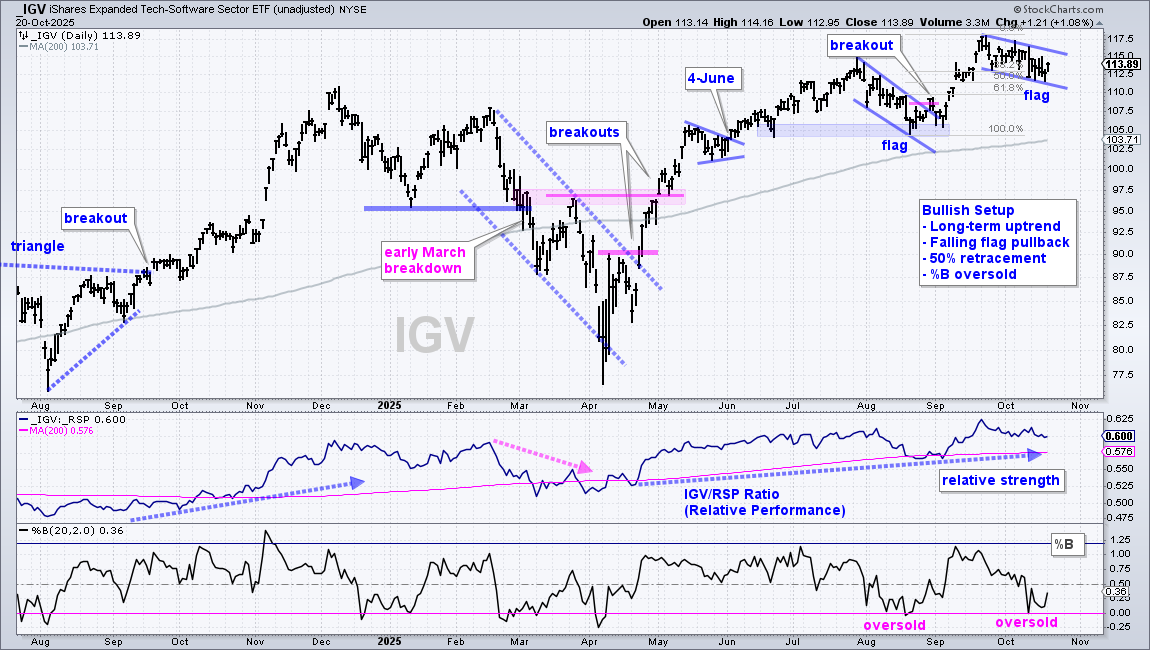
The chart below shows the Software ETF (IGV) with a classic short-term setup. First, the long-term trend is up with a new high in September and price well above the rising 200-day SMA. Second, the price-relative (IGV/RSP ratio) is above its rising 200-day SMA and also hit a new high in September (relative strength). Third, IGV corrected the last few weeks with a bull flag forming. Fourth, this flag retraced 50% of the prior advance, which is normal for corrections. Fifth, %B hit -.01 to become oversold on October 10th.
Falling flags are short-term continuation patterns that get their trading bias from the prior move, which was up. A breakout at 116 would signal an end to the correction and a resumption of the bigger uptrend. Traders looking to front-run a breakout can act on a close above 115.03 (last week’s high).
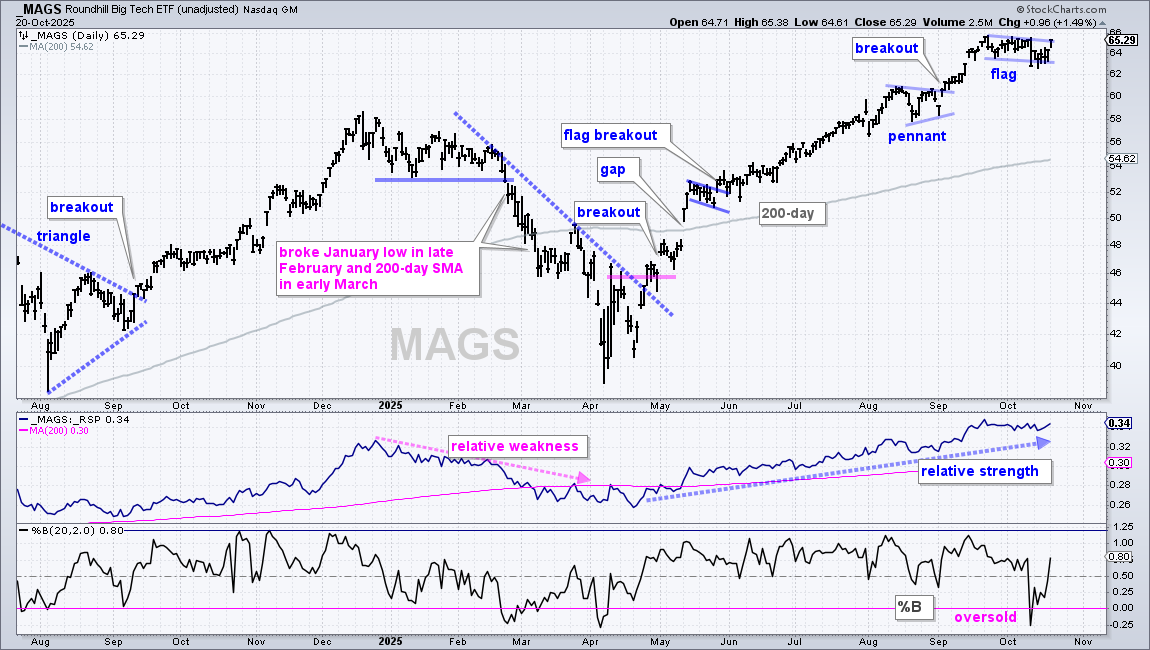
The next chart shows MAGS with similar characteristics: long-term uptrend, leading, falling flag and %B oversold. MAGS surged above last week’s high on Monday.
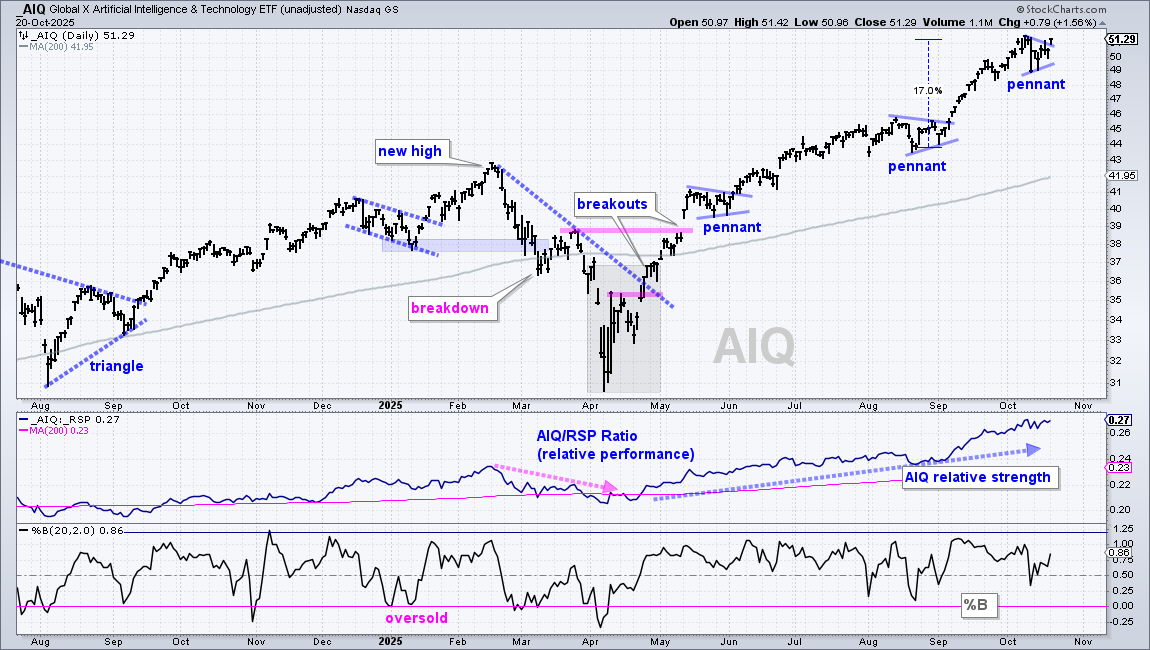
The next chart shows the Global AI & Tech ETF (AIQ) with a pennant breakout on Monday. Admittedly, AIQ seems overextended after a 17% advance since mid August. The ETF, however, is clearly a momentum leader with one of the strongest uptrends. The pennant breakout signals a continuation of this strong uptrend.
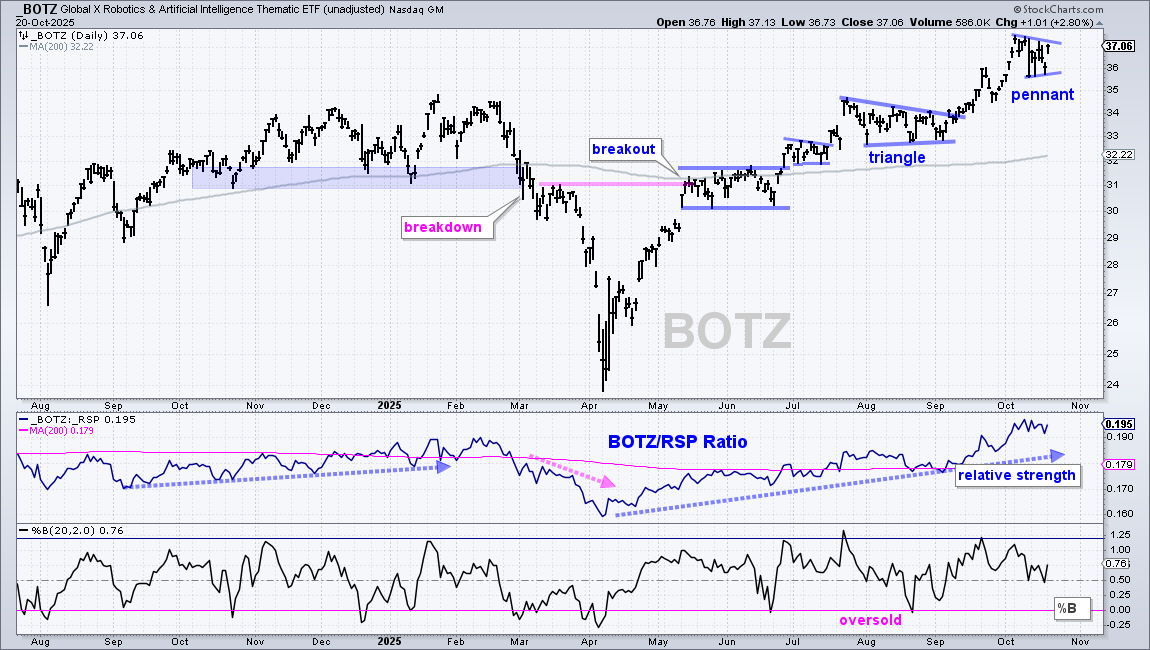
The next chart shows the Global Robotics & AI ETF (BOTZ) with a surge to new highs in September-October and a bullish pennant forming the last two weeks.
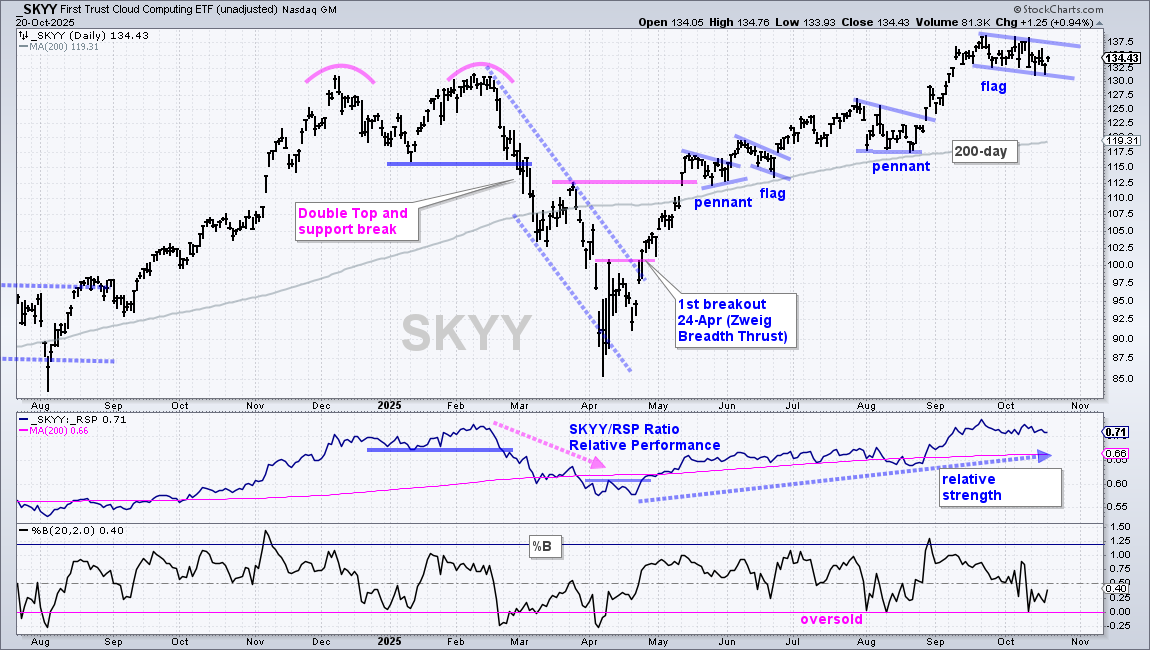
The next chart shows the Cloud Computing ETF (SKYY) with a bull flag.
Plan the Trade and Trade the Plan (BLOK)
Keep in mind that short-term breakouts could fail and these ETFs could fall below their October lows – and still be in a leading uptrends. All it takes is a little volatility, which is possible during earnings season, not to mention tariff season. The key, as always, is to plan the trade and trade according to that plan. Keep an open mind, focus on the chart and ignore the news. Consider profit targets and trailing stops, such as the Chandelier Exit (22,3) for traders or Chandelier Exit (65,5) for accumulators.
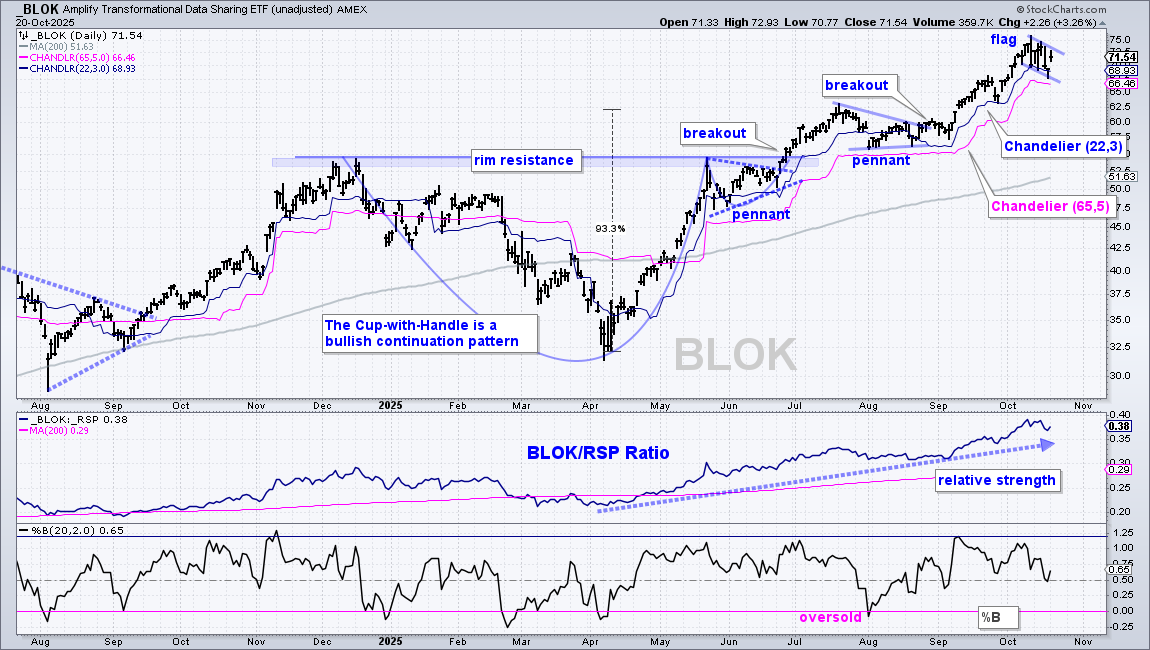
The chart below shows the Transformational Data Sharing ETF (BLOK), which was featured in late August as the pennant formed. BLOK broke out in late August, dipped into the first week of September and surged to new highs with a steep advance. The blue line marks the Chandelier Exit (22,3), which is 3 ATR(22) values below the 22-day high. It rises as long as price rises and acts as a trailing stop. BLOK fell the last six days, but did not close below the exit line.
I consider the Chandelier Exit (22,3) as the active trader’s exit. It is a tight stop that can trigger with a modest decline. Traders looking for wider stops can lengthen the parameters and use the Chandelier (65,5), which is currently at 66.46 (pink line). Note that I removed the Chandelier Exits from the first group of charts to reduce chart clutter.
Healthcare SPDR Breaks Pennant Line
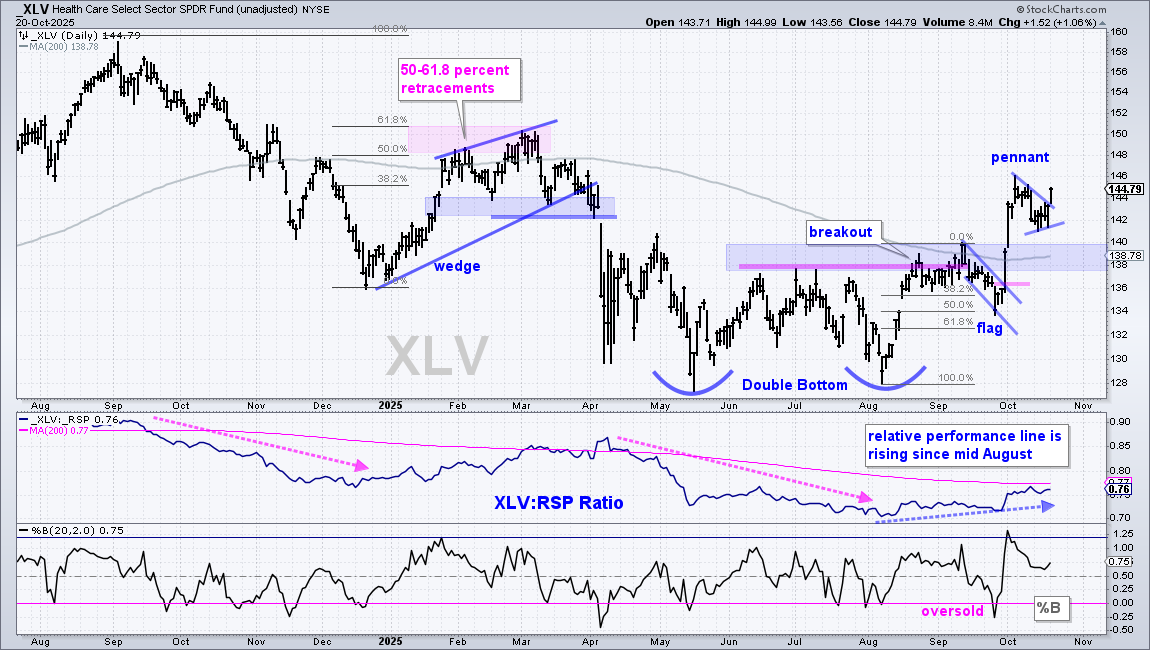
The Healthcare SPDR (XLV) remains on our radar because it came to life with two strong surges since August and a rising relative performance line (middle window). Long-term, XLV broke Double Bottom resistance with a surge in mid August and then surged well above the 200-day SMA in early September. Short-term, the ETF consolidated with a pennant the last two weeks and broke the pennant line with a surge on Monday. This breakout is short-term bullish, and within a bigger bullish environment.
Note that XLV could move below the pennant lows and still be in a long-term uptrend. Should this happen, I would watch for support in the 138-140 area. Here we have broken resistance turning support and the 200-day SMA, which is starting to turn up.
Two Leading ETFs from the Industrial Sector
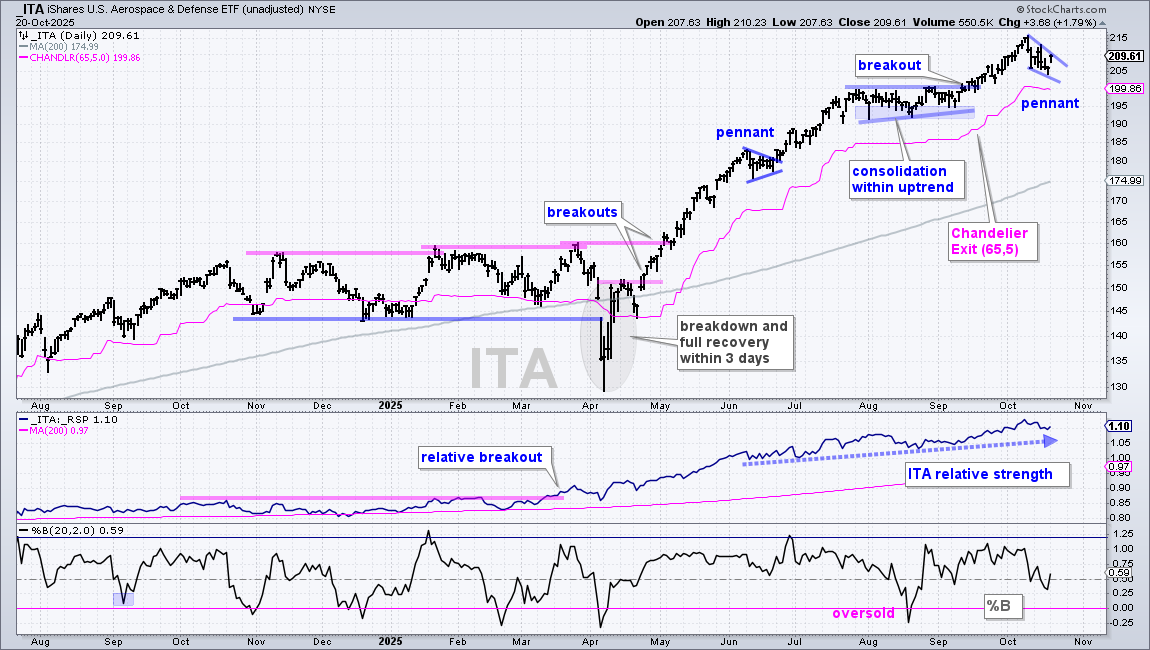
The next chart shows the Aerospace & Defense ETF (ITA) forming a small pennant within a leading uptrend.
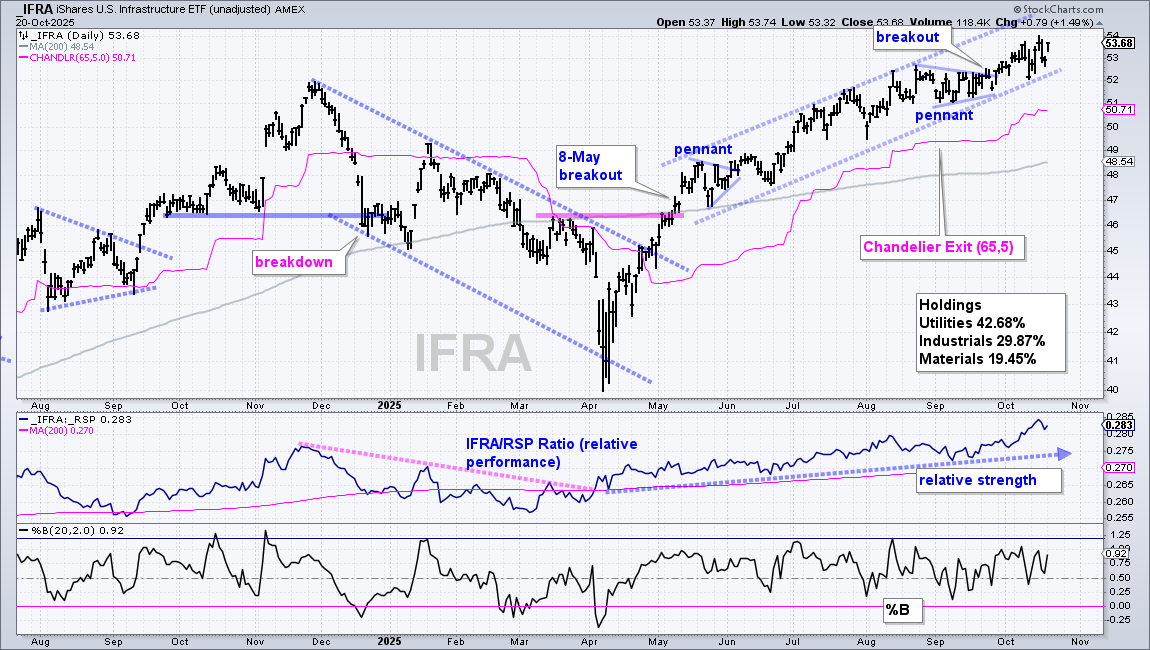
The next chart shows the Infrastructure ETF (IFRA) extending on its pennant breakout in late September.
Water Resources Breaks Wedge Line
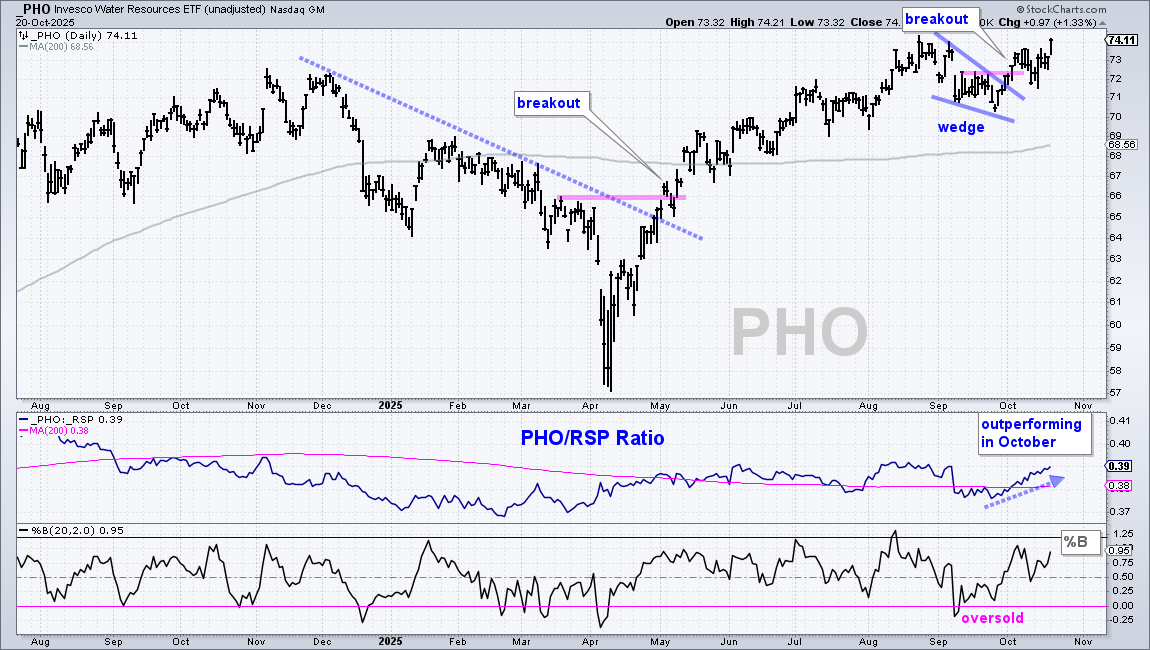
The next chart shows the Water Resources ETF (PHO) with a new high in August, a wedge correction into September and a breakout in early August. This wedge is a small correction within the bigger uptrend. The breakout signals an end to this pullback and a resumption of the bigger uptrend. In the middle window, the PHO/RSP ratio turned up in October as PHO starts to outperform the broader market.
DISCLAIMER: This content provided strictly for informational and educational purposes. It should not be interpreted as an offer to buy or sell any security, nor as a solicitation to engage in any investment activity. Nothing here constitutes a recommendation regarding any specific security, portfolio, transaction, or investment strategy.
At times, the author or affiliates may hold positions or interests in securities discussed. Any stocks or examples mentioned are not endorsements or suggestions to purchase. This material does not consider your individual financial goals or circumstances, and you should seek guidance from a qualified financial or investment adviser before making any trading or investment decisions.
Past performance does not guarantee future results.
Send feedback to support(at)trendinvestorpro.com or use the contact form.