

Headlines
- Archer Daniels Breaks Flag Line
- Costco Reversals with Two Gaps
- Emerson Firms above Rising 200-day EMA
- Trane Technologies Breaks Wedge Resistance
- Network Appliance Challenges Flag Resistance
- Samsara Attempts to Bottom
I will update the Market Regime page later today.
Previous Reports with Stock Trends, Setups and Breakouts
October 8th: AVGO, CRWD, WMT, AMGN, INCY, COR and CAH
October 1st: COIN, MSFT, CSCO, AMD, HEI and ROK
September 24th: ADSK, DGX, DRS, MELI, AEE, CNP, ETR and EVRG
September 10th: COIN, DASH, GILD, HWM, KTOS, MKSI, PLTR and VEEV
September 3rd: DIS, BROS, ELF, EW, DRS, AMZN and QCOM
Today’s report features two stocks from the Consumer Staples sector, two from the Industrials sector and two from the Technology sector. This is a relatively balanced approach that may help should the market turn volatile in the coming weeks.
Archer Daniels Breaks Flag Line
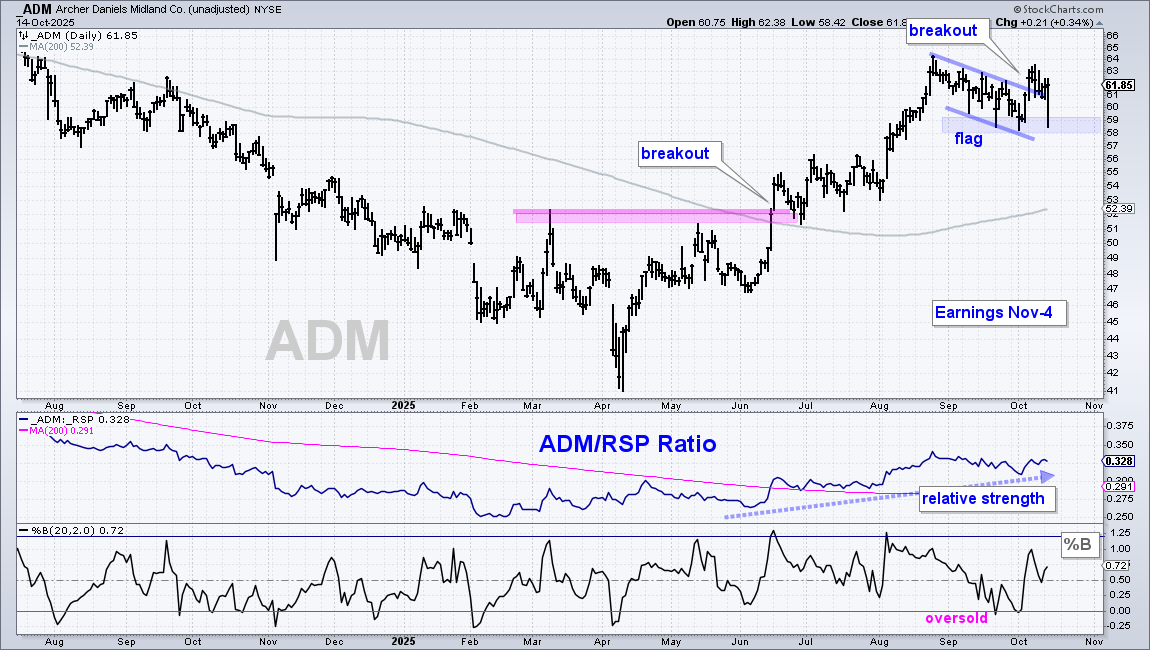
Archer Daniels Midland (ADM) formed a bull flag within a leading uptrend and broke out last week. Long-term, ADM broke out with a surge in mid June and continued higher into August. Price is in a long-term uptrend with price above the rising 200-day SMA. ADM fell back in September with a falling flag, found support in the 58-59 area and broke out with a surge in early October. This breakout signals an end to the correction and a resumption of the bigger uptrend. ADM bounced off the 58-59 area three times in as many weeks. This area marks support and a close below 58 would argue for a re-evaluation. The middle window shows the price-relative (ADM/RSP ratio) breaking above its 200-day SMA in June and moving higher (relative strength). The lower window shows %B becoming oversold as the flag formed.
Costco Reverses with Two Gaps
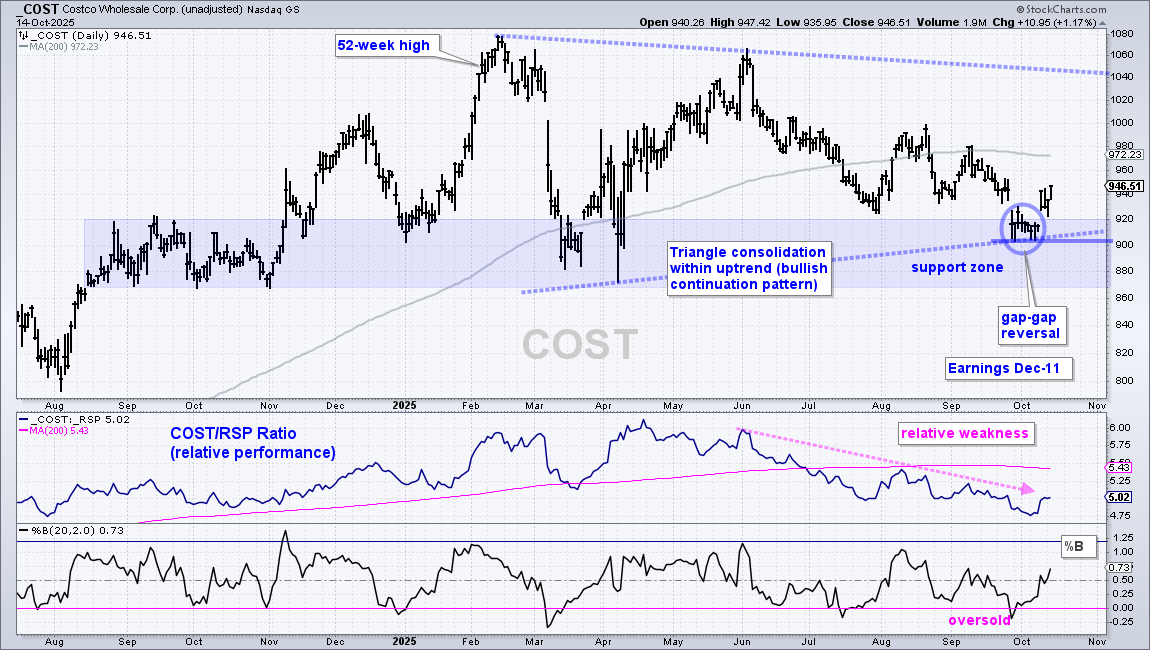
Costco (COST) has lagged the broader market since April, but the price chart sports a large triangle consolidation and the stock reversed the downswing within this triangle. COST led the market in 2023 and 2024 with a rise from 460 to 1000. It tagged another new high in February, but then fell sharply in March and moved into a trading range. The blue shading marks a support zone in the 870-920 area, while the dashed lines show a possible triangle. Note that this triangle is forming after the big advances in 2023-2024. Thus, it is a consolidation after an extended advance and a bullish continuation pattern. A breakout at 1060 would be bullish. Within the triangle, the swing was down from June to late September as COST fell from 1060 to 900. The stock caught my eye because it reversed with a gap down, consolidation and gap up (blue circle). This pattern is similar to an island reversal. This reversal is bullish as long as the October low holds (900).
Plan your Trade, Trade your Plan and Diversify
There are two ways to approach these short-term setups.
First, trade them as swing trades. A falling flag or wedge breakout is bullish and this signal remains valid until a break below the re-evaluation level, which is usually the low just before the breakout. For short-term trading, I usually set a profit target and close one third to one half of the position when this target is reached. A trailing stop is then placed to ensure that the entire trade does not result in a loss.
Second, use short-term setups to participate in the bigger uptrend. Bullish setups stem from short-term oversold conditions, falling wedges/flags or pullbacks. Instead of a re-evaluation level, the exit signal is based on a long-term trend change and a trend-following exit. Signals include a cross below the 200-day SMA, a major support break, a Chandelier Exit or a Keltner Channel break. This means the potential loss will be larger, but there is also a possibility to take part in an extended uptrend.
Thus, plan before making the trade, and then trade according to that plan. Also consider position sizing and diversification to spread the risk.
Emerson Firms above Rising 200-day EMA
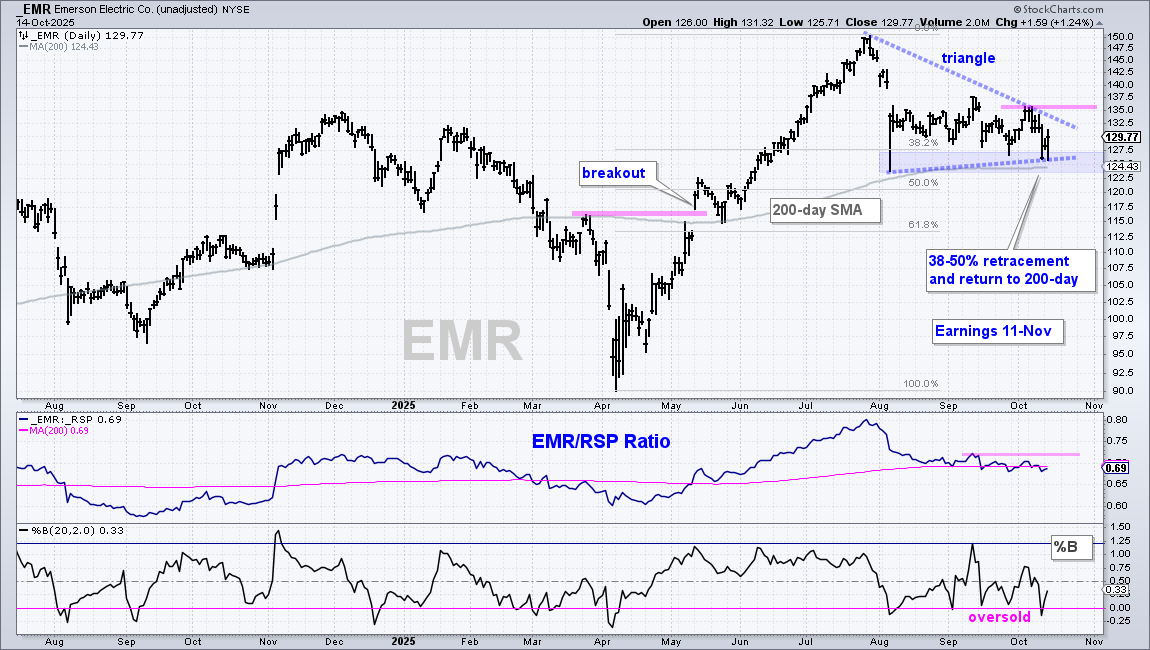
Emerson Electric (EMR) led the market with a 60+ percent surge from April to July and then corrected with a move back to the 200-day SMA. The stock hit new highs in July and remains in a long-term uptrend. Thus, the decline back to the 122.5-127.5 area is a correction within a long-term uptrend. Also, notice that this decline retraced 38-50 percent of the prior advance, which is normal for a correction. With lows in August, September and October, the stock established support in the 123-127 area (blue shading). I view this as a bullish setup zone that could mark the end to the correction. Also notice that %B became oversold on Friday. A triangle formed the last few months with resistance at 136. A breakout here would signal an end to the correction and a resumption of the bigger uptrend. After a breakout, I would use the 200-day EMA as the initial re-evaluation level.
Trane Technologies Breaks Wedge Resistance
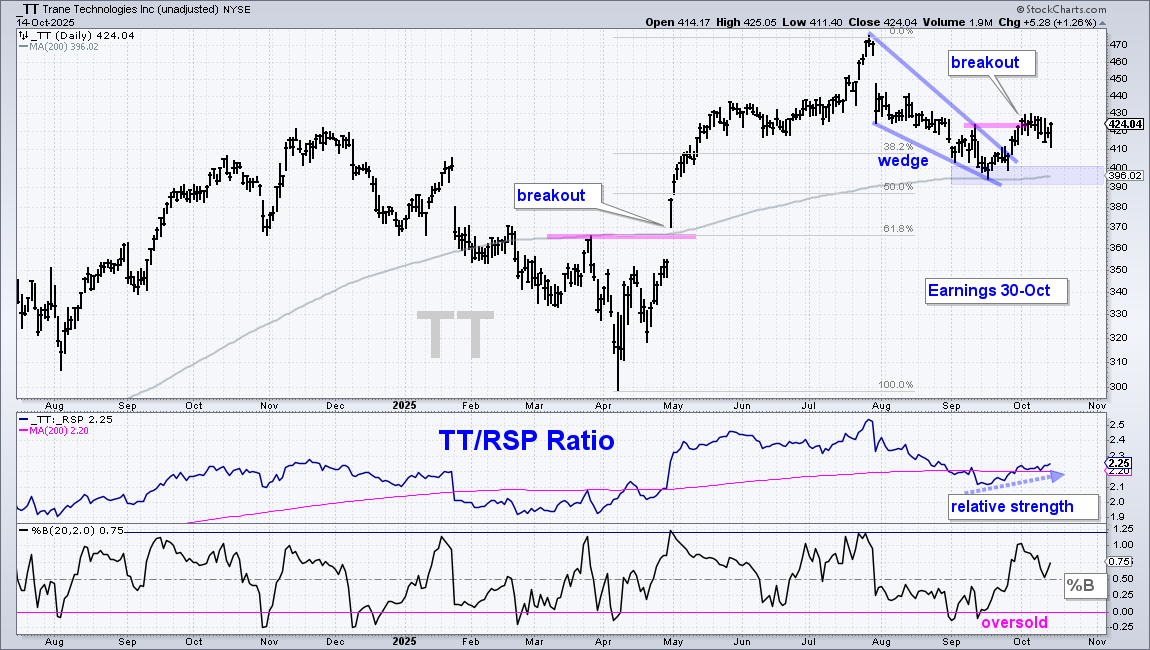
The next chart shows Trane Technologies (TT) with characteristics similar to Emerson Electric. TT surged from April to July and then corrected into September with a move back to the 200-day SMA. This decline retraced 38-50% of the prior advance and formed a falling wedge. Both the retracement amount and pattern are typical for corrections within bigger uptrends. TT broke short-term resistance with a surge in late September. This breakout signals an end to the corrective period and a resumption of the bigger uptrend. The blue shading marks support in the 390-400 area. A close below 390 would call for a re-evaluation. The middle window shows the TT/RSP ratio turning up the last few weeks and the lower window shows %B becoming oversold during the pullback.
Network Appliance Challenges Flag Resistance
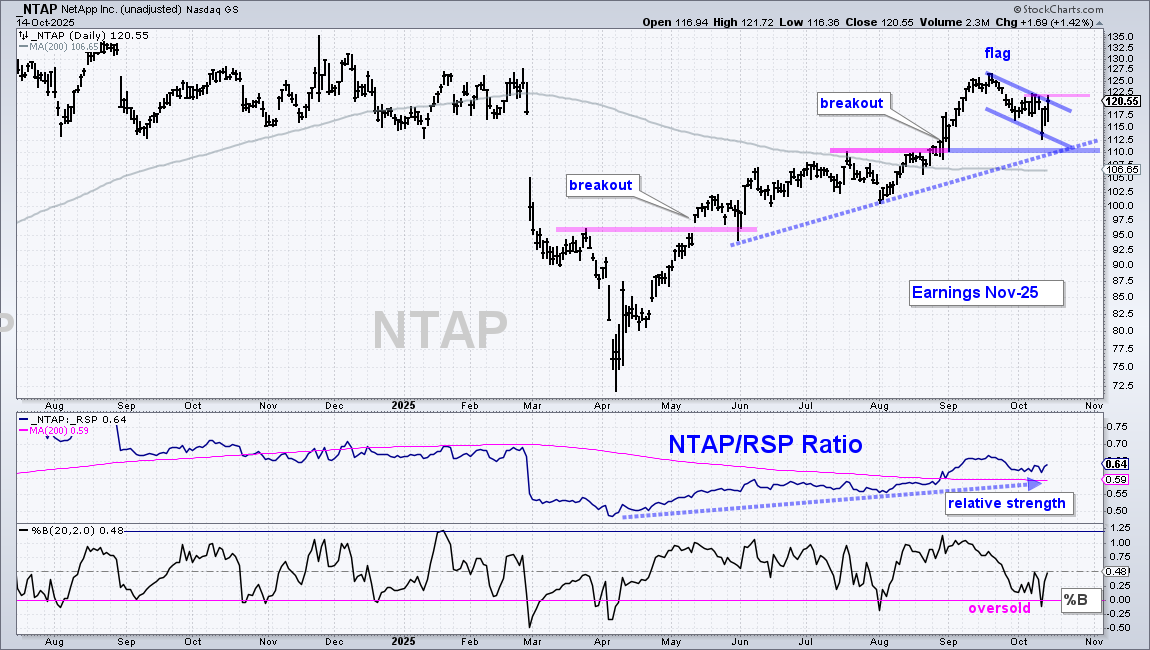
The Network Appliance (NTAP) chart and setup are similar to ADM. NTAP is in a long-term uptrend with price above the 200-day SMA. NTAP has yet to record a 52-week high and the 200-day SMA is not rising, but there is clearly an uptrend since the May breakout. Short-term, NTAP surged from early August to mid September and became overbought. It worked oversold these overbought conditions with a falling flag into October. I view this as a short-term bullish continuation pattern, or a pullback after a strong advance. NTAP fell sharply last Friday, but fully recovered the last two days and is poised to break out. A close below 113 would call for a re-evaluation. The middle window shows the price-relative breaking above its 200-day SMA in late August, which means NTAP is starting to outperform. The lower window shows %B becoming oversold with a dip below zero as the flag formed.
Samsara Attempts to Bottom
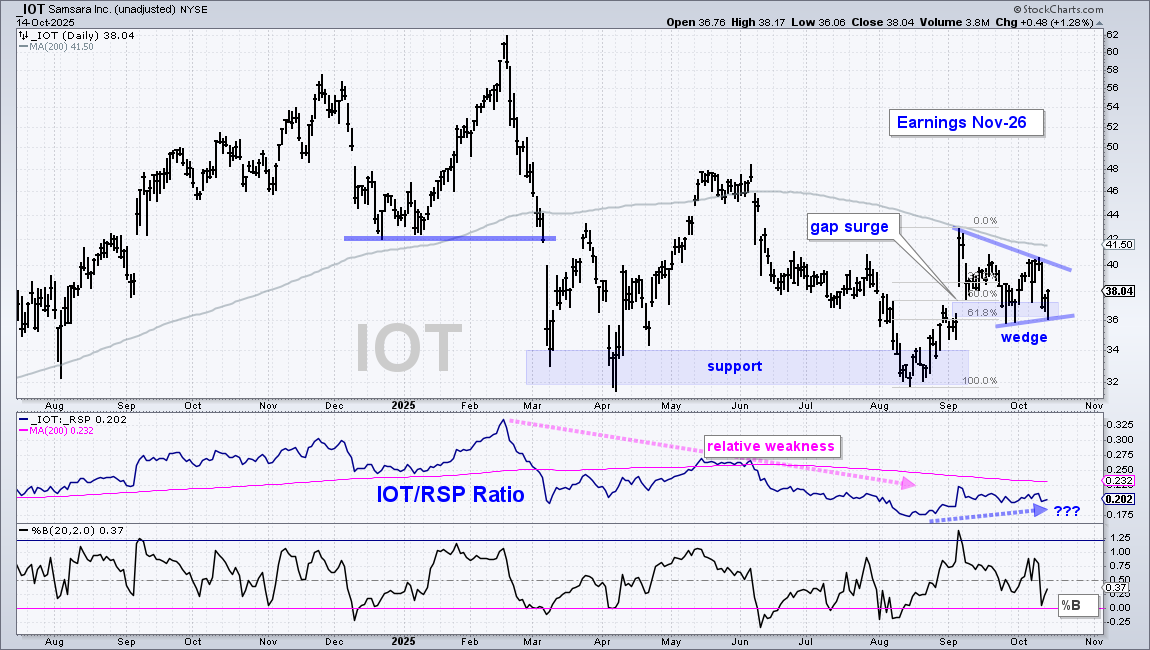
The next chart shows Samsara (IOT) below its falling 200-day SMA and in a long-term downtrend. The stock is also a long-term laggard because the price-relative is below its 200-day SMA. This setup is not like the others because the bet here is that Samsara is in the bottoming process and will trigger a long-term trend reversal with a break above the 200-day SMA. First, the stock established support in the 32-34 area from March to August (blue shading). Second, IOT surged 32% from mid August to early September and gapped above 38 (gap-surge). Third, the stock corrected after this surge with a classic setup forming. The decline to the 36 area retraced 61.8% of the prior surge and returned to the gap zone (blue shading). This is an area to watch for support and a possible reversal. A triangle formed and a breakout at 41 would be bullish. Note that this is a volatile stock with above average risk. Waiting for a breakout means waiting for an 8% advance and setting a stop 15% lower. Current levels (38) offer a chance to bottom pick with a better risk/reward ratio (8% risk). A close below the triangle lows (35.77) would negate the setup. As always…Plan your trade and then trade according to that plan.
DISCLAIMER: This content provided strictly for informational and educational purposes. It should not be interpreted as an offer to buy or sell any security, nor as a solicitation to engage in any investment activity. Nothing here constitutes a recommendation regarding any specific security, portfolio, transaction, or investment strategy.
At times, the author or affiliates may hold positions or interests in securities discussed. Any stocks or examples mentioned are not endorsements or suggestions to purchase. This material does not consider your individual financial goals or circumstances, and you should seek guidance from a qualified financial or investment adviser before making any trading or investment decisions.
Past performance does not guarantee future results.
Send feedback to support(at)trendinvestorpro.com or use the contact form.