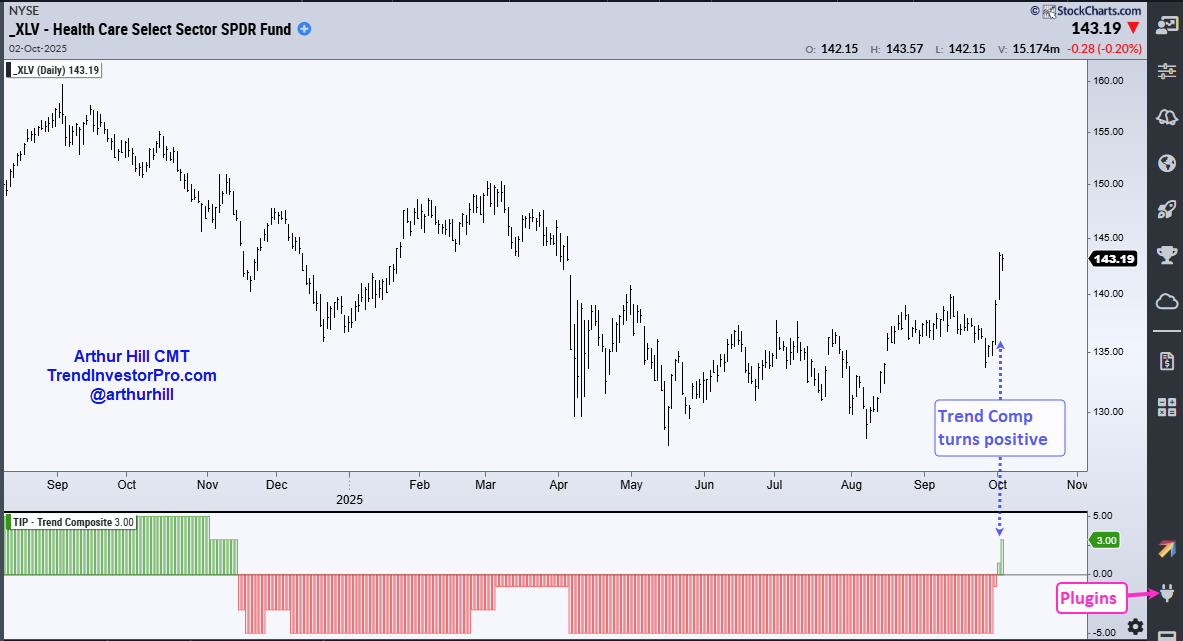
Welcome to the Friday Chart Fix! Today’s report focuses on the Healthcare sector, which sprang to life this week as the Trend Composite turned positive. This signal, however, was not the first bullish signal. Healthcare showed signs of capitulation at the end of July, there was a double bottom breakout in late August and a bull flag formed into late September. We will review these signals and show what to watch going forward. Within the sector, there were five new Trend Composite signals days and a dozen stocks have been uptrends for 100 days or more.
Trend Composite Turns Bullish for Healthcare SPDR
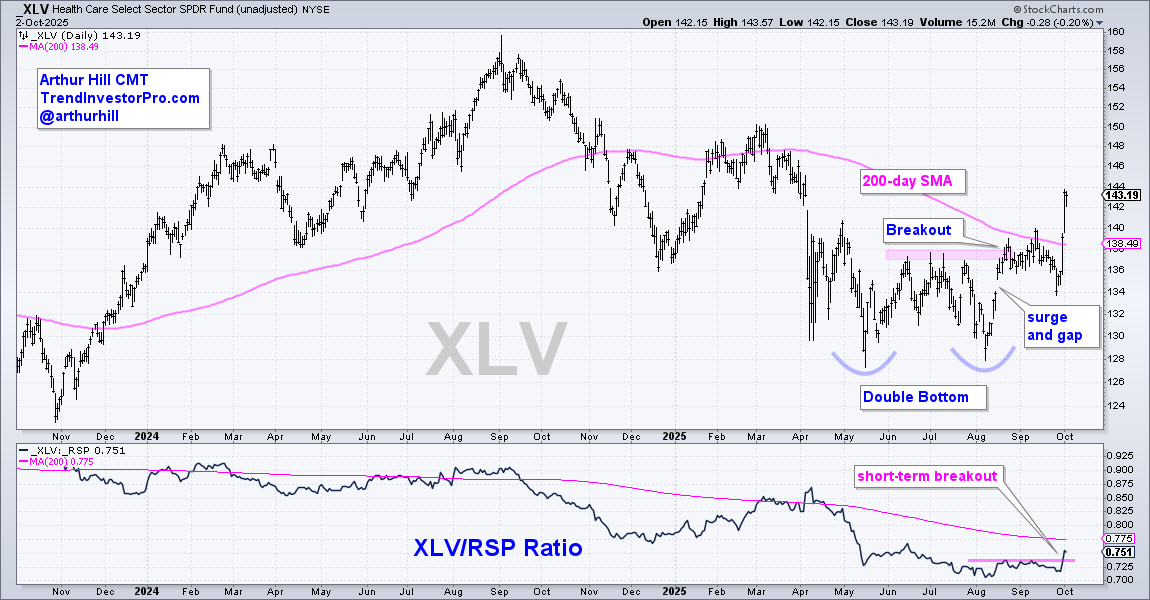
This Was Not the First Bullish Signal for XLV
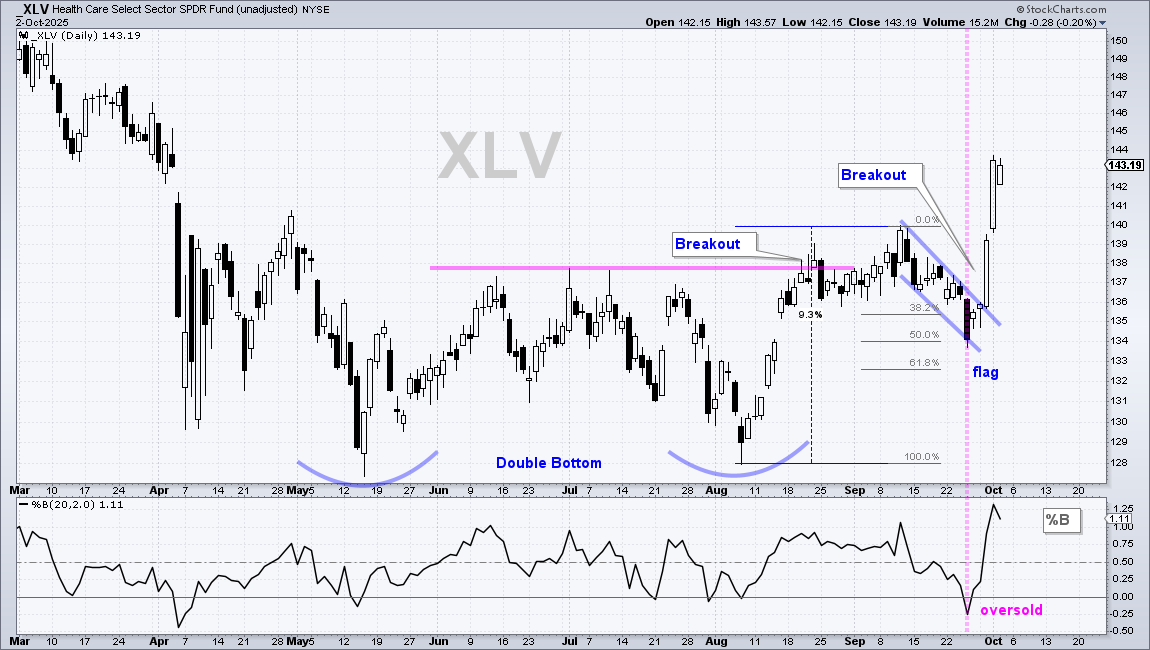
A Breakout and then a Shakeout
Follow the Trend and Monitor for Setups
36 Uptrends, 5 New Uptrends and 12 Old Uptrends
Recent Reports and Videos at TrendInvestorPro
Gold Gets Interesting as Copper Miners Break Out
Consolidation Setups in Industrials, Finance and Comm Services
The Trend Composite, an indicator that aggregates signals in five trend-following indicators, turned bullish this week for the Healthcare SPDR (XLV). This bullish signal reverses the bearish signal from November 14th 2024. With the Trend Composite at +3, this means four indicators are bullish and one bearish (4 -1 = 3). The five indicators are Bollinger Bands, Keltner Channels, StochClose, CCI and Moving Average Trend.
The Trend Composite is one of 11 indicators in the TIP Indicator-Edge Plugin for StockCharts ACP. Click here to learn more.
This Was Not the First Bullish Signal for XLV
Trend Composite signals are good for trend-following strategies and watchlists. Chartists looking to get a jump on trend changes need to monitor price action regularly. The Healthcare SPDR (XLV) first came across my radar on July 25th when it became long-term oversold. As noted in this report, the 40-week Rate-of-Change was below 10% and prior capitulation setups led to outsized returns over the next two years. Capitulation setups rarely mark the exact bottom, but can be part of the basing process. XLV eventually formed a Double Bottom and broke above its 200-day SMA (see report on September 12th).
A Breakout and then a Shakeout (Flag)
The breakouts did not hold as XLV fell back below its 200-day SMA and moved lower into late September. This, however, was not a bearish development. After a 9.3% advance and break above the summer highs, XLV was entitled to a correction. Based on the prior breakouts and analysis, XLV was on my watchlist for tradable setups and short-term oversold conditions.
XLV obliged with a classic bullish setup at the end of September. As the chart above shows, the ETF formed a falling flag that retraced around 50% of the prior advance and %B became oversold with a move below zero. This setup was shown to premium subscribers on September 30th. Note that TrendInvestorPro specializes in these types of setups for stocks and ETFs.
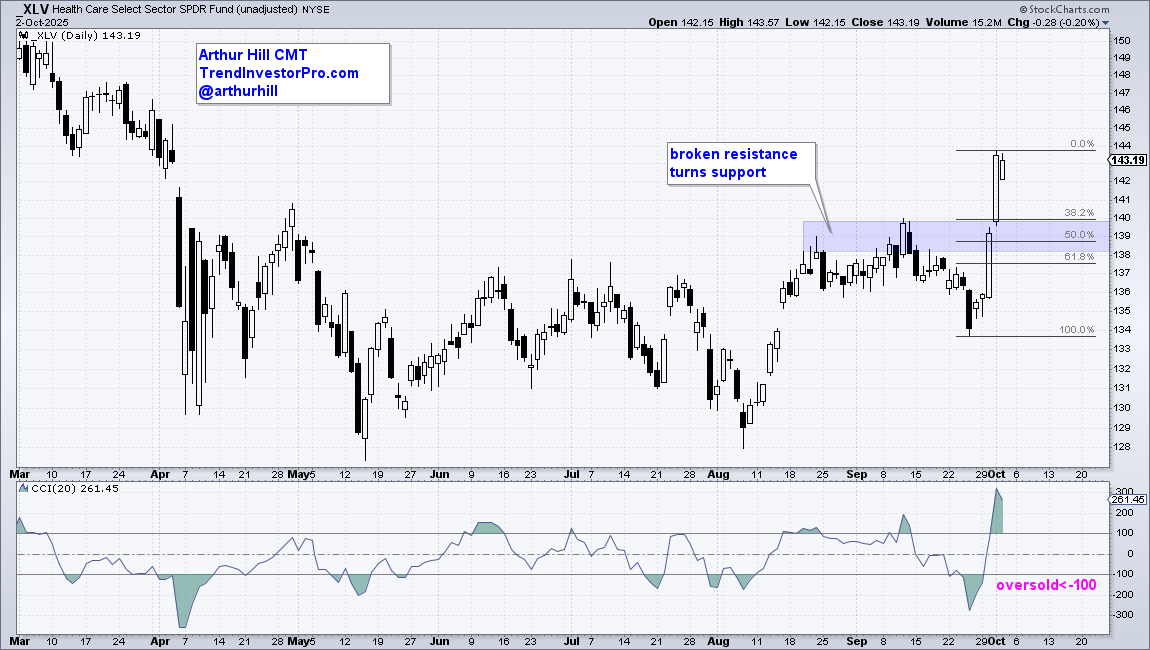
Follow the Trend and Monitor for Setups
The Healthcare SPDR (XLV) and healthcare stocks should be part of any trend-following strategy and on our watchlist for short-term setups. This means using oscillators to identify short-term oversold conditions within the bigger uptrend. Some of my favorites include CCI(20) below -100, %B(20,2) below zero or RSI(10) below 30. Chartists can also identify potential support zones based on prior breakouts and retracements. The chart below shows broken resistance turning into first support in the 138-140 area (blue shading). This area also marks a 50% retracement of the current surge. Should XLV pull back from current levels, this is the first area to watch for support.
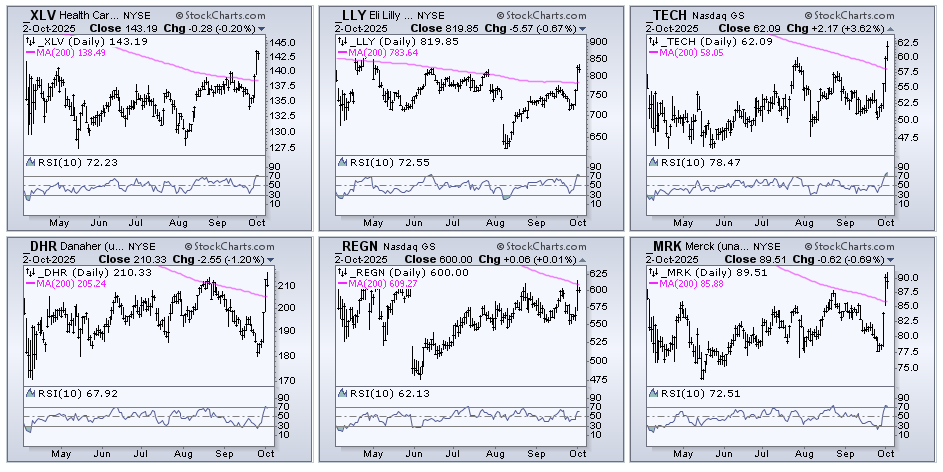
36 Uptrends, 5 New Uptrends and 12 Old Uptrends
TrendInvestorPro tracks Trend Composite signals for S&P 500 stocks. Currently, 36 stocks in the healthcare sector are in uptrends and 23 are in downtrends. The majority (61%) are in uptrends and this supports the uptrend in XLV. Of note, there were five new uptrend signals over the last five days. The CandleGlance charts below show these names with the 200-day SMA (pink line) and RSI(10). Put these names on your watchlist for tradeable pullbacks and short-term oversold conditions.
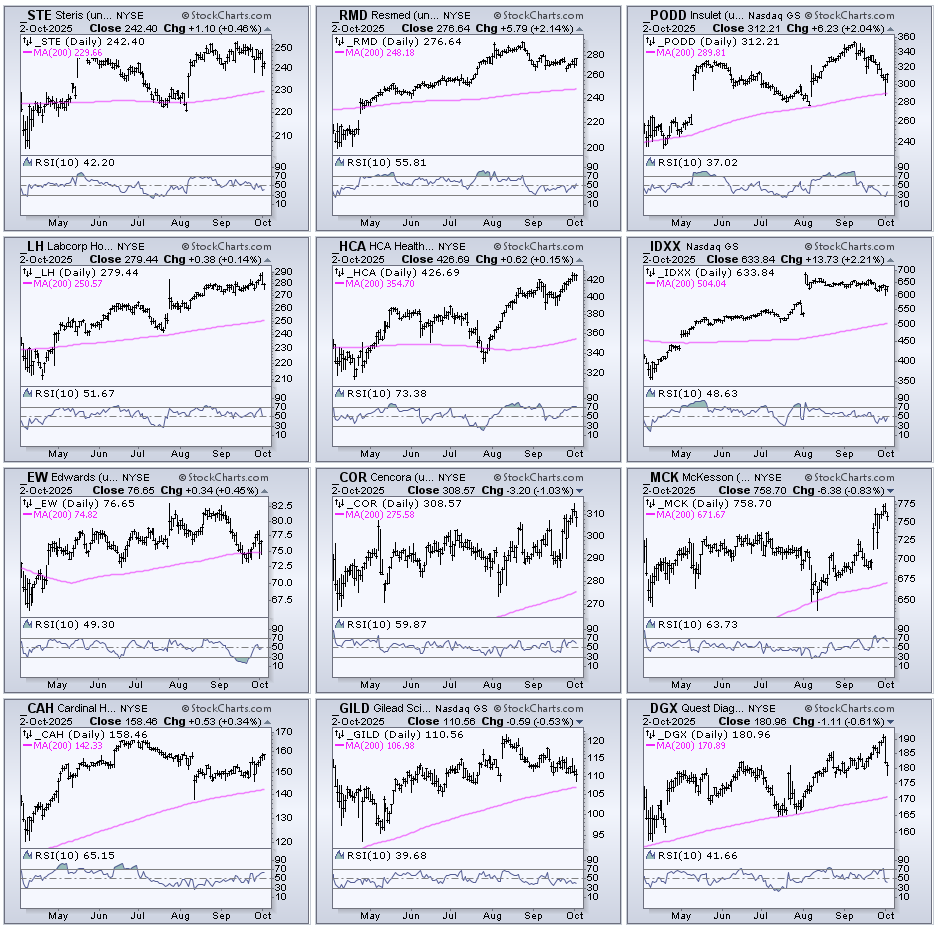
This week’s trend signals are positive for these five stocks. Note, however, that 31 stocks were already in uptrends. These 31 are actually leading because they turned bullish before XLV. The CandleGlance charts below show 12 healthcare stocks that have been in uptrends for 100 days or more. These stocks are leading within the sector – and some of them also sport short-term bullish setups.
")