This report was originally published on Thursday morning. I updated the charts on Saturday and changed the publish date. Thursday’s analysis still holds.
Programming Note for Next Week
I am posting reports and videos on Saturday (September 13th) because I am traveling next week and it will be difficult to post regular updates. These Saturday reports set the stage for next week with key support levels to watch, recent breakouts to monitor and the situation with market breadth. It is a bull market until proven otherwise.
The Fed meets next week with a policy statement expected on Wednesday, September 17t. Fed statements and actions can lead to above average volatility in the markets (bonds, stocks, gold, $USD). It is important to ignore intraday noise and put price action into perspective. Focus on the charts. Check the trend, pattern at work, active signal, re-evaluation level and support level.
Traveling Next Week – Limited Coverage
Saturday 13-Sept: Report/Video covering Broad Market and Alternative ETFs
Wednesday 17-Sep: Educational Report/Video
Monday 22-Sep: Report/Video with Chart and Analysis Updates
Weight of the Evidence Remains Bullish
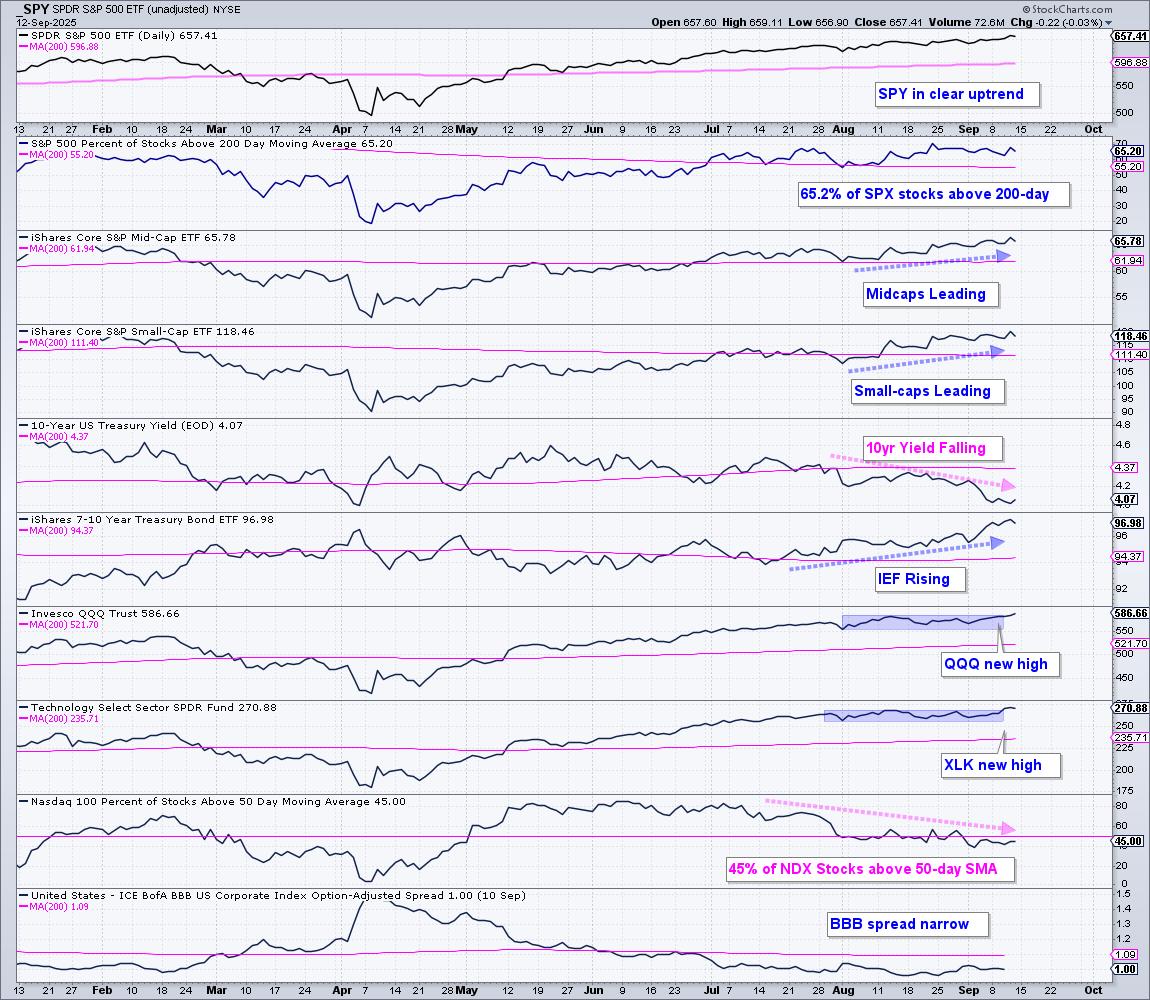
Here is the one paragraph/chart capturing stock market conditions. SPY remains in a strong uptrend with a new high this week. 65.2% of S&P 500 stocks are above their 200-day SMAs. Small-caps, mid-caps, banks and housing took the lead over the last six weeks as short and long-term rates fell sharply. Bond ETFs surged and IEF extended on its uptrend. QQQ and XLK hit new highs this week. Despite these new highs, Nasdaq 100 stocks are under pressure short-term because only 45% are above their 50-day SMAs (55% below). Overall, stocks are in a bull market, the Fed is set to ease and yield spreads are narrow. Goldilocks would be proud.
Small and Mid-caps Lead Since August
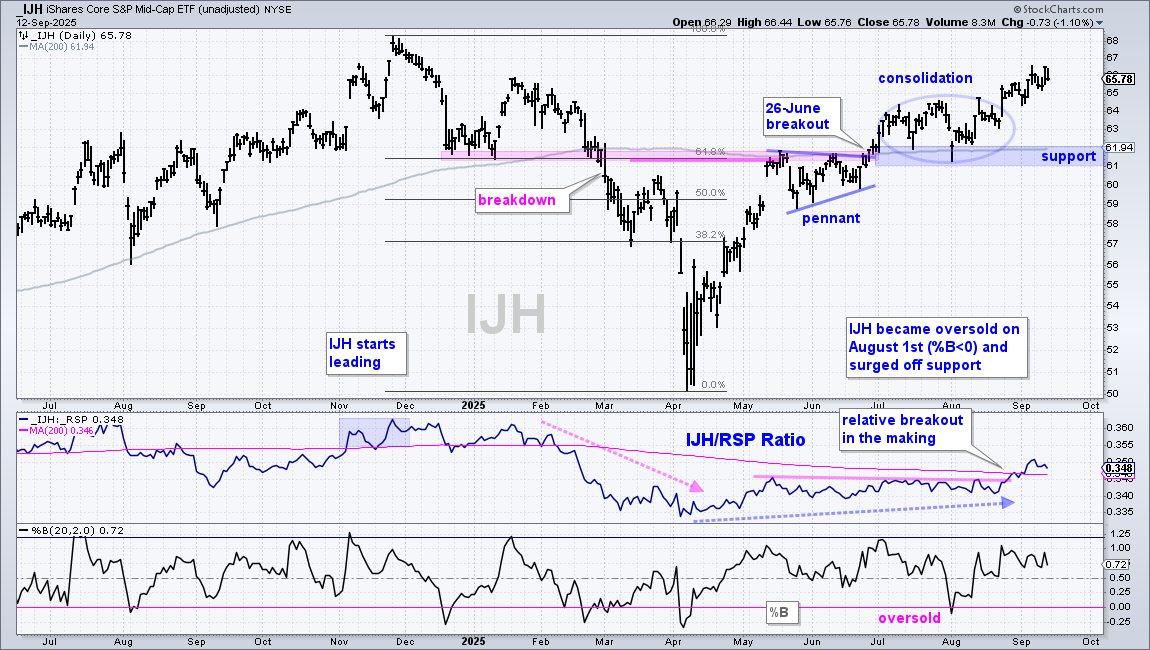
The S&P MidCap 400 ETF (IJH) reversed its downtrend with a breakout in late June, consolidated above the breakout zone and moved sharply higher the last six weeks. The July-August lows mark long-term support in the 61-62 area.
IJH is leading the broader market as the IJH/RSP ratio (middle window) moved above its 200-day SMA for the first time since early February. Relative strength in small-caps and mid-caps is not necessarily bullish. Notice that IJH started leading in November 2024 and peaked soon thereafter. The relative breakdown in mid February foreshadowed the price breakdown in early March.
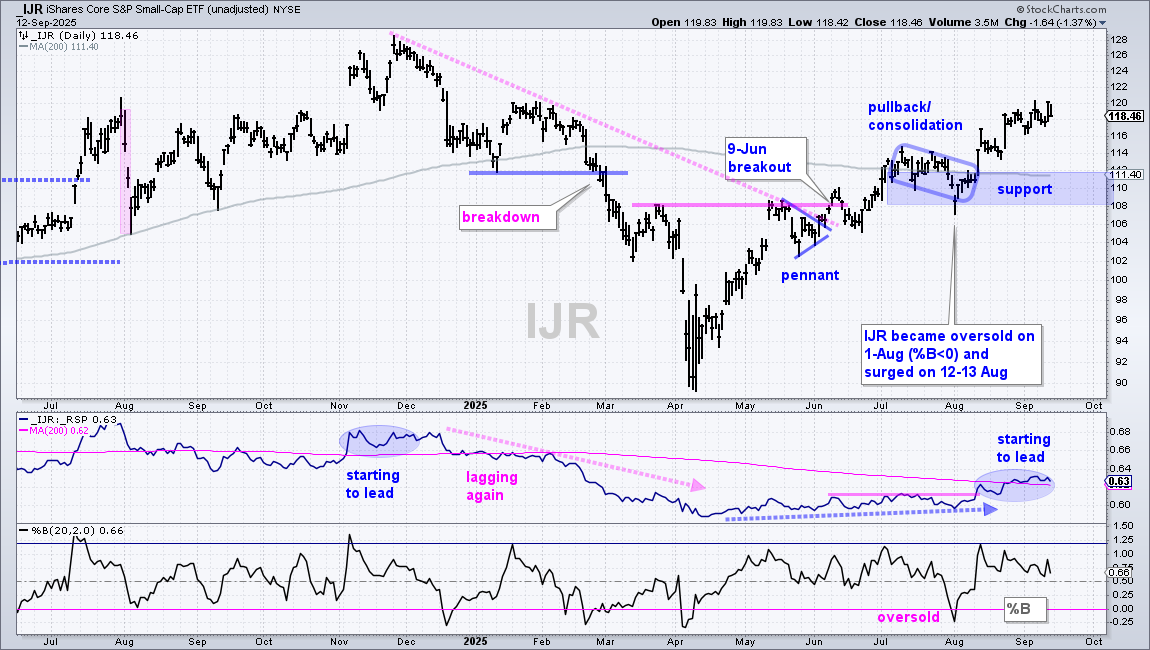
The S&P SmallCap 600 SPDR (IJR) is also in an uptrend and starting to lead. IJR broke out on June 9th, consolidated from early July to early August and broke out with a surge in mid August. The July-August lows and flat 200-day SMA mark support in the 108-112 area. A break here would reverse the uptrend.
Regional Bank ETF Stalls within Uptrend
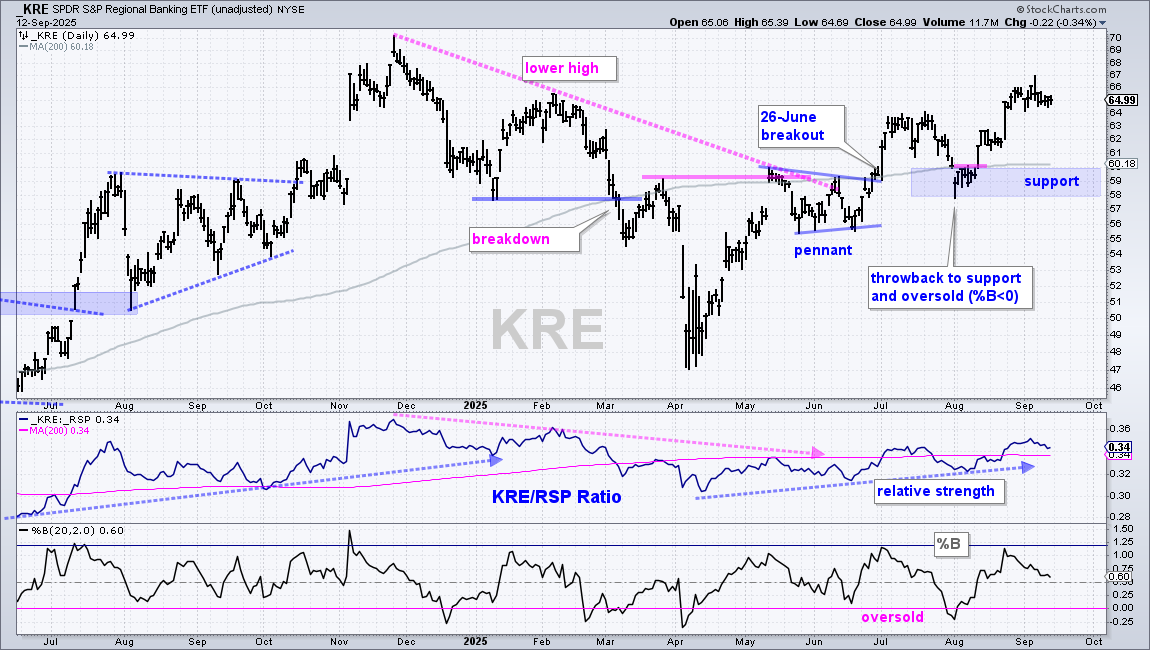
The Regional Bank ETF (KRE) is important to the small-caps ETFs (IJR/IWM) because the financials sector account for 20%. KRE broke out on June 26th with a move above the 200-day SMA and resistance from the March-May highs. There was a throwback to the breakout zone in early August, but the ETF ultimately held and moved sharpy higher in mid August. KRE stalled the last two weeks, but this is just a stall within an uptrend. Short-term, the ETF could pullback into the low 60s and maintain its uptrend. Long-term support is set in the 58-60 area. The middle window shows the KRE/SPY ratio rising since late April as KRE shows relative strength the last four months.
Technology SPDR Surges to New High
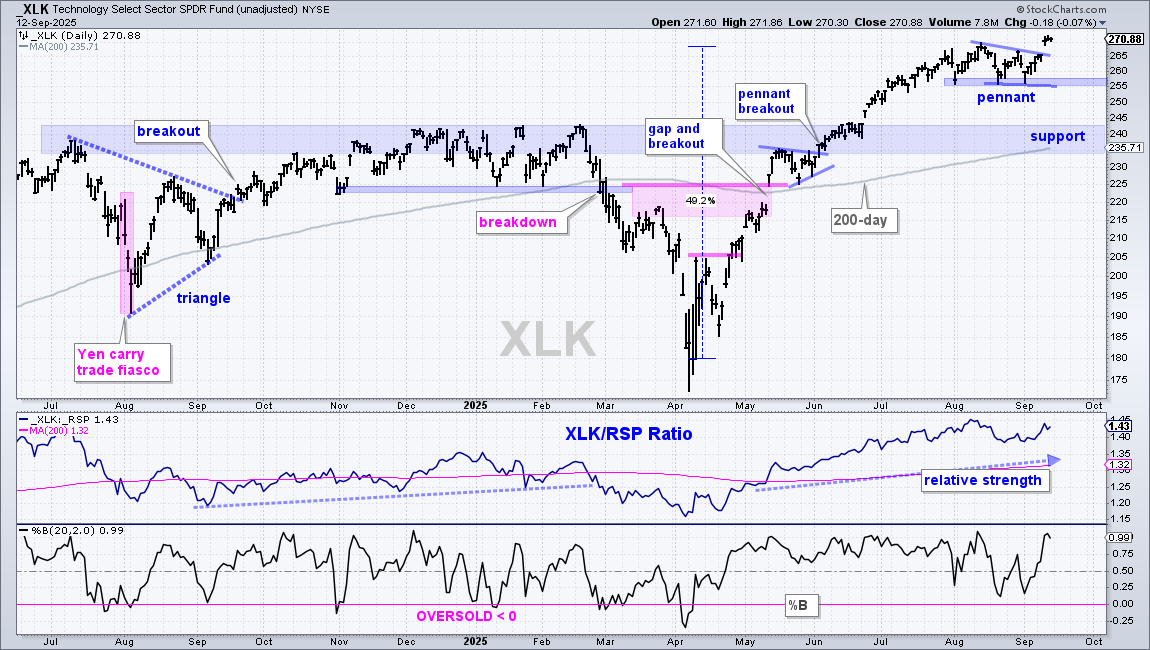
The Technology SPDR (XLK) surged to a new high with gap higher on Tuesday. NVDA (15.51%), AVGO (6.23%) and ORCL (5.00%) account for 26.74% of XLK. These three gapped sharply higher on the open. Elsewhere in the top ten: APPL fell 3.23% and CRM dropped 3.73%. Technically, XLK formed a pennant consolidation and broke out with a gap. A strong gap-breakout should hold. A close below 265 would show cold feet, but such a pullback could also occur with normal market volatility. The August-September lows mark first support at 255. A break here would be short-term negative and argue for a correction. Long-term support is set in the 240 area.
Mag7 ETF Maintains Uptrend
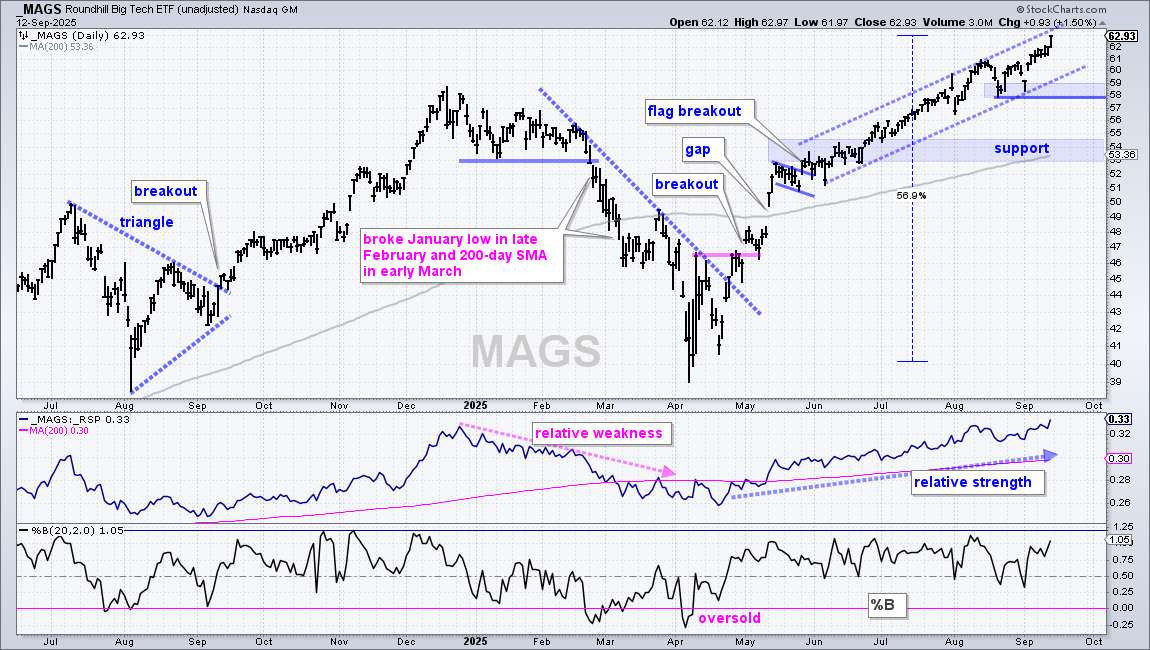
The Mag7 ETF (MAGS) remains in a steady uptrend since the flag breakout in late May (blue channel lines). After a stall in August, the ETF surged with a gap up on September 3rd and hit a new high last Friday. The lows from late August and early September mark first support at 58. A break here would reverse the upswing and argue for a correction within the bigger uptrend. Long-term support is set in the 54 area.
Follow up on Breakouts (ARTY, CIBR, SOXX, IGV, BLOK)
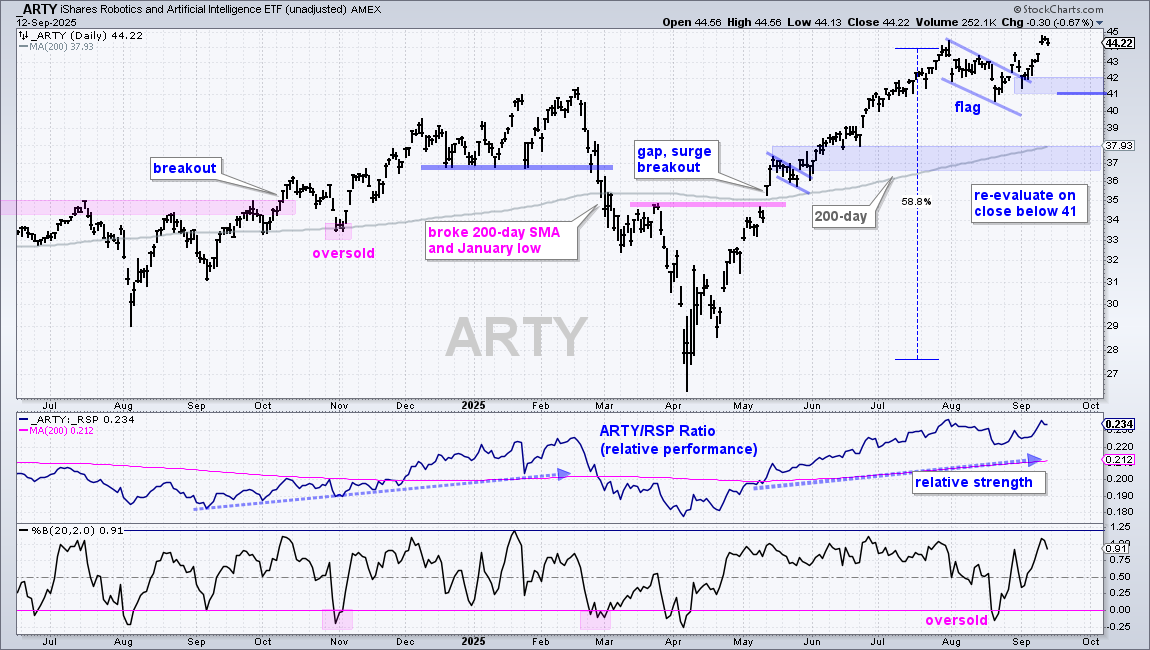
A basic strategy to partake in ongoing uptrend is to wait for oversold conditions, pullbacks and bullish continuation patterns (flags, wedges, pennants, triangles). The Robotics AI ETF (ARTY) met these conditions as %B dipped below 0 to become oversold on August 20th and priced pulled back with the falling flag. ARTY broke out with a surge in late August, pulled back to the breakout zone and surged to new highs this week. This signal is working out with re-evaluation support set at 41.
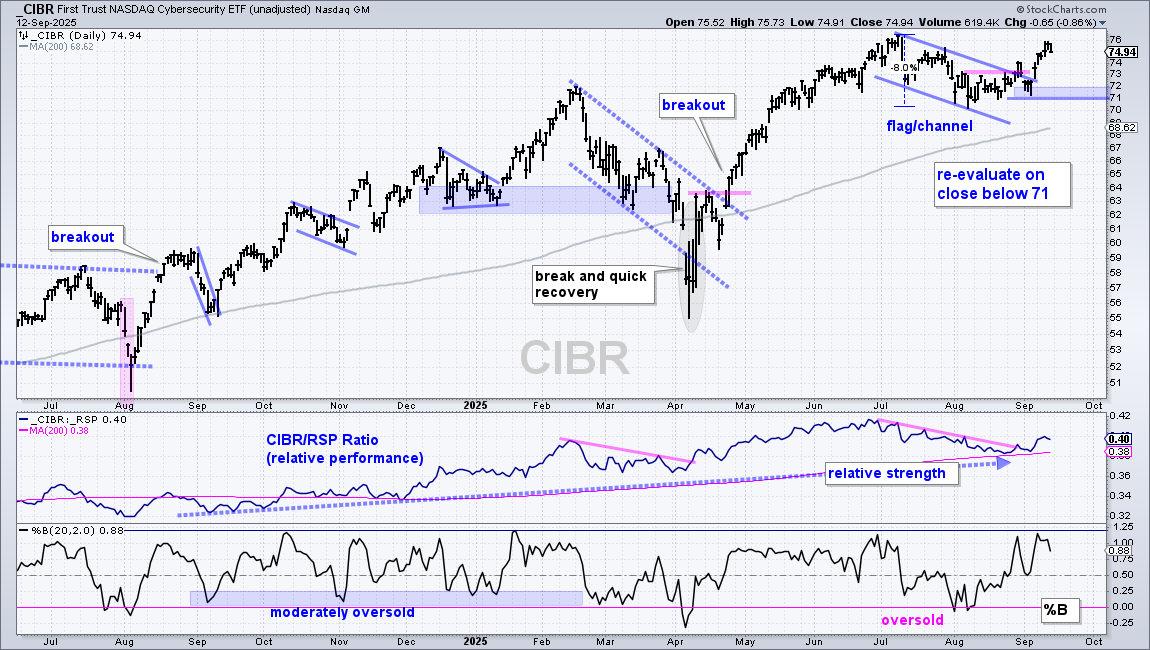
The next chart shows the Cybersecurity ETF (CIBR) with a falling flag/channel in July-August and a breakout in late August. %B was oversold in early August. CIBR broke out, fell back immediately after the breakout and then surged to 75 the last four days. This one is working with a re-evaluation support set at 71.
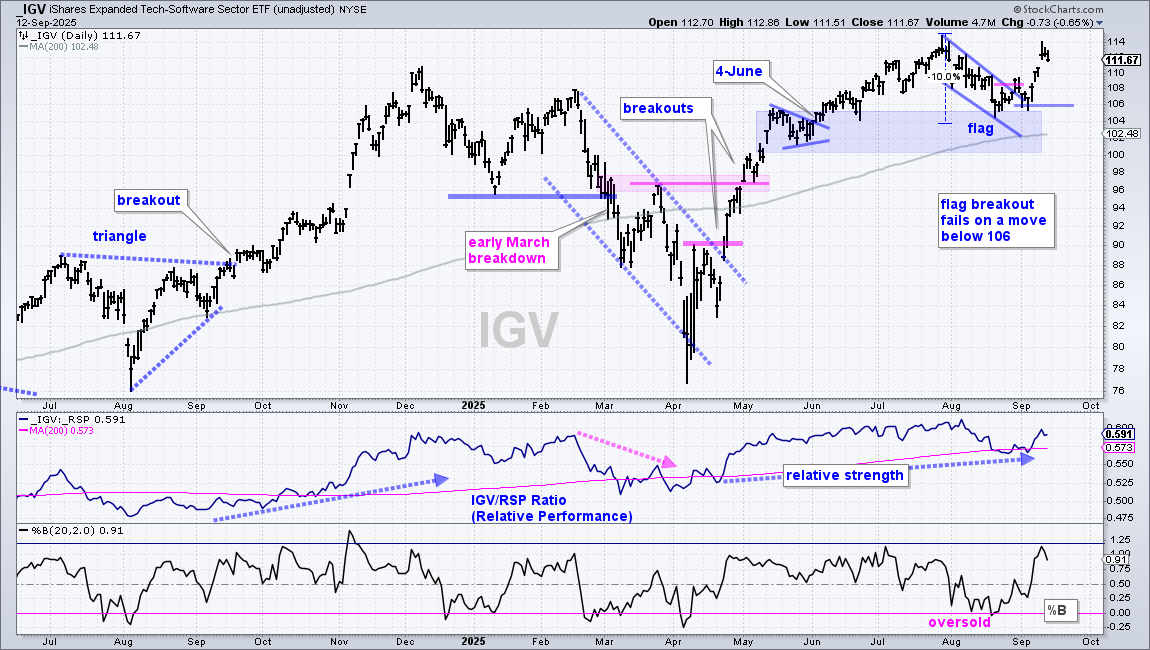
The next chart shows the Software ETF (IGV) with a falling flag in August, %B oversold in mid August and a breakout at the end of August. IGV also fell back immediately after the breakout, but ultimately held the 106 level on a closing basis and surged to 112 this week. A close below 106 would call for a re-evaluation.
The closing breakout for IGV occurred on August 28th with a close at 109.08. IGV opened at 109.19 on the 29th for a possible position based on the breakout. IGV is currently near 112, which equates to a 2.7% profit. Short-term traders may consider booking partial profits to ensure the entire position does not result in a loss. One could then set a trailing stop for the remainder (chart based, Chandelier Exit, Parabolic SAR or ATR Trailing Stop).
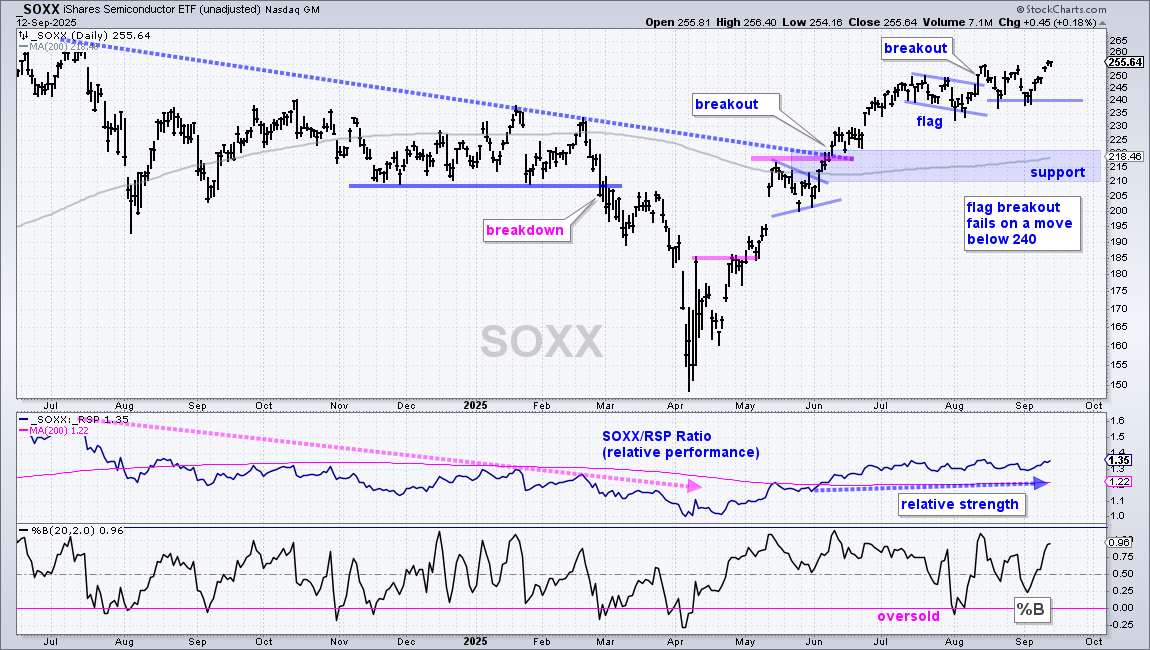
The next chart shows the Semiconductor ETF (SOXX) with a flag breakout in mid August and choppy price action the last few weeks. There were four intraday dips below 240, but SOXX did not close below this level. I use end-of-day bar charts with signals based on closing prices to reduce whipsaws. A close below 240 would negate the flag and argue for a deeper correction. Long-term support is set in the 210-220 area.
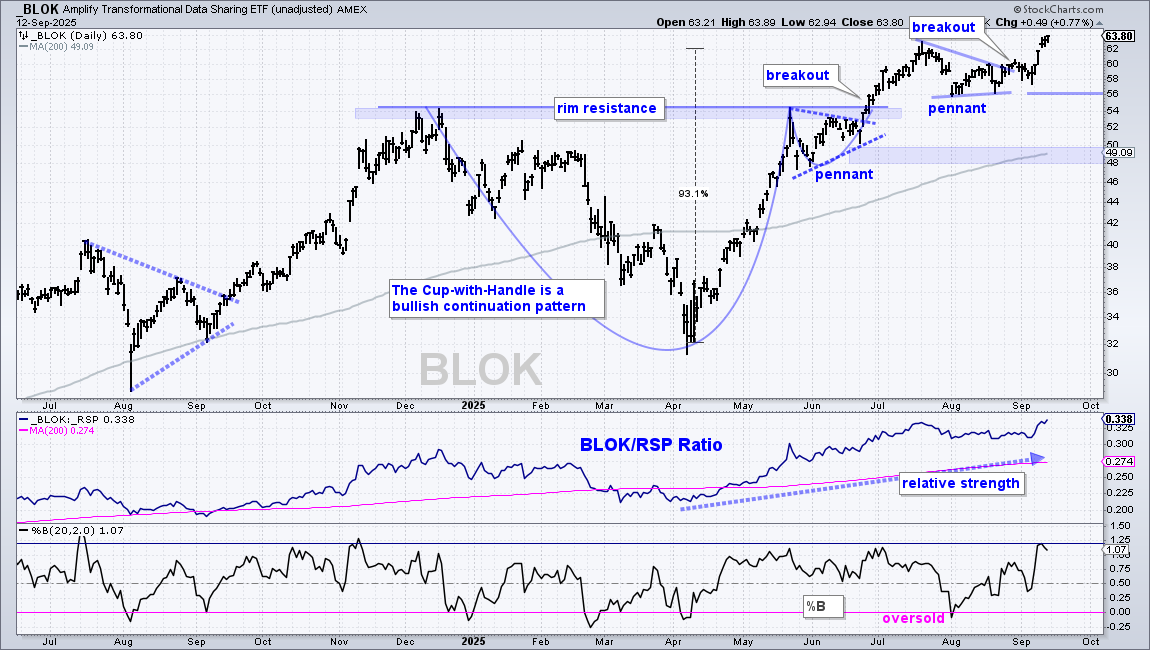
The next chart shows the Transformational Data Sharing ETF (BLOK) with an oversold condition on August 1st and a pennant breakout in late August. This breakout occurred near 60 and BLOK is currently at 62.75 (+4.5%). For short-term traders, this may be a good spot to book partial profits and ride the remainder with a trailing stop. A close below 56 would negate the pennant and argue for a deeper correction.
Semiconductor ETF Breaks Pennant Line
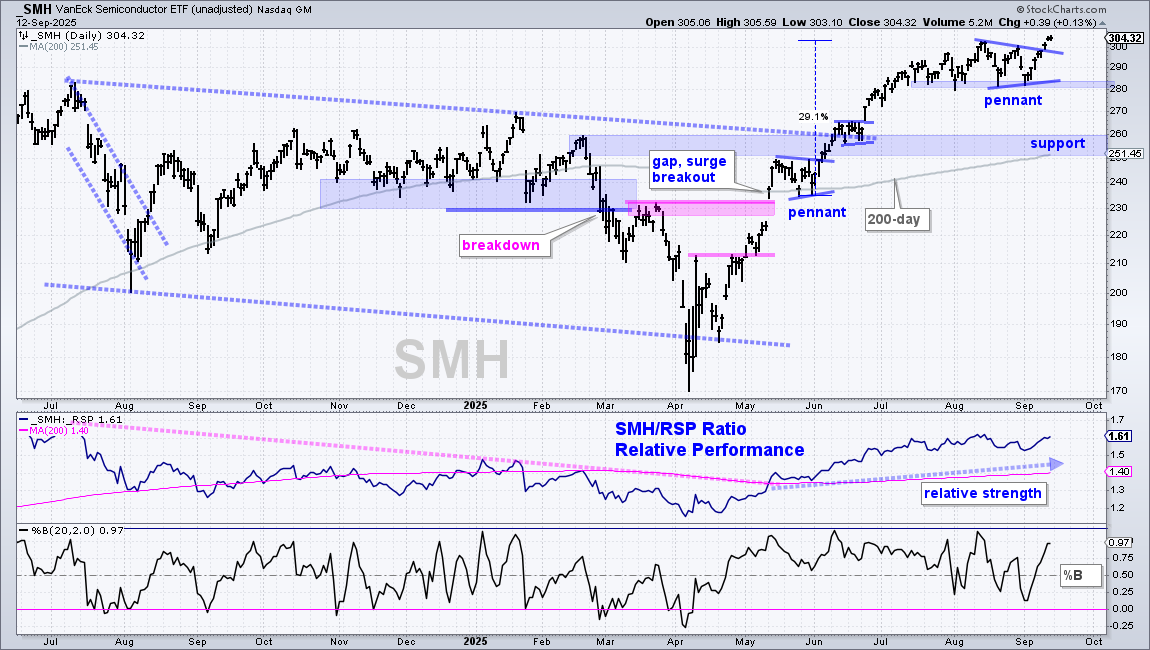
The Semiconductor ETF (SMH) was pushed higher by NVDA (+3.855), TSM (+3.79%) and AVGO (+9.77%), but weighted down by SNPS (-35.84%). The first three account for 42.54% of the ETF, while Synopsis weighs just 3.77%. Overall, SMH remains in leading uptrend with a new high in mid August and price well above the rising 200-day SMA. After a 29% surge, the ETF consolidated with a small pennant and broke the pennant line on Wednesday. The July-August lows mark short-term support at 280. A break here would be negative, but only negative enough to signal a correction within an uptrend. Long-term support is set in the 250-260 area.
ARK ETFs Consolidate after Big Gains
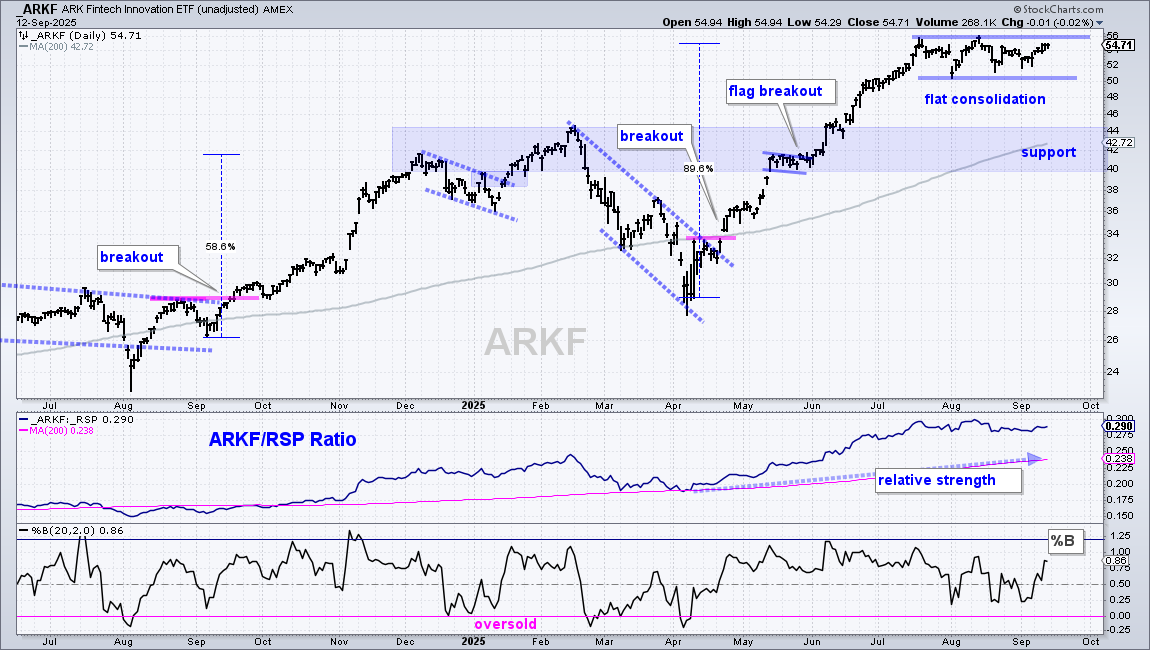
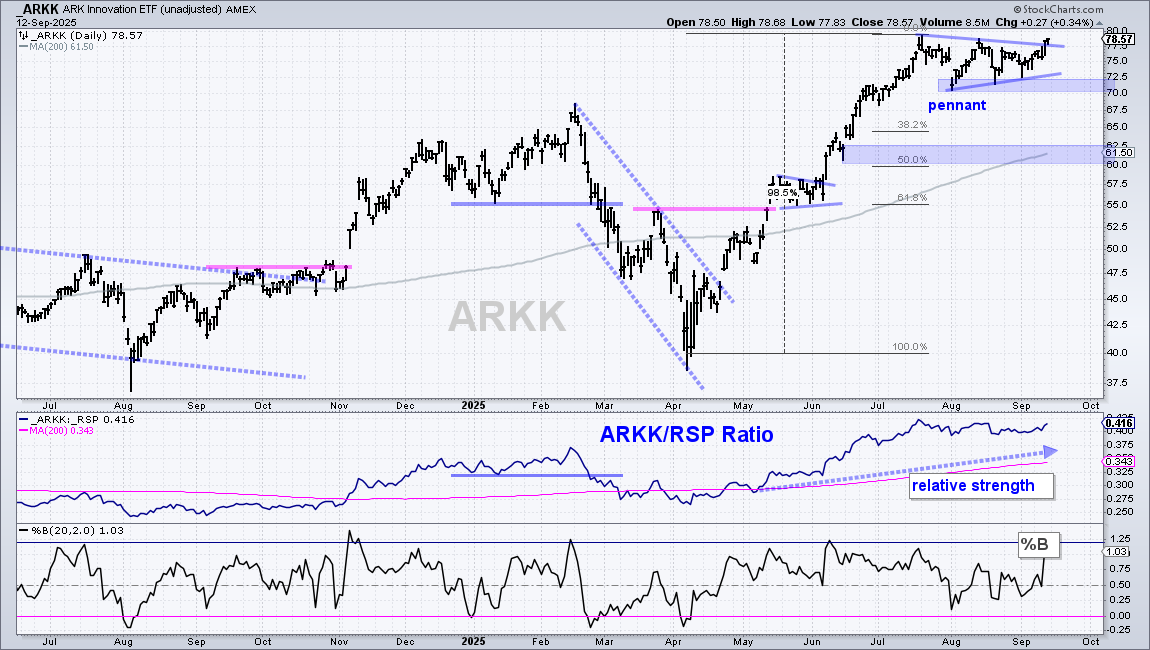
The ARK Fintech Innovation ETF (ARKF) and ARK Innovation ETF (ARKK) are both in long-term uptrends and leading. However, they peaked around July 20th and traded flat the last seven weeks. Technically, a consolidation after a sharp advance is a bullish continuation pattern. Such consolidations digest the prior gains and alleviate prior overbought conditions, which were present in mid July. Consolidation breakouts would be bullish and signal a continuation higher. Should these two fail to break out, which support from the August lows. Breaks here would be short-term negative and argue for a correction.
Utilities SPDR Breaks Out
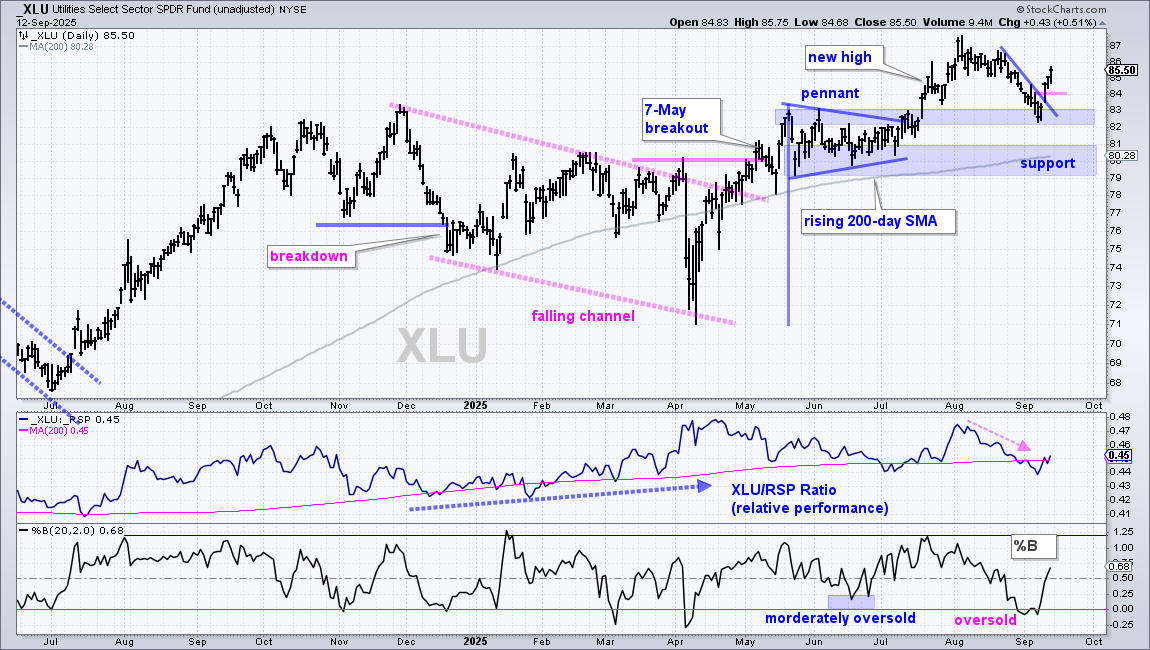
I featured the Utilities SPDR (XLU) over the last two weeks, and most recently on Tuesday. Even though XLU was not outperforming, it was in an uptrend with a new high in early August and price well above the rising 200-day SMA. This means pullbacks present opportunities. XLU pulled back from early August to early September and became oversold with two %B dips below 0. XLU reversed the short-term downswing with a surge and breakout the last two days. This signals an end to the corrective phase and a resumption of the bigger uptrend. Long-term support is set in the 79-81 area.
DISCLAIMER: This content provided strictly for informational and educational purposes. It should not be interpreted as an offer to buy or sell any security, nor as a solicitation to engage in any investment activity. Nothing here constitutes a recommendation regarding any specific security, portfolio, transaction, or investment strategy.
At times, the author or affiliates may hold positions or interests in securities discussed. Any stocks or examples mentioned are not endorsements or suggestions to purchase. This material does not consider your individual financial goals or circumstances, and you should seek guidance from a qualified financial or investment adviser before making any trading or investment decisions.
Past performance does not guarantee future results.
Send feedback to support(at)trendinvestorpro.com or use the contact form.