The Fed begins its Economic Symposium in Jackson Hole today and the messages from this meeting could create sparks in the intermarket area. Interest rates and bonds are especially sensitive to Fed-related news. This extends to the Dollar, Gold, stocks and possibly even crypto. I have no idea what Powell will say, but my guess is that he will remain data dependent. Surprise, surprise. Forget the Fed and focus on the charts!
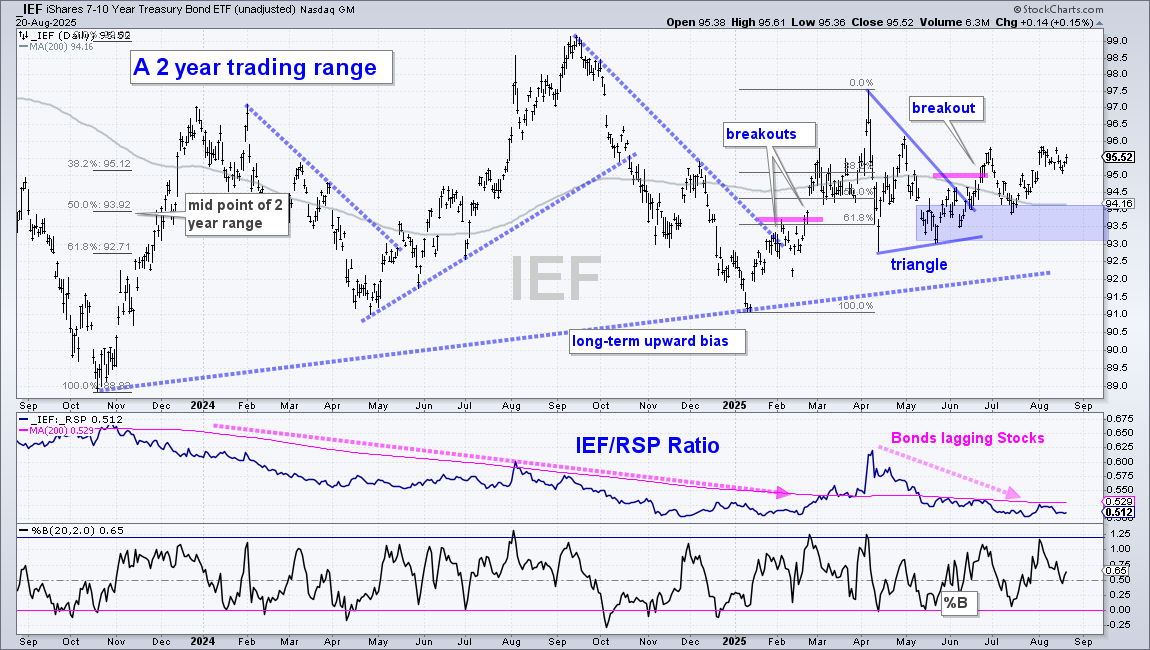
7-10Yr TBond Holds above 200-day SMA
The 7-10Yr TBond ETF (IEF) has gone nowhere for two years, but I still see a slight upward trajectory on this chart. Short-term, IEF surged in the first quarter, corrected in the second quarter with a triangle and broke out in late June. This bullish breakout remains the active signal, and it is holding for the most part. The May and July lows combine to mark a support zone in the 93-94 area (blue shading). I will remain bullish until a close below 93.
The middle window shows the IEF/RSP ratio falling from April to July. This means safe-haven bonds are underperforming risk assets, which is bullish for stocks. The ratio flattened in August, but remains below its 200-day SMA. An upturn and break above the 200-day would show bonds outperforming stocks. This would be negative for stocks.
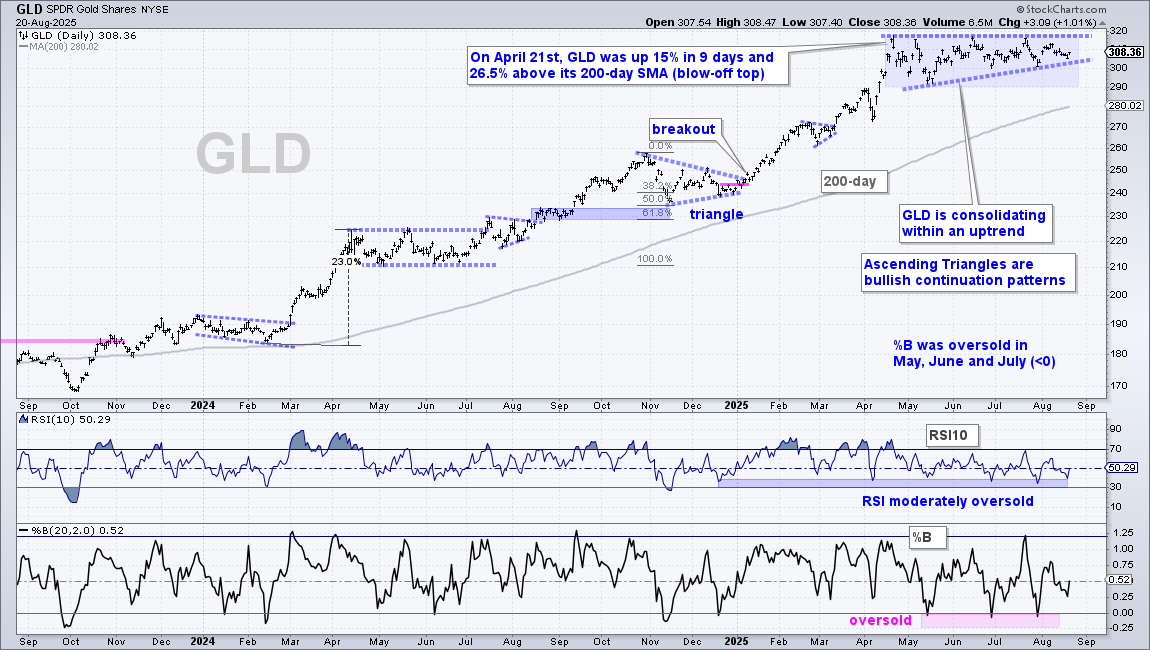
Gold Stalls within Bullish Continuation Pattern
There is no change in the Gold SPDR (GLD). The long-term trend is up with a new high in April. GLD became extremely overbought in April and moved into a consolidation the last few months. This consolidation is working off overbought conditions and paving the way for the next move. An Ascending Triangle form and this is a classic bullish continuation pattern that represents a rest within the uptrend. A breakout at 320 would be bullish. A break below 300 would negate the Ascending Triangle, but this would not be a bearish development because it would not affect the long-term uptrend. Instead, a deeper pullback would likely lead to the next oversold setup.
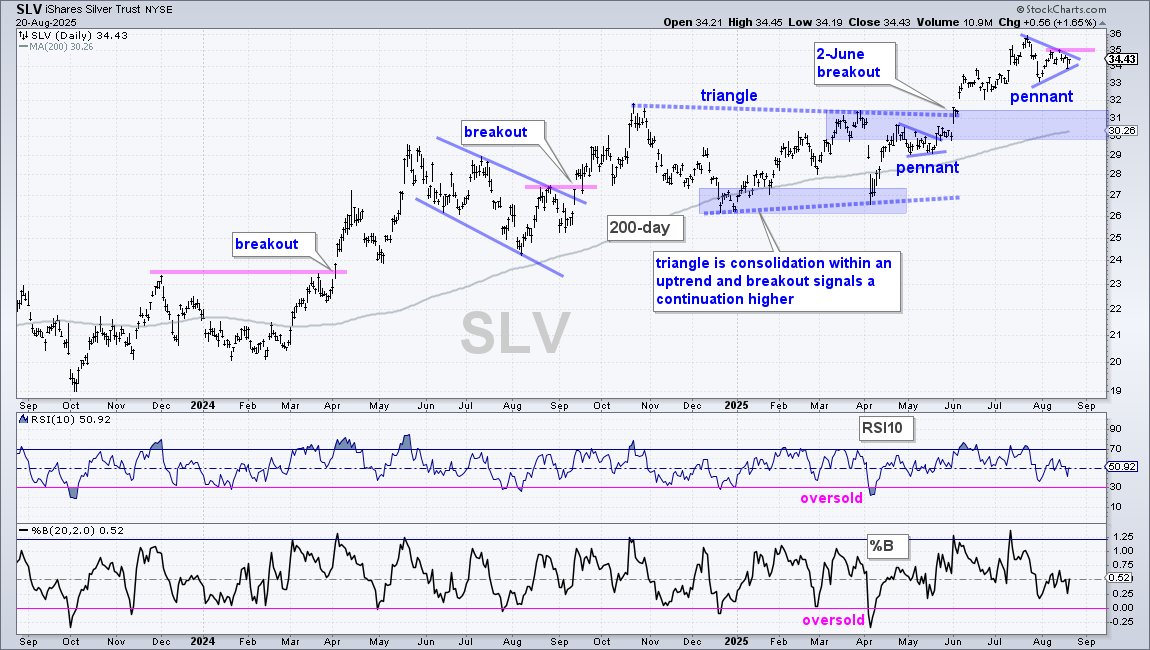
Silver Forms Short-term Bullish Pattern
The Silver ETF (SLV) was stronger than GLD from May to July. GLD was stuck in a consolidation, but SLV moved higher with a 20% gain from 30 to 36. After hitting a new high in mid July, the ETF consolidated with a pennant taking shape. This is a short-term continuation pattern that takes its bias from the prior move, which was up. A breakout at 35 would signal a continuation higher and open the door to new highs. Long-term, I am marking support in the 30-31 area. Here we have broken resistance turning support and the rising 200-day SMA. Should the pennant fail, this is the next area to watch for a tradable setup.
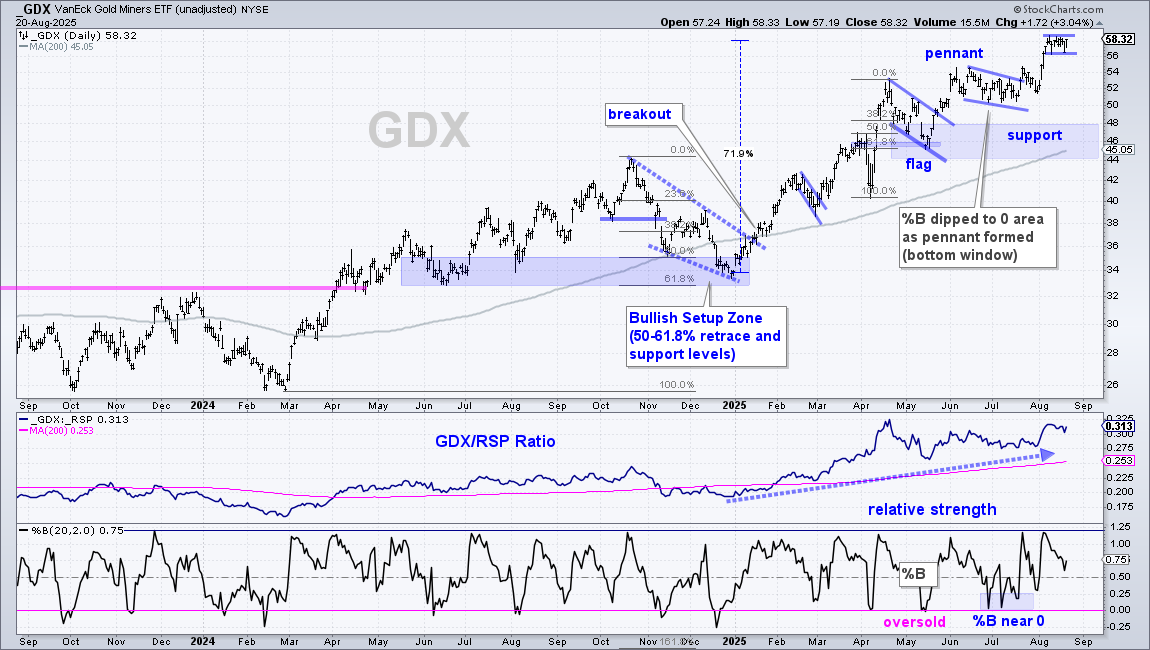
Gold Miners with High and Tight Flag
The Gold Miners ETF (GDX) remains on a tear with a 70 percent gain year-to-date. This advance is littered with short-term bullish continuation patterns: March flag, May flag and July pennant. Most recently, GDX surged from 52 to 59 in early August (five days) and then consolidated with a high and tight flag. This is a short-term bullish continuation pattern and a breakout at 59 would be bullish. Long-term support is set in the 44-48 area.
The smaller and tighter the pattern, the greater the chance of whipsaw. For example, GDX could break out at 59 and then fall back to 54. This would not affect the long-term uptrend, but it would negate the flag breakout. The key, as always, is to plan your trade ahead of time and then trade according to that plan. Plan for different scenarios so you are ready for whatever happens.
DB Base Metals Maintains Upswing
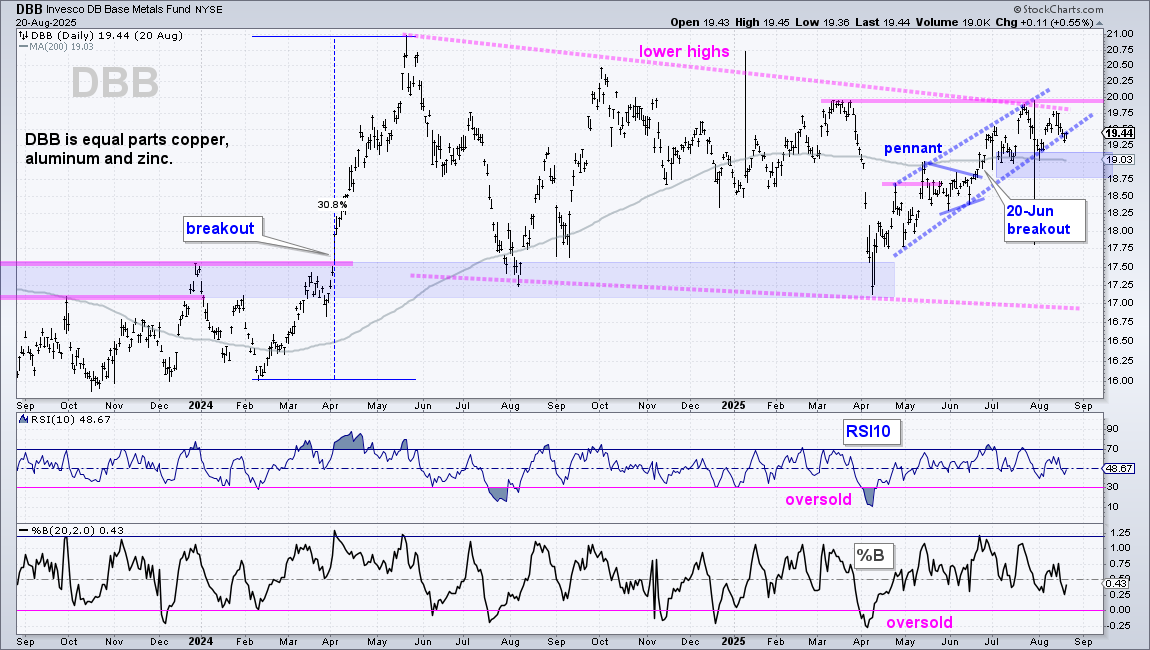
There is no change in the DB Base Metals ETF (DBB) as it hits resistance from the March high and holds support from the July low. Long-term, DBB remains in a downtrend (pink lines) with lower highs over the past year and resistance from the June high. A breakout at 20 would be most positive.
I remain focused on the upswing since the breakout on June 20th (blue dashed lines). The July-August lows, channel trendline and a buffer mark a support zone in the 18.75-19 area. The bulls have the edge as long as this level holds. A failure below 20 and a break below 18.75 would reverse the medium-term upswing.
Bitcoin Fails to Hold Flag Breakout
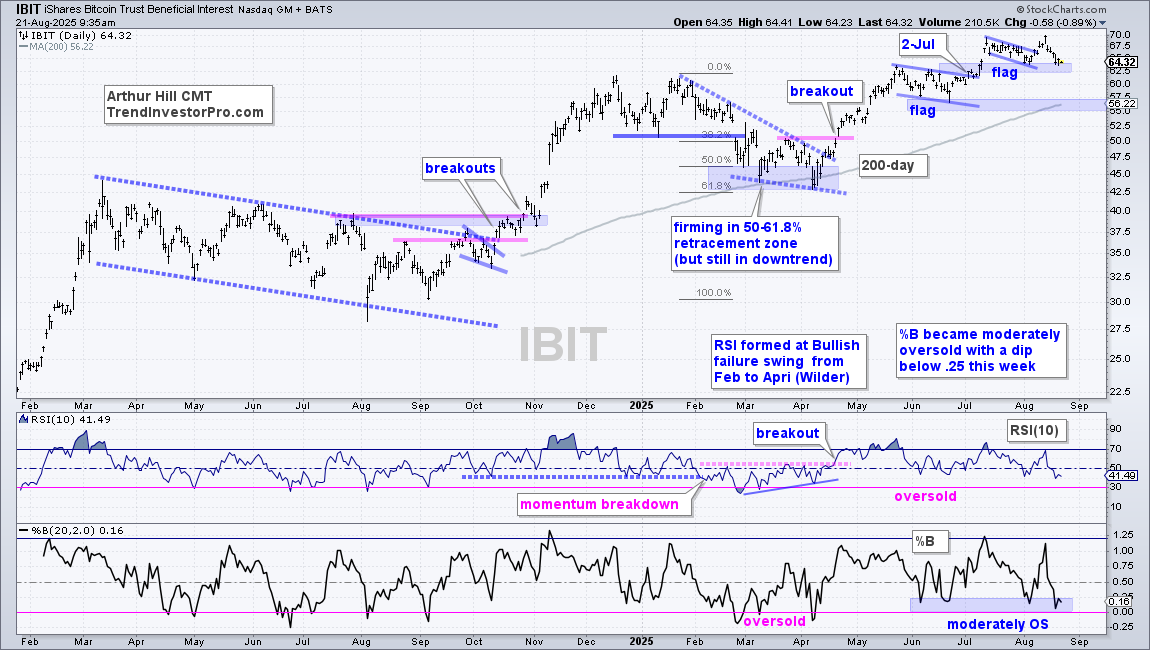
The Bitcoin ETF (IBIT) remains in a long-term uptrend with a new high in mid August and price well above the rising 200-day SMA. Long-term support is based on the June lows and rising 200-day SMA in the 55-57 area.
IBIT formed a falling flag from mid July to mid August and broke out with a surge to 70. This breakout-surge did not last long as IBIT fell back to the flag lows. Even though I still see a support zone in the 62.50-64 area, the move below 65 negated the flag breakout.
Short-term, IBIT became moderately oversold with the dip below 65 and there is potential support here, but the pattern is too short-term for my style. As long as the long-term trend is up, I will continue to wait and watch for the next setup to emerge.
Send feedback to support(at)trendinvestorpro.com or use the contact form.