Concerns are brewing as the VIX compresses, seasonal patterns turn and a sentiment indicator gets close to triggering bearish. At the very least, these indicators argue for extra vigilance because conditions are ripe for a correction or pullback. First, the VIX compression shows excessively low volatility (complacency). Second, the Equity Put/Call Ratio turned up and is close to a breakout (similar to March). Third, the period from August to mid October is seasonally weak. We could also add overbought conditions to the mix. The odds are above average for a correction in the coming weeks or months. This report is an update to a similar report on Tuesday, July 22nd.
$VIX Signals and Trends
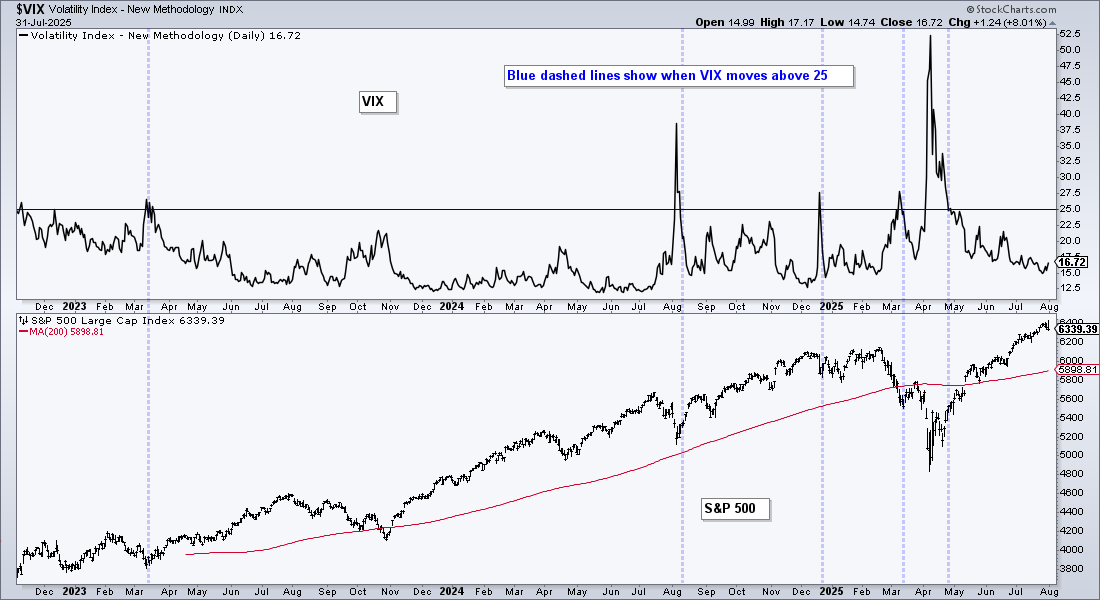
Personally, I have not had much success using the S&P 500 Volatility Index ($VIX) to predict market tops. It is usually better at identifying short-term bottoms when it surges above a specific level. Since 2023, that level was 25. A surge above 25 showed excessive fear and a subsequent move below 25 triggered a bullish signal. The blue dashed lines on the chart below show when $VIX crosses back below 25.
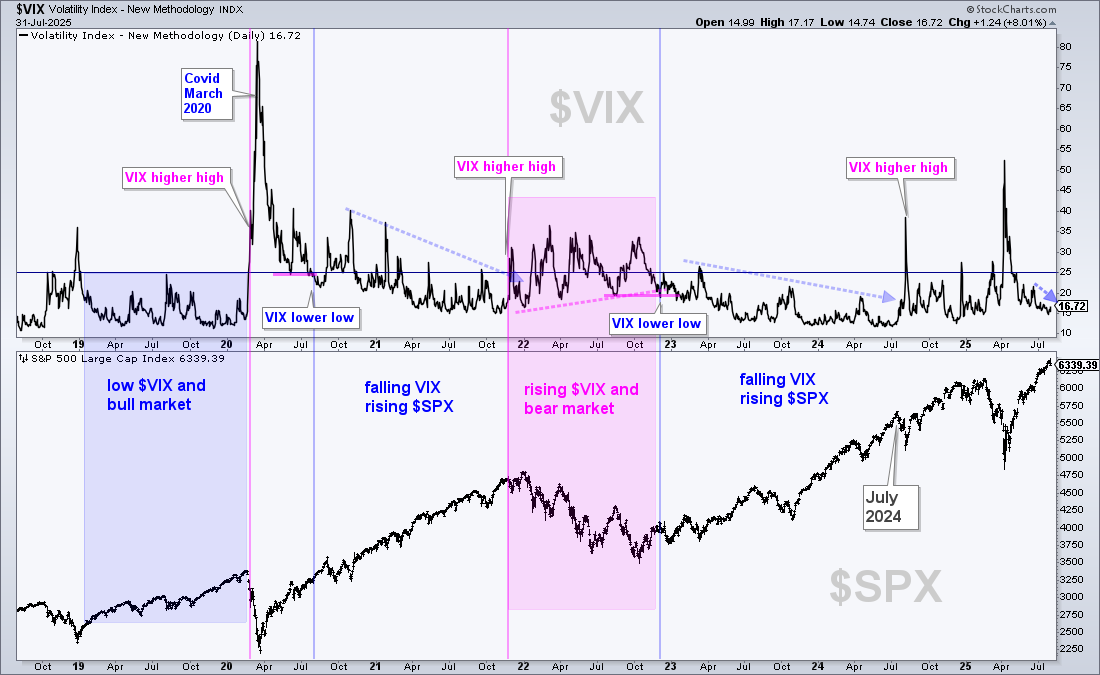
The next chart shows $VIX over the last six years. In general, low and/or falling VIX is positive for stocks (blue shading). High and/or rising VIX is negative (pink shading). $VIX remained low in 2019 and the S&P 500 advanced. $VIX broke out in early March 2020 and did not settle back down until August 2020. The VIX fell throughout the bull run in 2021 and then rose during the bear market of 2022. VIX then fell from late 2022 to July 2024 as a bull run took hold. $VIX is currently low and falling (since June), which is bullish.
$VIX Diverges from Underlying and Compresses
Rob Hanna of Quantifiable Edges (@QuantifiablEdgs) and Andrew Thrasher of Thrasher Analytics (@AndrewThrasher) recently noted two anomalies with $VIX. Hanna sees a discrepancy between $VIX and realized volatility, while Thrasher sees excessive compression that suggests complacency. They are not calling for a bear market, but they are hinting at a VIX expansion, which would be negative for stocks.
Rob Hanna of Quantifiable Edges (@QuantifiablEdgs) notes that realized volatility is at its lowest level since July 2024. Here is his tweet:
$SPX 21-day realized volatility closing at lowest level (6.24) since July 2024. $VIX may seem low at 15, but it is almost 9 points above realized. Opportunities for real volatility this week with earnings, $FED and jobs report. But if realized stays low through this, $VIX could be a good bit lower next week.
Andrew Thrasher, CMT (@AndrewThrasher) notes that $VIX is seriously compressed. Here is his tweet:
I wrote a paper in 2017 about volatility and compression (Forecasting a Volatility Tsunami). Currently, the $VIX hasn’t been as compressed in the last twelve months as it right now….Really wouldn’t be that surprised if we saw spot $VIX hit 22 before 15…I find it interesting to be happening as we move into a seasonal period that’s brought some twists and turns in the past.
Hanna says the volatility differential is the highest since July 2024, while Thrasher asserts that volatility compression is the lowest in 12 months. Note that the S&P 500 peaked in July 2024 and corrected into August.
Equity Put/Call Ratio Turns Up
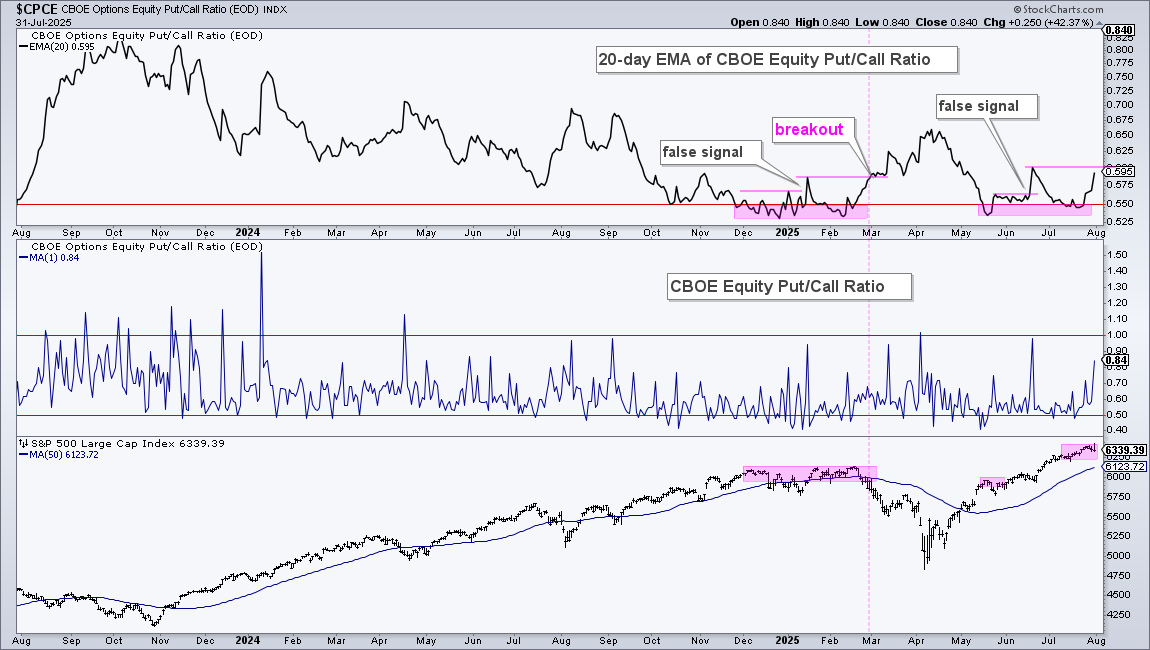
As noted last week the 21-day EMA of the CBOE Equity Put/Call Ratio ($CPCE) fell below .55 in July (top window/pink shading). This reflects excessive call volume. Traders expect prices to rise when they buy calls and this indicator shows excessive bullishness in the options market. As a sentiment indicator, it is contrarian and points to a possible peak.
Larry McMillan of the Options Strategist notes that a bearish signal triggers with an upturn and breakout. A breakout at .60 would turn this setup into a signal. With a move to .595 on Thursday, it is getting close. Notice how the indicator wallowed in the .525-.555 area from December to February and then broke out in late February. This breakout foreshadowed weakness into March-April.
Seasonal Patterns from August to Mid October
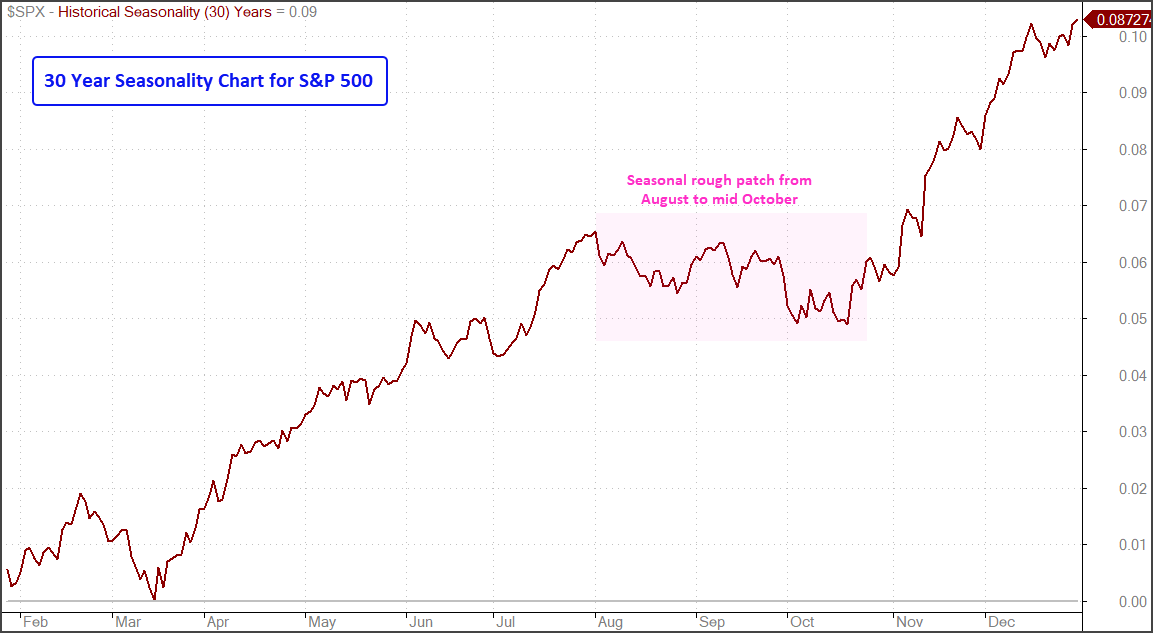
The next chart shows the 30 year seasonal pattern for the S&P 500. Seasonality is bullish from mid March to July, and from mid October to December. There is a relatively weak stretch from August to mid October. Seasonal patterns should not be used on their own. Instead, we should combine other indicators to confirm or refute, such as the VIX compression and Put/Call ratio.
SPY and QQQ Targets
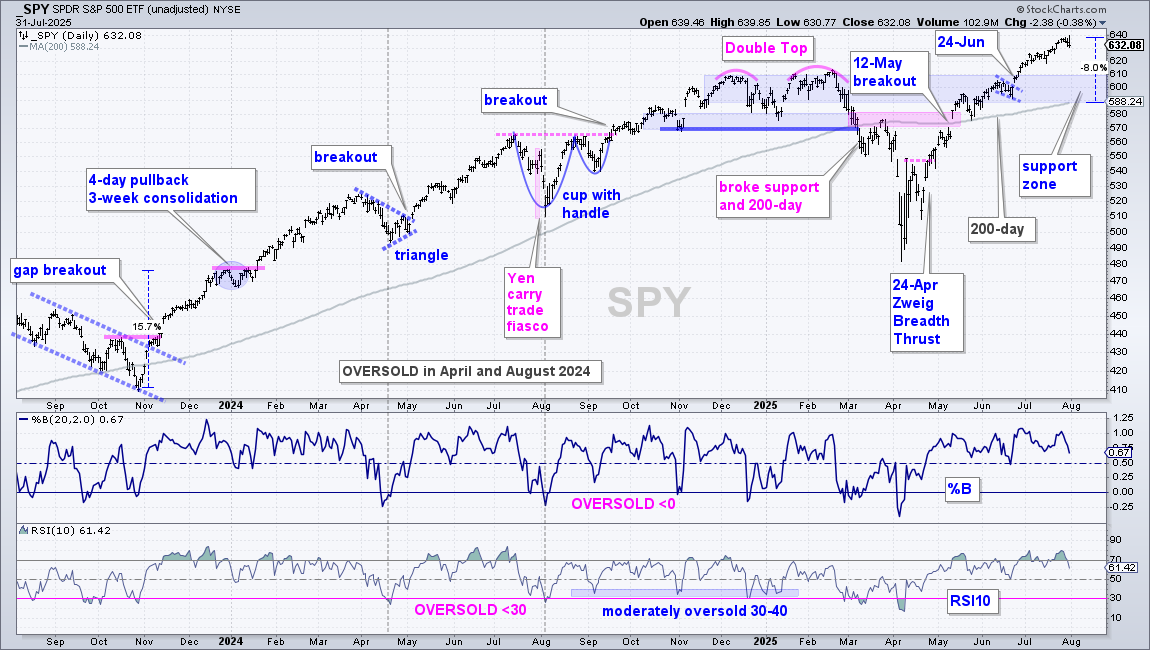
A correction would likely hit small-caps and mid-caps harder than large-caps because the former are underperforming already. Also note that a correction would likely affect most sectors and industry groups. A normal 5-8 percent pullback in SPY would extend to the 590-610 area. Support stems from broken resistance and the rising 200-day SMA.
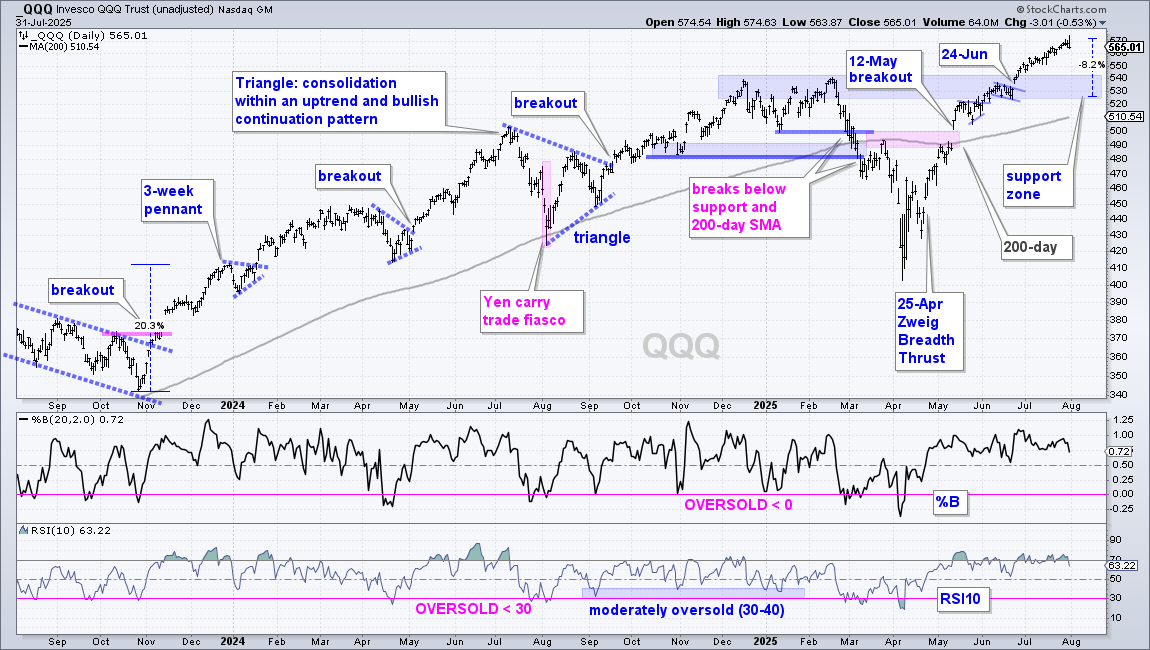
A 5-8 percent correction in QQQ would extend to the 525-540 area. A 10 percent correction would extend to the rising 200-day SMA.
Corrections are like a box of chocolates: you never know what you are going to get. We could see a choppy trading range to digest the big gains since April. Stocks could move sharply lower or we could see a zigzag lower (falling wedge). It is difficult to predict the path, the pattern and the key level. The odds of a correction are above average now. We do not know the path, the pattern and the key level. We can guestimate, but it is best to let it unfold and wait for an opportunity to present itself. In other words, wait for signs of support or a tradable pattern to emerge. Patience, young grasshopper.
Send feedback to support(at)trendinvestorpro.com or use the contact form.