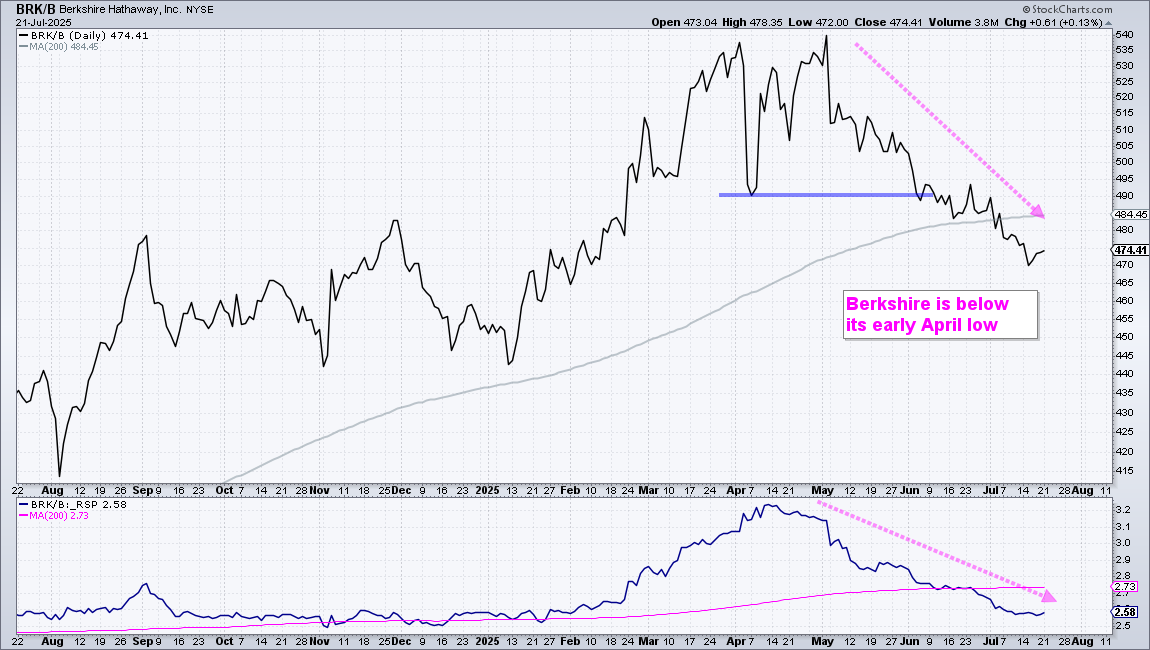
Large-cap and large-cap techs continue to lead the market with small-caps and mid-caps lagging. SPY and QQQ hit new highs on Monday, but 279 stocks within the S&P 500 are more than 10% below their 52-week highs. 137 stocks are more than 20% below their 52-week highs. SPY and QQQ are not lifting all boats. 64 stocks are even below their April lows (closing lows), including Berkshire Hathaway (BRK/B). Perhaps Berkshire is a defensive play because they hold $315 billion in short-term US Treasury Bills.
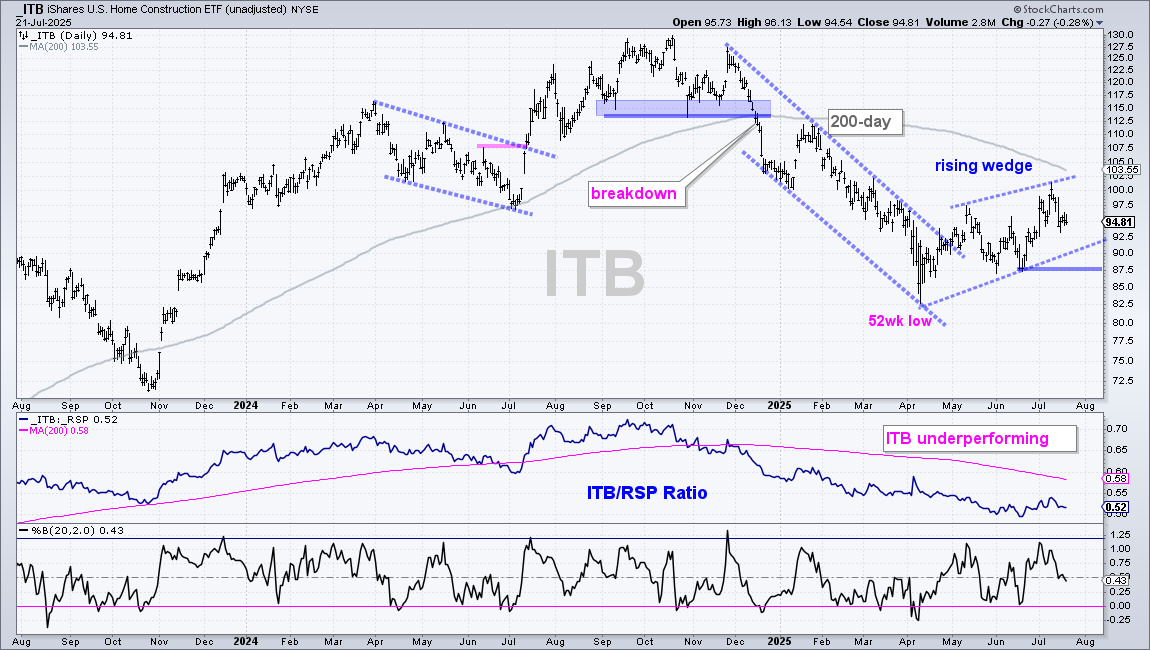
These groups are doing the heaving lifting: Technology, Industrials, Utilities, Communication Services, AI, Semis, Software, Cybersecurity, Aerospace & Defense, Metals & Mining and Telecom. The Home Construction ETF (ITB) bounced, but this bounce is already looking shaky. The Insurance ETF (KIE), Medical Devices ETF (IHI) and MLP ETF (AMLP) did not hold their pennant breakouts.
Note that I will issue a special report on the state of the broader market later today. In short, the odds favor a correction between now and October. Many groups are overextended after massive moves, breadth remains a concern, seasonal patterns are weak and sentiment is getting stretched.
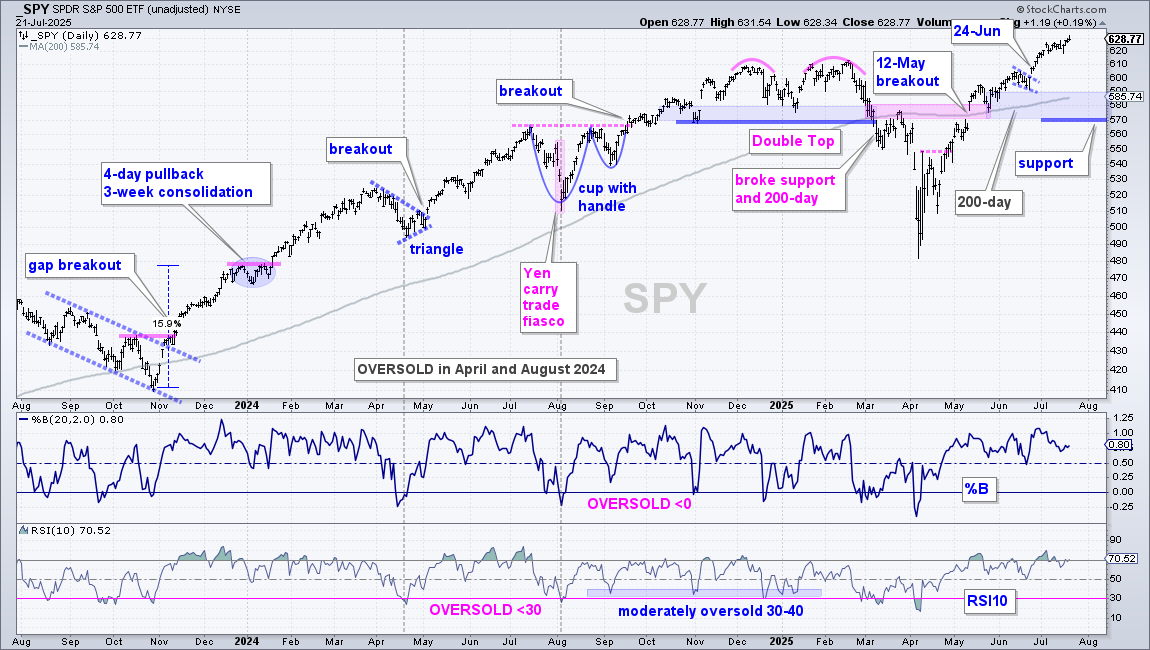
The S&P 500 SPDR (SPY) remains in an uptrend and recorded a new high on Monday. This uptrend started with the gap-breakout on May 12th. SPY then negated the Double Top support break (pink shading), exceeded the late March high and broke the 200-day SMA. Since this breakout, the ETF worked its way higher with a move from 580 to 630 (+8.6%). The most recent short-term setup was the small pennant in June and the subsequent breakout on June 24th. There is no setup and SPY is in the trend-monitoring phase. The breakout zone and rising 200-day mark support in the 570-590 area.
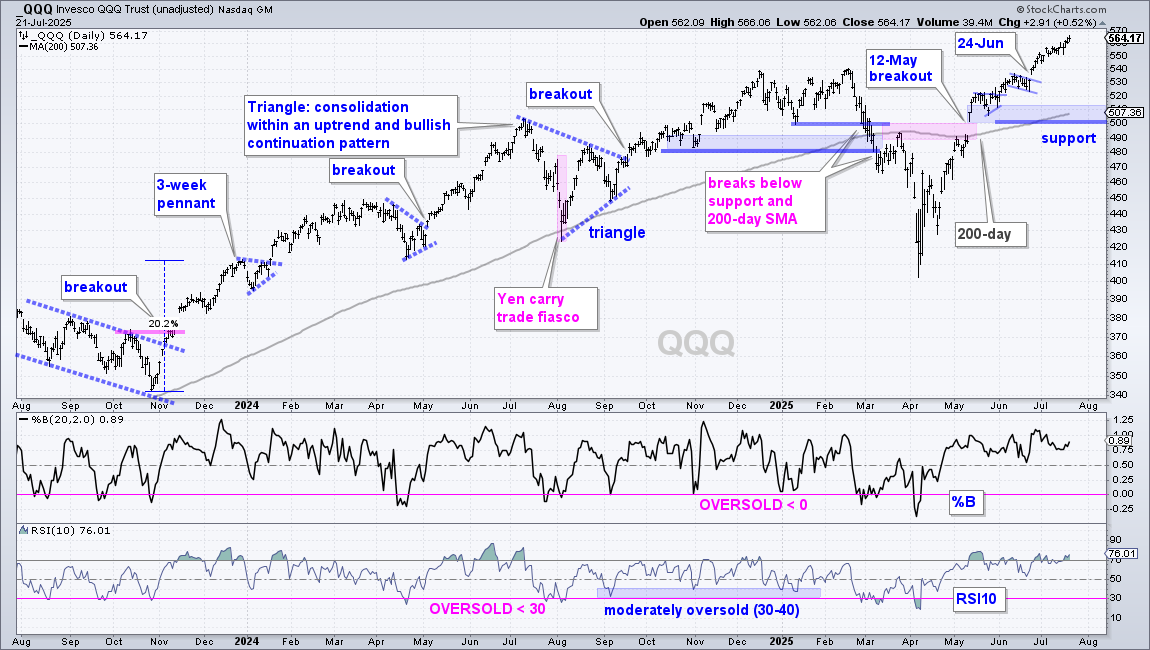
QQQ is also in a leading uptrend since the breakout on May 12th. This is when the ETF broke the pink resistance zone and exceeded the 200-day SMA. QQQ formed a pennant in late May and a small falling flag in June. The breakout on June 24th is the most recent short-term signal. QQQ extended on this breakout and hit new highs the last few weeks. There is no setup on this chart. The late May lows and rising 200-day SMA mark support in the 500-510 area (blue shading).
Mid and Small Cap ETFs in Uptrends, but Lagging
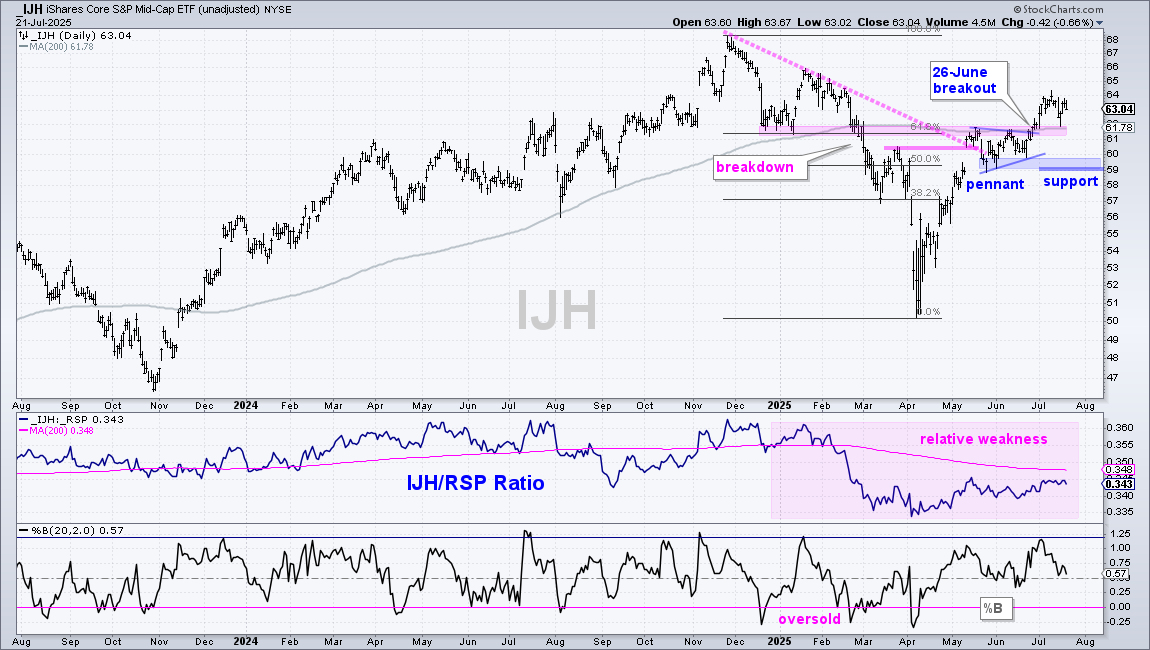
The S&P MidCap 400 ETF (IJH) surged with the broader market in April, hit a resistance zone in May and broke resistance in late June. Resistance stemmed from broken support (pink shading), the May high and the 200-day SMA. IJH also formed a pennant into June and broke the pennant line. This breakout is holding, but IJH is severely lagging. It is 7% below its 52-week high and the price-relative (IJH/SPY ratio) remains below its 200-day SMA. Support is marked at 59 and a break here would reverse the uptrend.
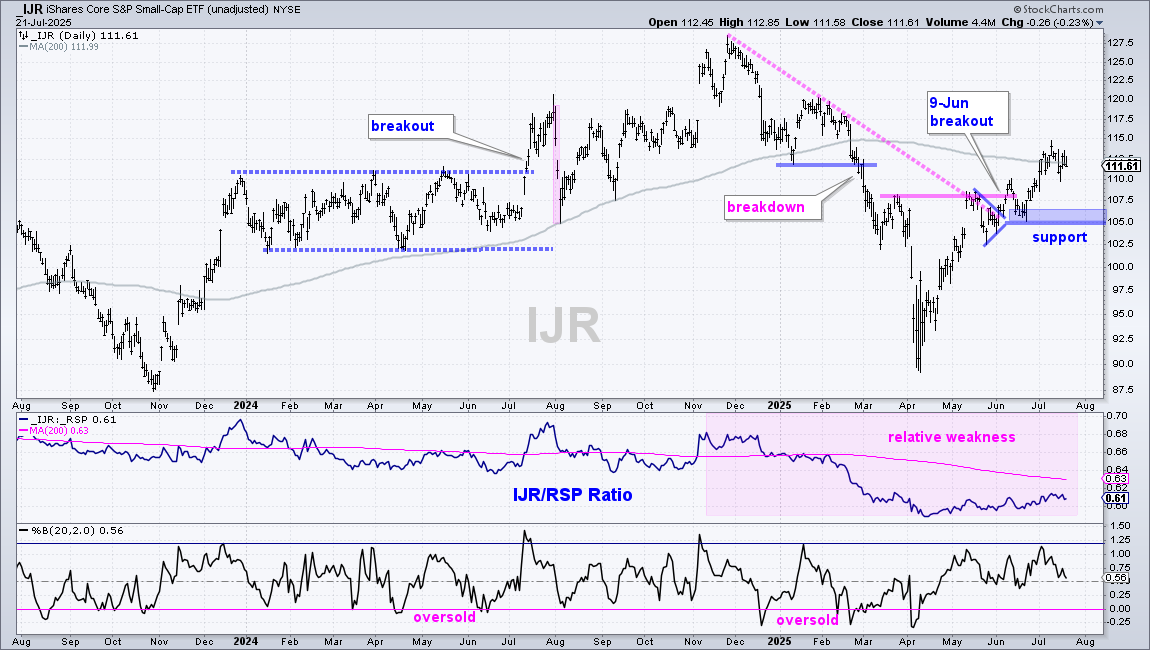
The S&P SmallCap 600 SPDR (IJR) is the biggest laggard because it is still battling its falling 200-day SMA. Note that IJR crossed the 200-day several times this month and most recently closed below it on Monday. IJR remains with a short-term breakout in early June and upswing since April. I am marking support at 105. A break here would reverse the immediate uptrend. The middle window shows the price-relative (IJR/RSP ratio) wallowing below its 200-day SMA.
Tech Related Leaders become Seriously Extended
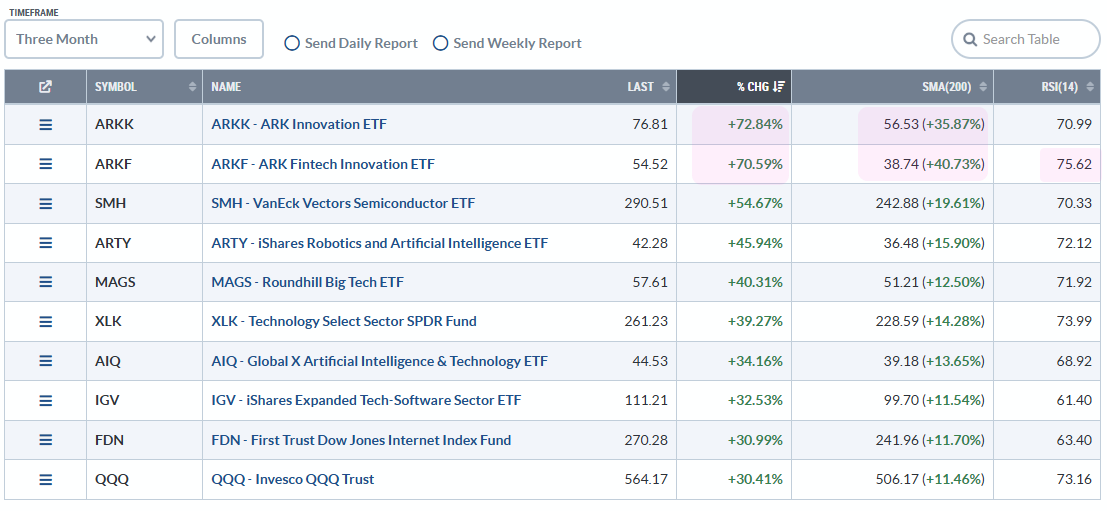
Tech-related ETFs led the charge off the April lows and these ETFs are leading the market. They are in strong uptrends, but seriously extended right now, which makes them vulnerable to a corrective period. Corrections can evolve as pullbacks or consolidations. The table below shows the leading tech related ETFs along with QQQ. This table is sorted by the 3-month percentage change (%CHG). I also added columns for percent above 200-day SMA (SMA200) and RSI14 to quantify overbought conditions. First, all ten are up 30% or more the last three months. The ARK Innovation ETF (ARKK) and ARK Fintech Innovation ETF (ARKF) are up over 70%. All ETFs are more than 10% above their 200-day SMAs. 14-day RSI is above 70 for seven of the ten, and above 75 for ARKF.
XLK Extends on Breakout and Chandelier Follows
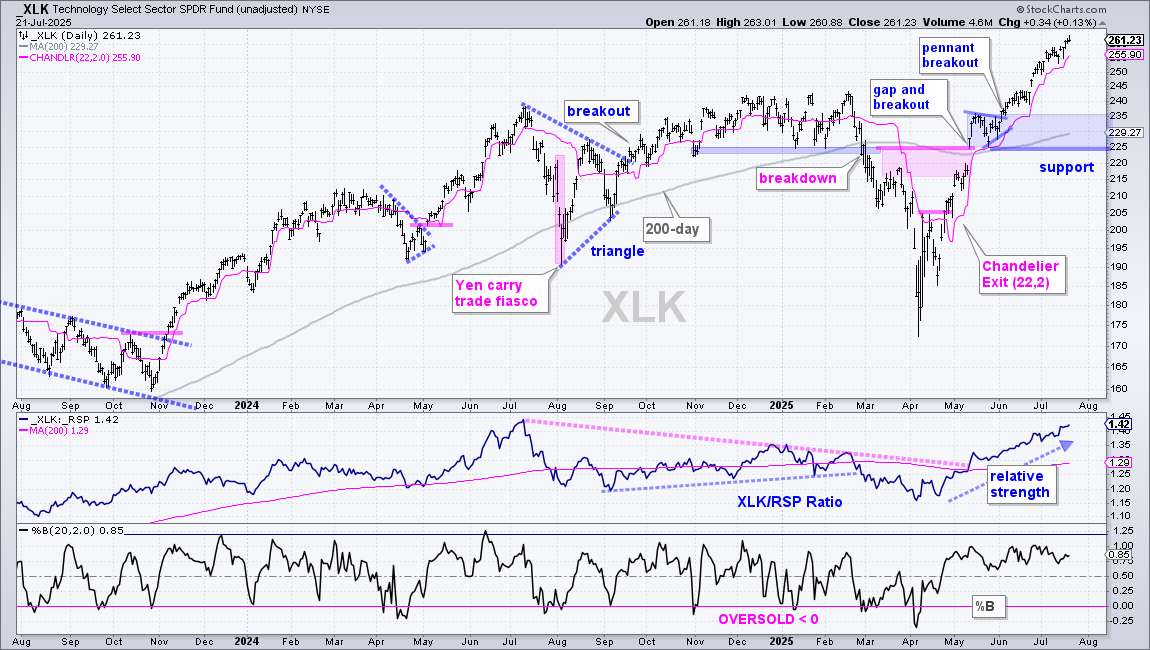
Tech-related ETFs lead the surge off the April low. After big moves into mid May, many consolidated and then broke out in early June. We identified these flag/pennant patterns and the breakouts at the time, and then applied the Chandelier Exits. A Chandelier Exit (22,2) is 2 ATR(22) values below the 22-day high. This exit rises and trails price as long as prices rise.
The example below shows the Technology SPDR (XLK) with a gap-breakout on May 12th, a pennant into late May and a pennant breakout in early June. This breakout occurred around 235 and XLK extended to 261. The Chandelier Exit (pink line) is currently at 255.90. Keep in mind that this is a short-term exit based on a short-term pattern breakout. A close below the exit level would not be bearish per se.
Long-term, XLK is in a leading uptrend, but getting short-term extended after a steep advance off the April low. The ETF is up 45% since early April and around 14% above its rising 200-day SMA. XLK is also leading the market as the price-relative (XLK/RSP ratio) broke its 200-day SMA in mid May and rose into July. Short-term, XLK is overextended and ripe for a corrective period. A correction would be welcome because it would provide the pause that refreshes, and another opportunity to trade within the leading uptrend. I am marking support in the 225-235 area.
Leading Tech ETFs with Chandelier Exits
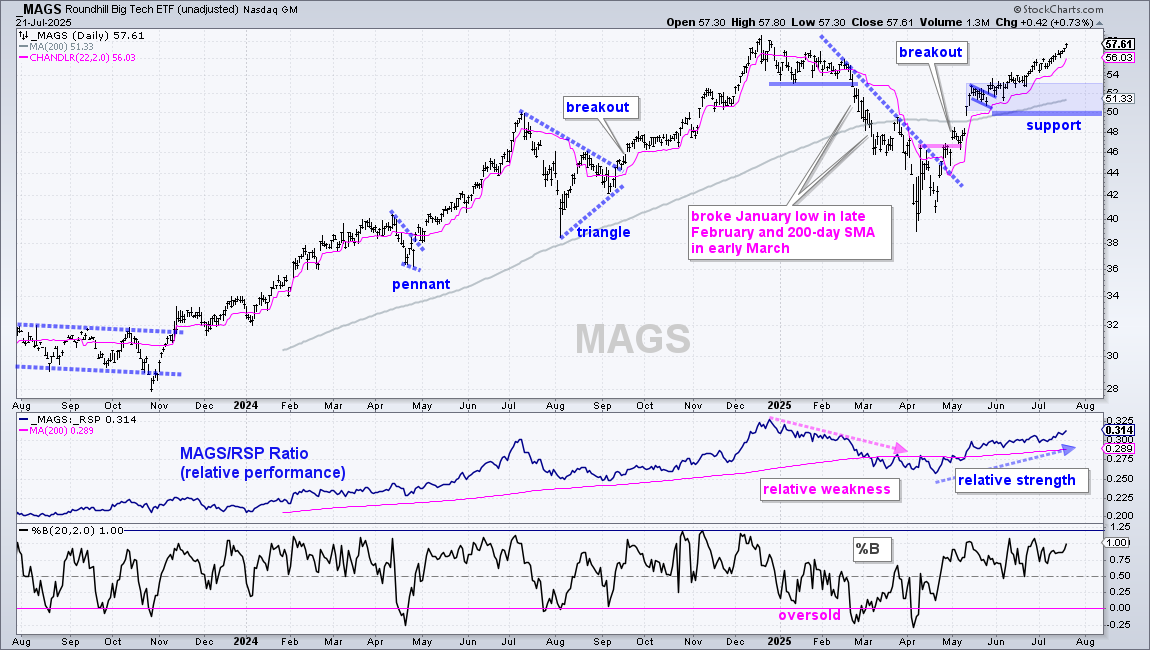
The next charts show the leading tech ETFs with their Chandelier Exits for reference. All are in leading uptrends, but looking extended and ripe for a corrected period. This is not the time to chase. Instead, exercise some patience and let the market come to you with a bullish setup. The chart below shows the Mag7 ETF (MAGS) extending on its late May breakout and nearing its December high.
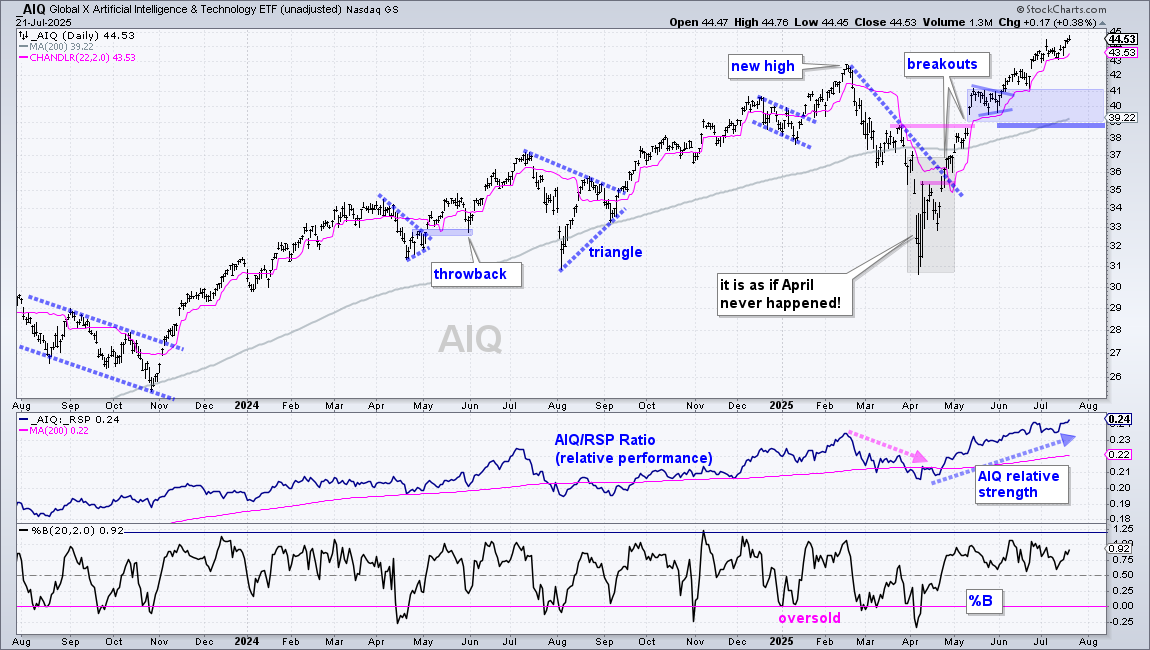
The next chart shows the Global AI & Tech ETF (AIQ) extending to new highs after its breakout. The blue shading marks the support zone to watch should we get a pullback.
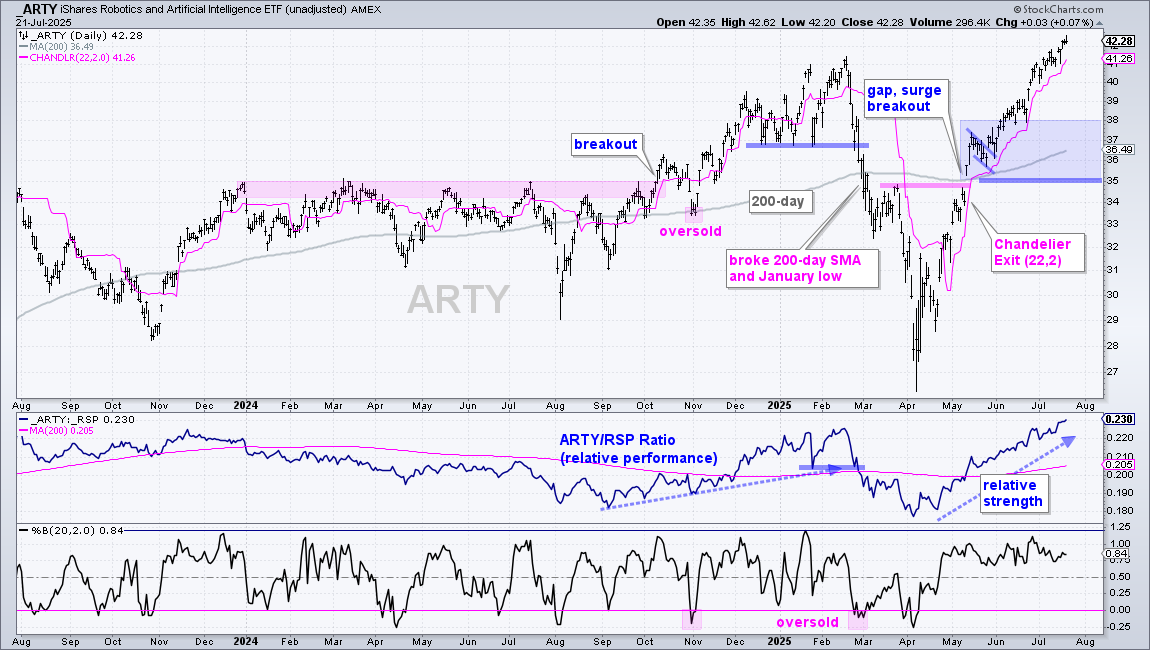
The next chart shows the Robotics AI ETF (ARTY).
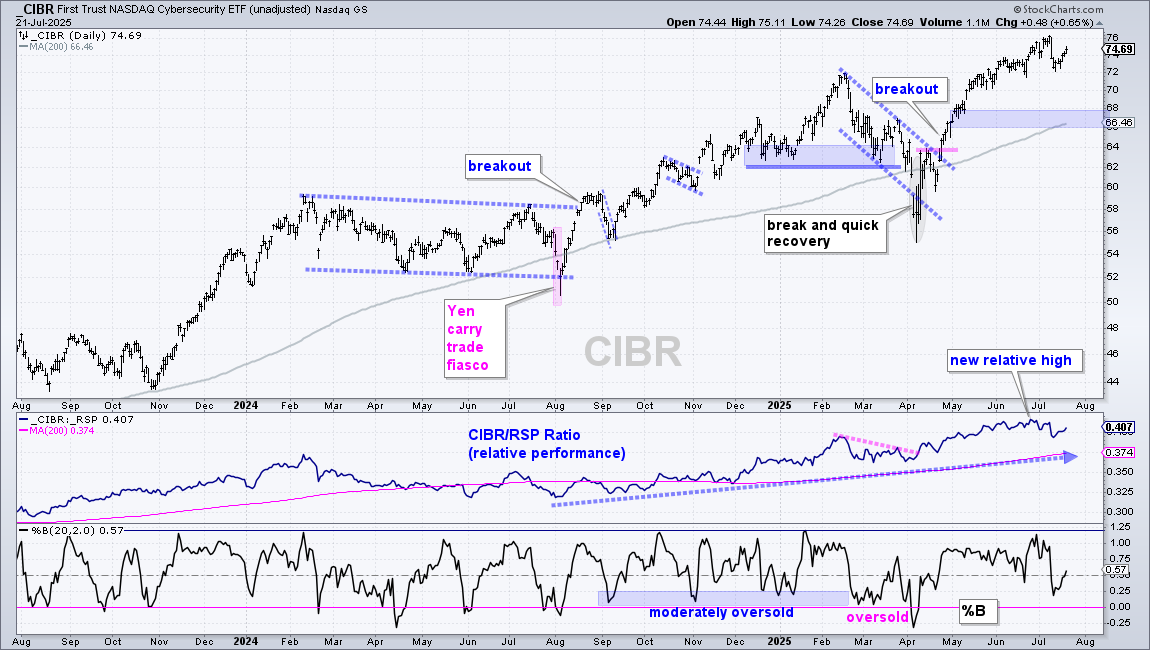
The next chart shows the Cybersecurity ETF (CIBR).
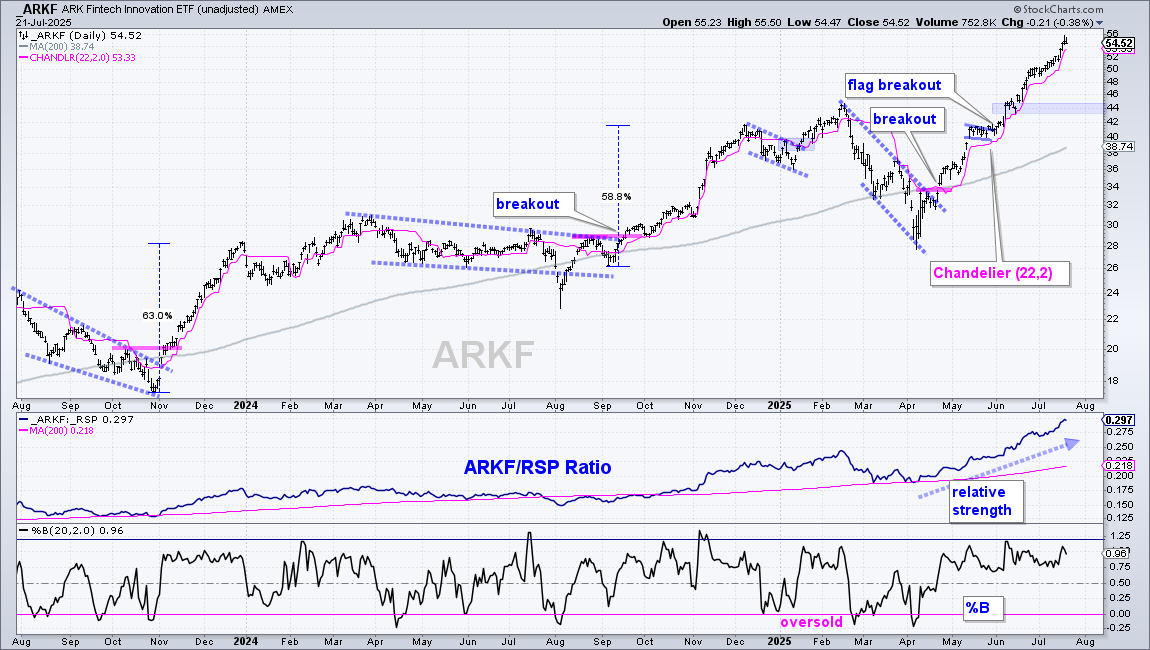
The next chart shows the ARK Fintech Innovation ETF (ARKF) with one of the biggest moon shots – up 87% since early April. Notice how the Chandelier Exit trailed price and held since the flag breakout.
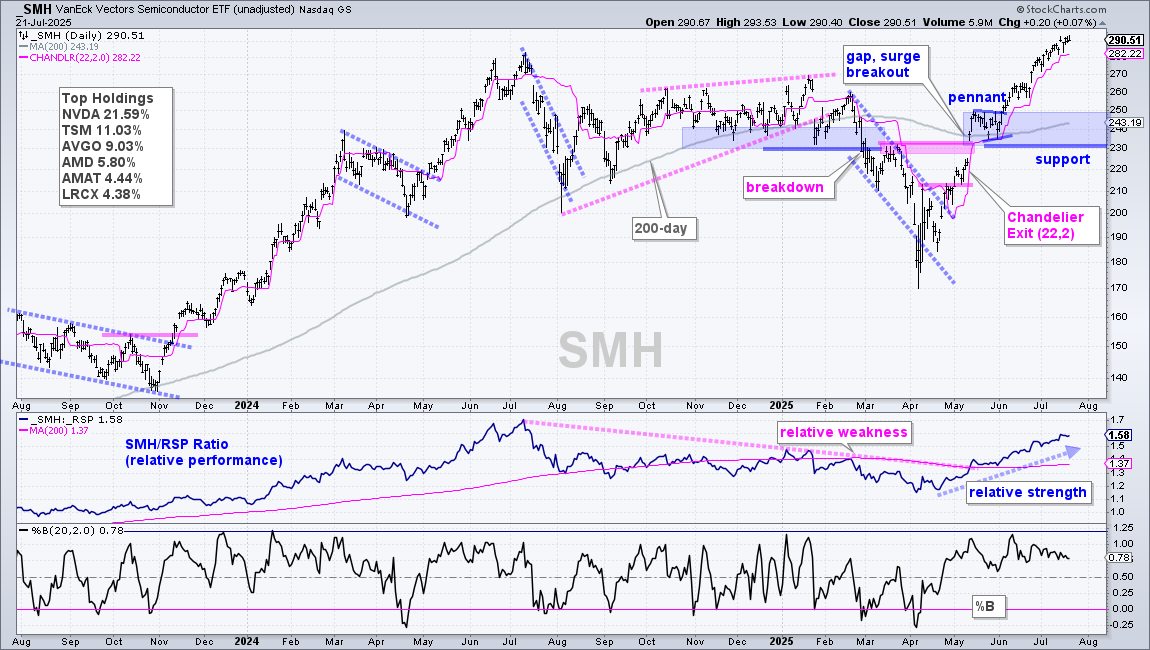
The next chart shows the Semiconductor ETF (SMH) with a pennant breakout in early June and a surge to new highs in July.
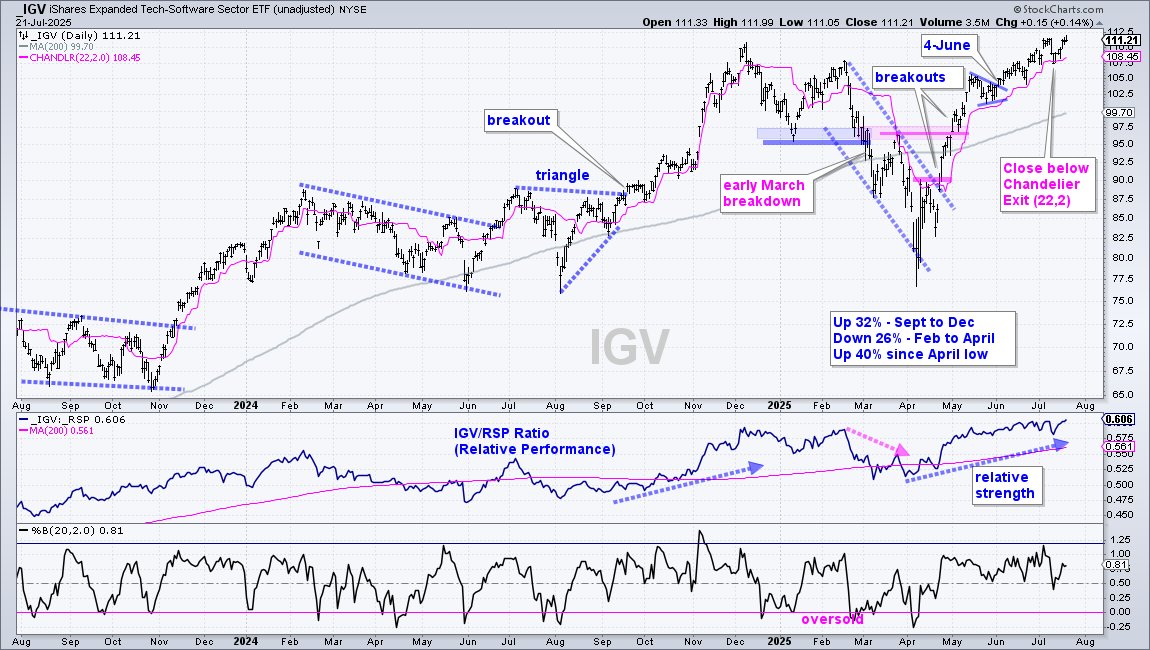
The next chart shows the Software ETF (IGV) with a pennant breakout on June 4th and an extension to new highs. Note, however, that IGV closed below the Chandelier Exit on July 11th, which would have triggered the short-term stop.
BLOK and IYZ with Cup-with-handle Breakouts
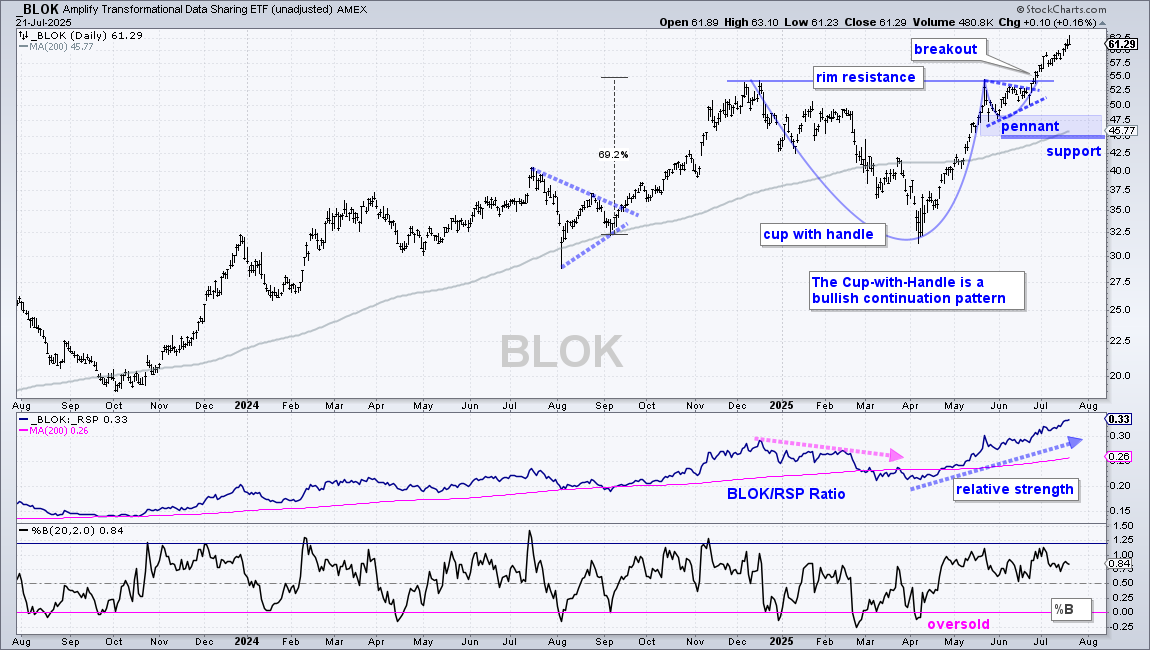
Transformational Data Sharing ETF (BLOK) is moving higher with help from the new highs in Bitcoin. As noted in late June, BLOK formed a bullish cup-with-handle pattern with rim resistance at 54. A pennant also formed within the handle. BLOK broke out with a surge in early July and extended to new highs. This breakout is bullish with long-term support marked at 45 (late May lows and rising 200-day SMA). The middle window shows the price-relative (BLOK/RSP ratio) turning up in April with a move above the 200-day SMA and extending to new highs. BLOK is in a leading uptrend.
The pennant and cup-with-handle patterns provided the last setups and the breakouts triggered. Now is the time to manage the trade. I am a fan of booking partial profits after a move and then setting a stop to ensure that the entire trade does not devolve into a loser. For example, close half of the position now (~61) to book a ~10% profit. If the entry is at 56, the stop-loss for the remainder would be at 51.
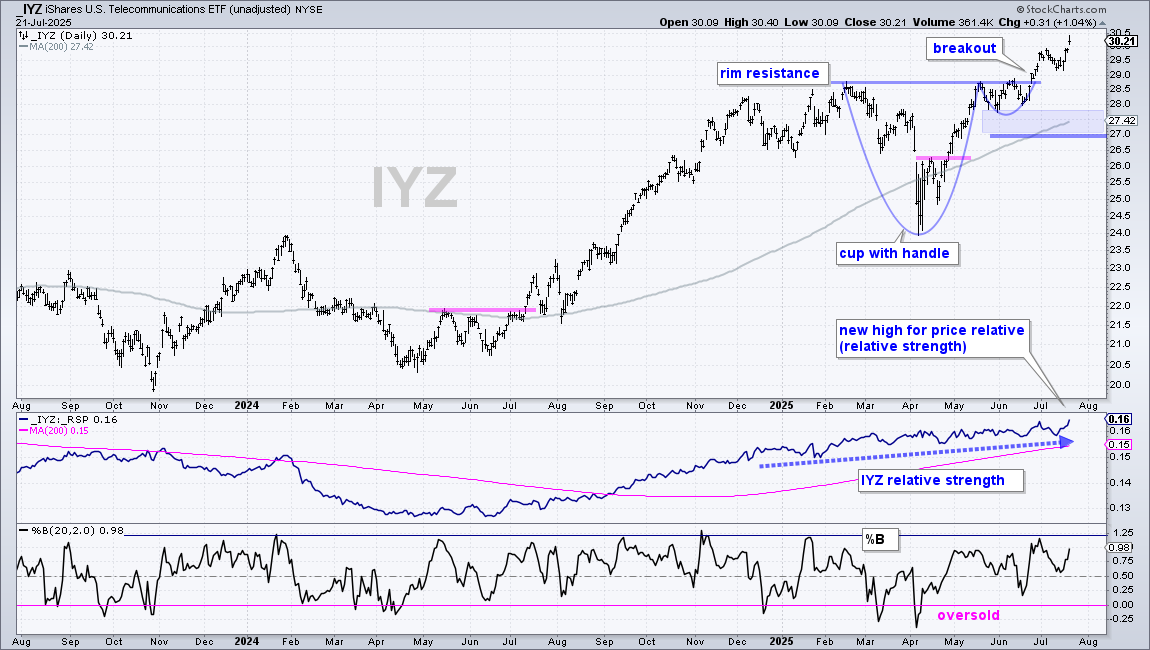
The next chart shows the Telecom ETF (IYZ) with a cup-with-handle forming from February to June and a breakout in late June. I am marking long-term support at 27. The middle window shows the price-relative (IYZ/RSP ratio) working its way higher throughout 2025 and tagging a new high on Monday. IYZ shows relative strength.
ITA is a Runaway Leader (powering XLI)
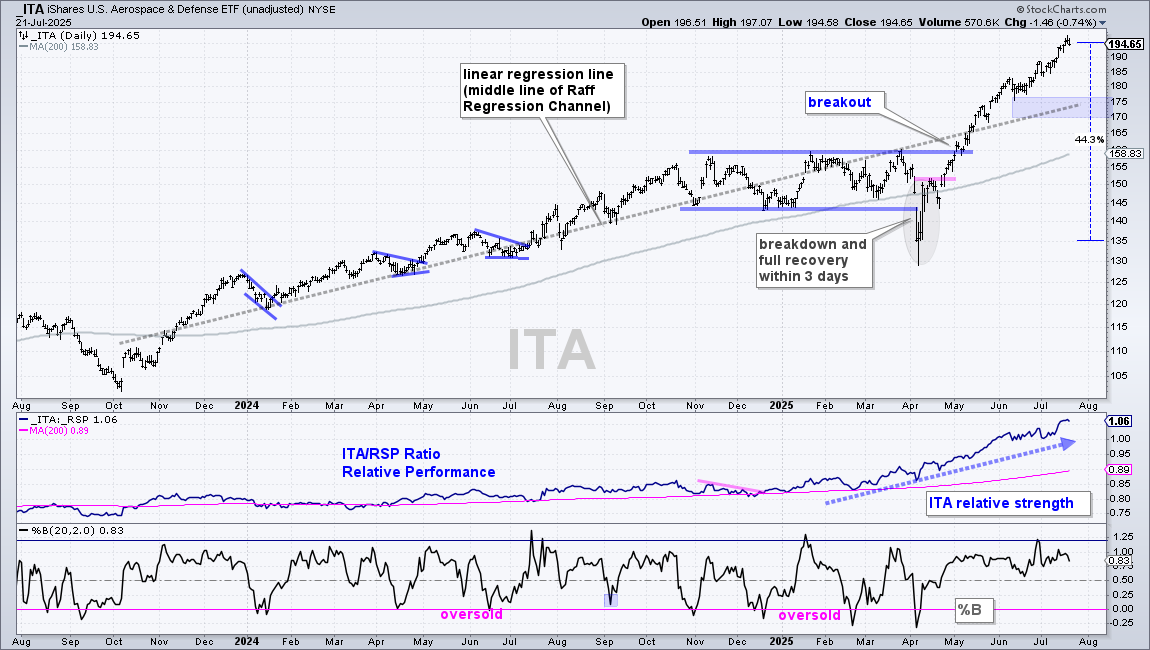
Outside of tech related ETFs, the Aerospace & Defense ETF (ITA) is the runaway leader with a 40+ percent gain since early April. ITA was one of the quickest to recover in early April with a surge back above the 200-day SMA in just three days. The ETF broke resistance and extended to new highs with a steep advance. ITA is also overextended and I do not see a setup on this chart. It is time to wait for a reversion to the mean. The dotted gray line shows a Linear Regression from October to July. A pullback to the 175 area would show a reversion to the mean and provide the next setup.
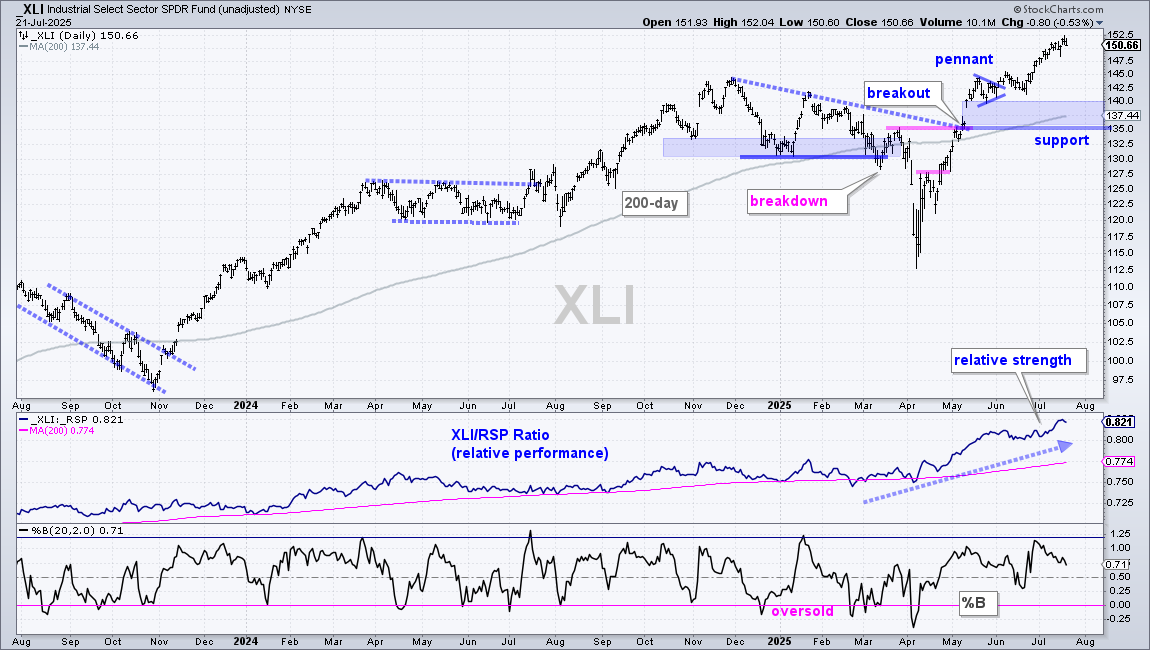
The Industrials SPDR (XLI) is the main beneficiary because Aerospace & Defense accounts for 25.85% of the sector. XLI is also in a leading uptrend with a new high in price and a new high in the price-relative (XLI/RSP ratio). Short-term, however, XLI is quite extended after a big move off the April low. I am marking a support zone in the 135-140 area. A pullback to the low 140s could offer an opportunity.
Communication Services SPDR Breaks Pennant Line
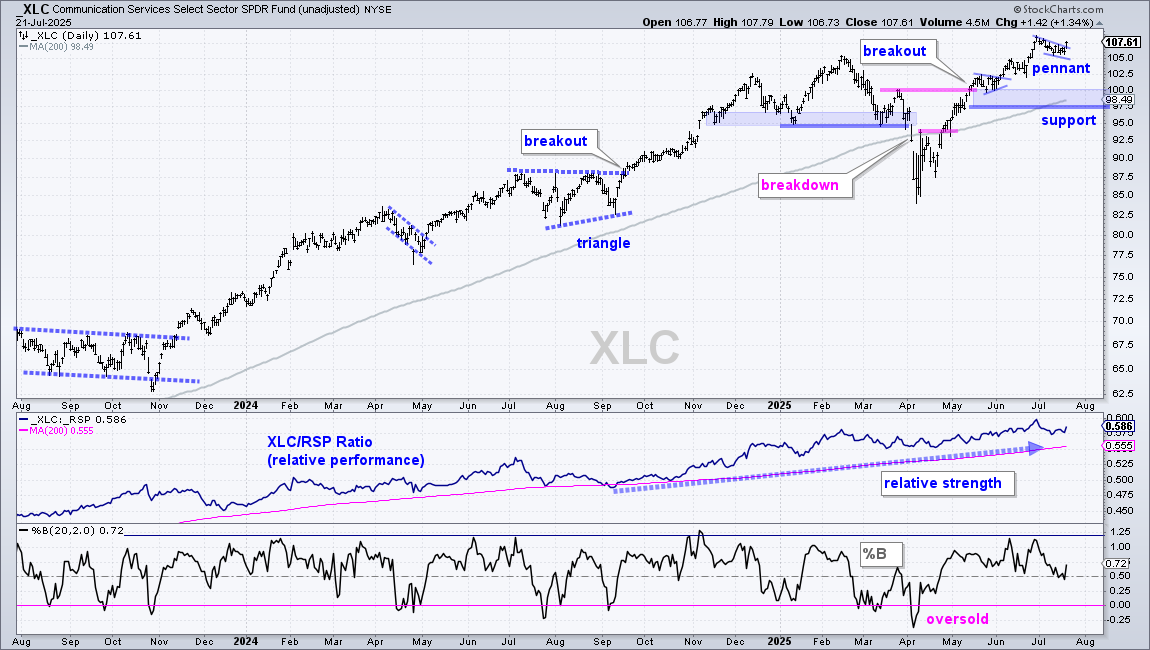
The next chart shows the Communication Services SPDR (XLC) in a leading uptrend with a new high in June and a rising price-relative (XLC/RSP ratio). A small pennant formed in July and XLC broke out with a pop on Monday. I am marking long-term support in the 97-100 area.
Utilities SPDR Gets Pennant Breakout
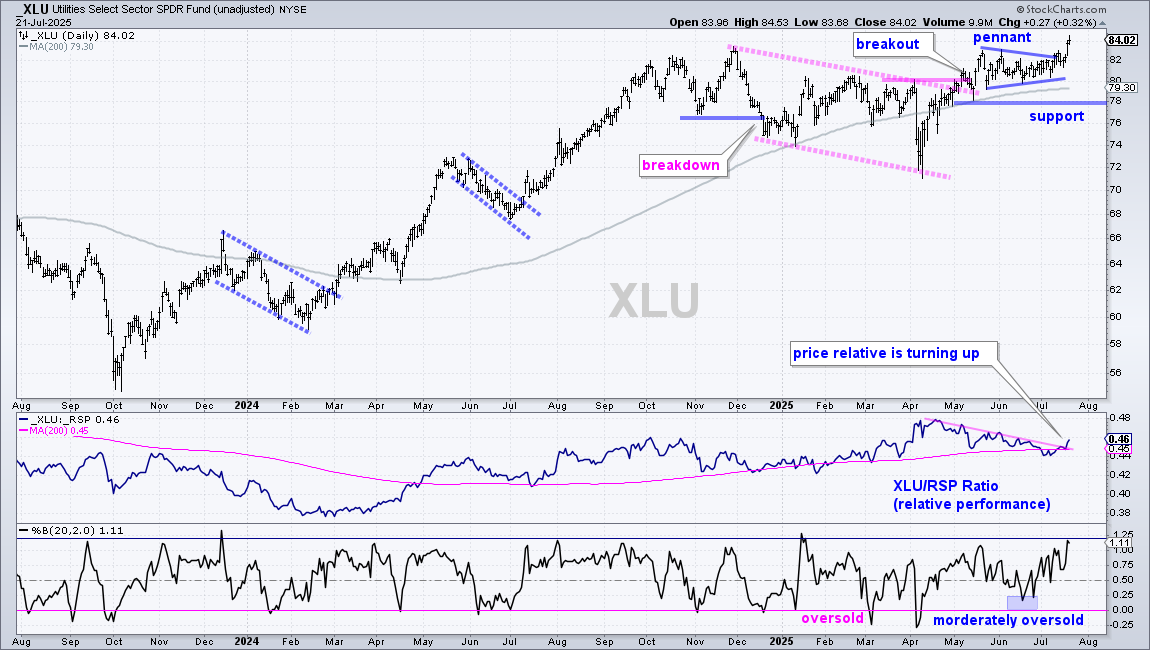
The next chart shows the Utilities SPDR (XLU) forming a falling channel from December to April and breaking out in May. After a surge off the April low, XLU formed a pennant and broke the pennant line last week. I am marking long-term support at 78-80 using the rising 200-day SMA and mid May low and pennant lows. The middle window shows the price-relative turning up in July as XLU starts to outperform again.
Infrastructure ETF Extends on Breakout
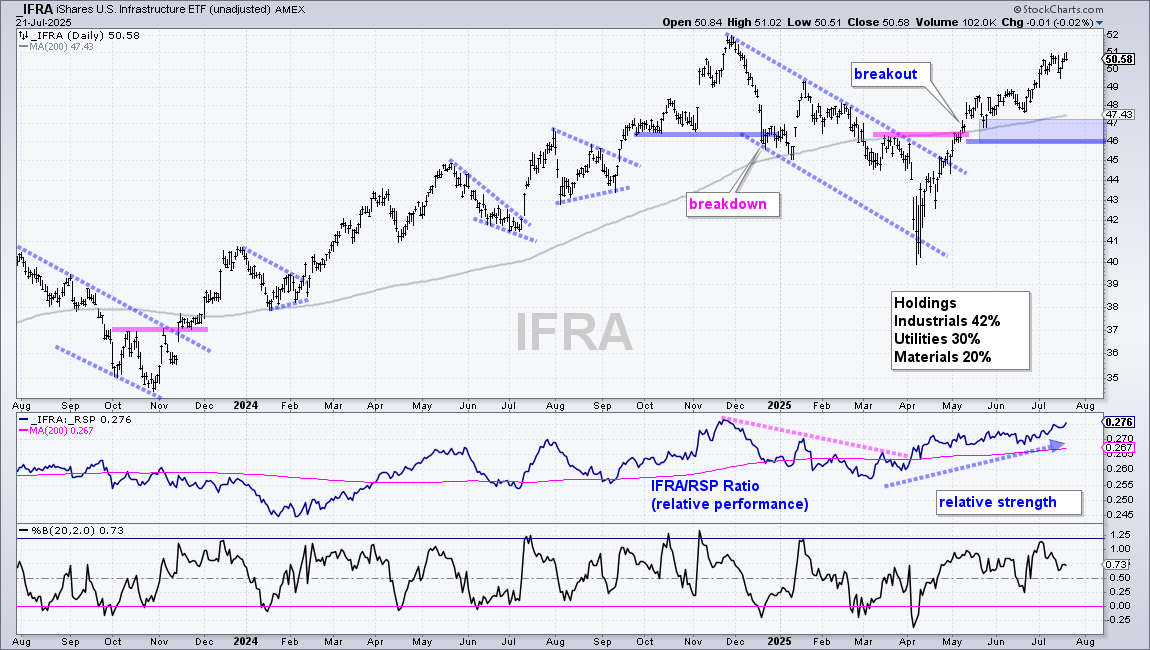
The Infrastructure ETF (IFRA) is dominated by three sectors: Industrials (42%), Utilities (30%) and Materials (20%). The chart shows IFRA with a breakout in mid May and follow through on this breakout. IFRA has yet to hit a new high, but the breakout is bullish with support marked in the 46-47 area. The middle window shows the price-relative (IFRA/RSP ratio) turning up in April and rising the last three months as IFRA outperforms the broader market.
Send feedback to support(at)trendinvestorpro.com or use the contact form.