Note that I will be taking some time off in July for a family vacation (July 7th to 18th). There will be no written reports or videos during this period. I will, however, update the Broad Breadth Model, Signal Pages and Ranking tables (Saturdays). I will also issue an alert if there is a major change between updates.
The next report will be on Tuesday, July 22nd.
Report Headlines
IEF Falls Back to Breakout Zone
GLD Consolidates within Uptrend and Becomes Oversold
SLV Holds above Breakout Zone
GDX and SIL Consolidate after New Highs
Palladium Extends on Breakout
Platinum ETF Extends Even Further
CPER Extends on Upswing
DB Base Metals ETF Extends on Pennant Breakout
LIT Surges, Consolidates and Breaks Out
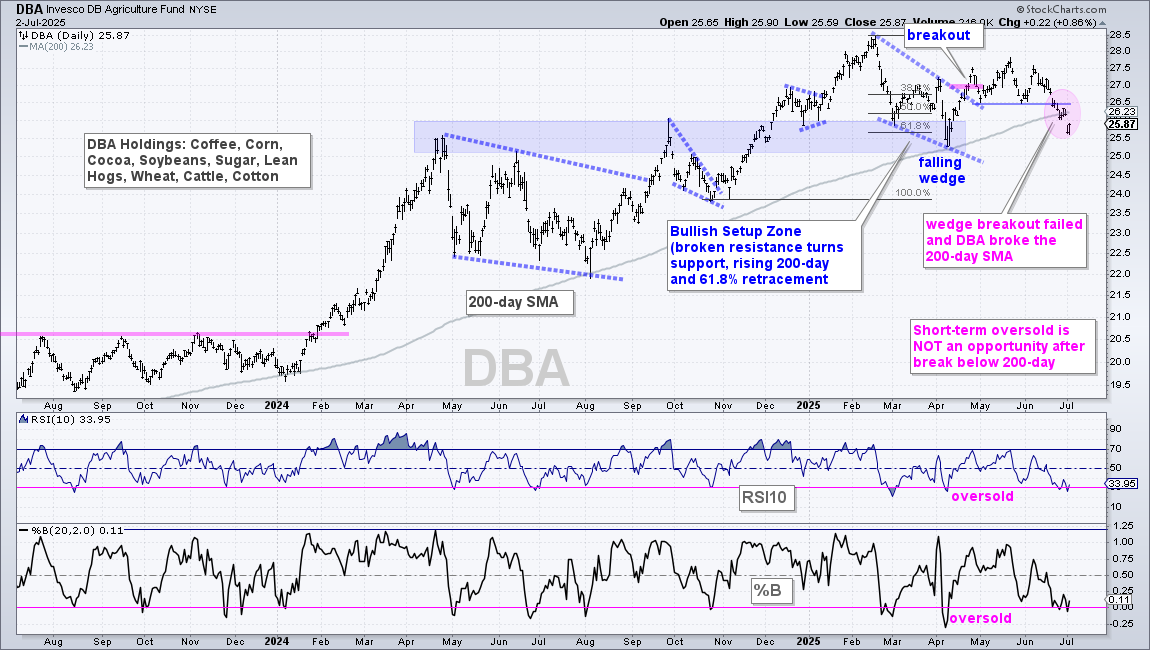
DB Agriculture ETF Breaks Down
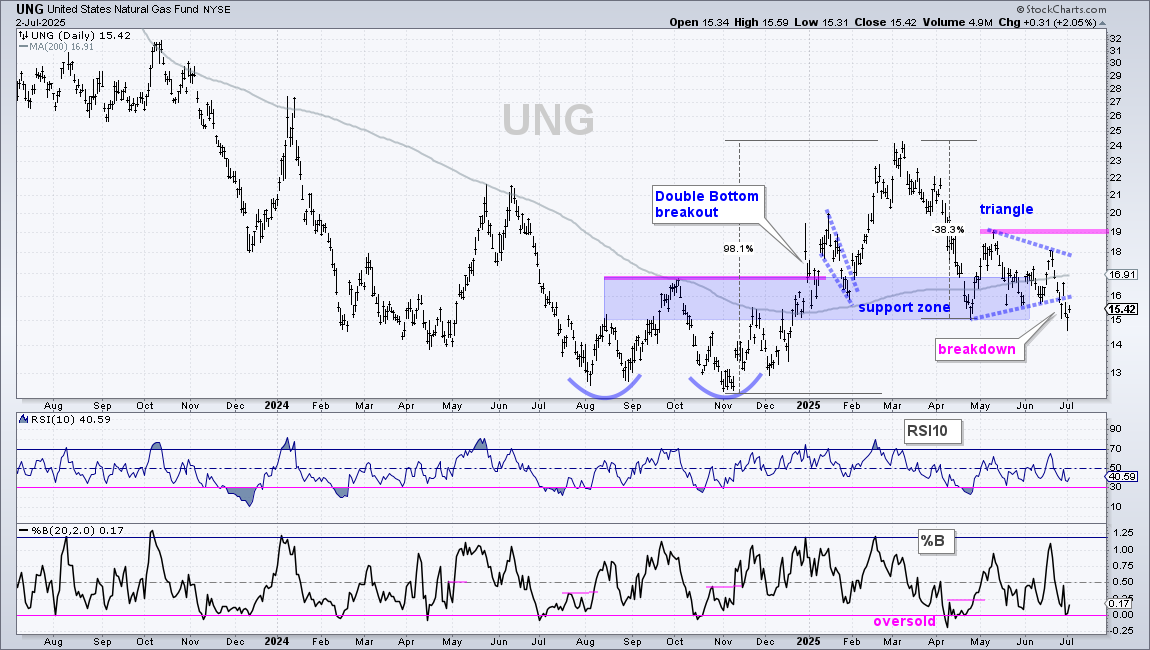
Natural Gas ETF Breaks Triangle Support
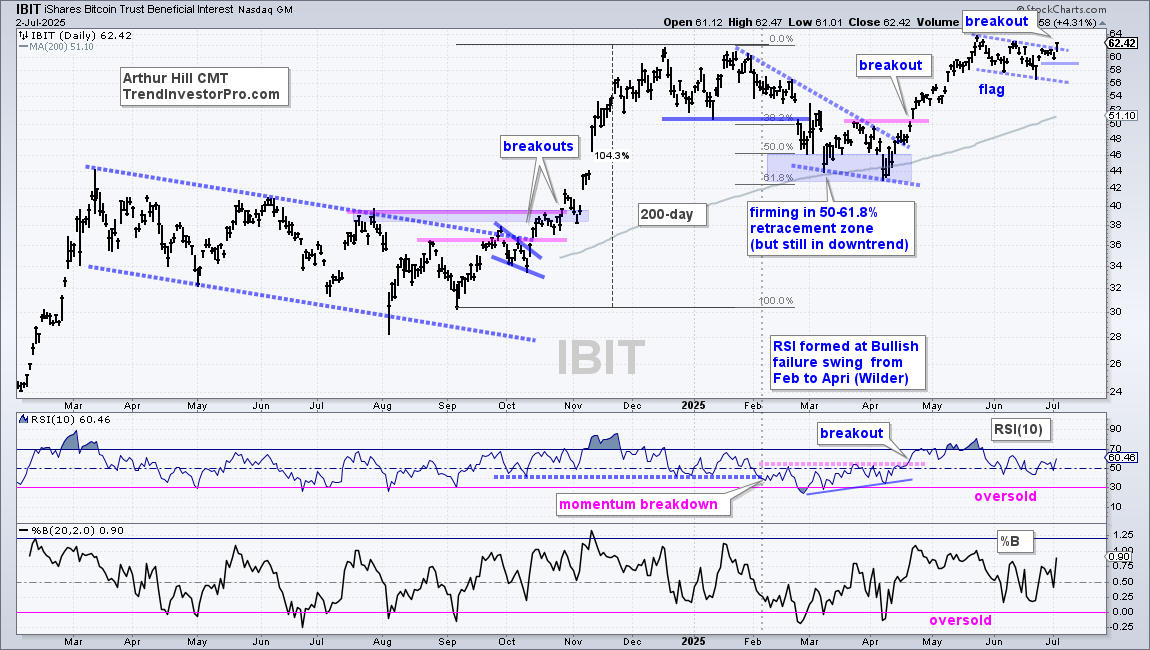
Bitcoin Breaks Out of Bull Flag
Commodity and Crypto Related ETFs Leading
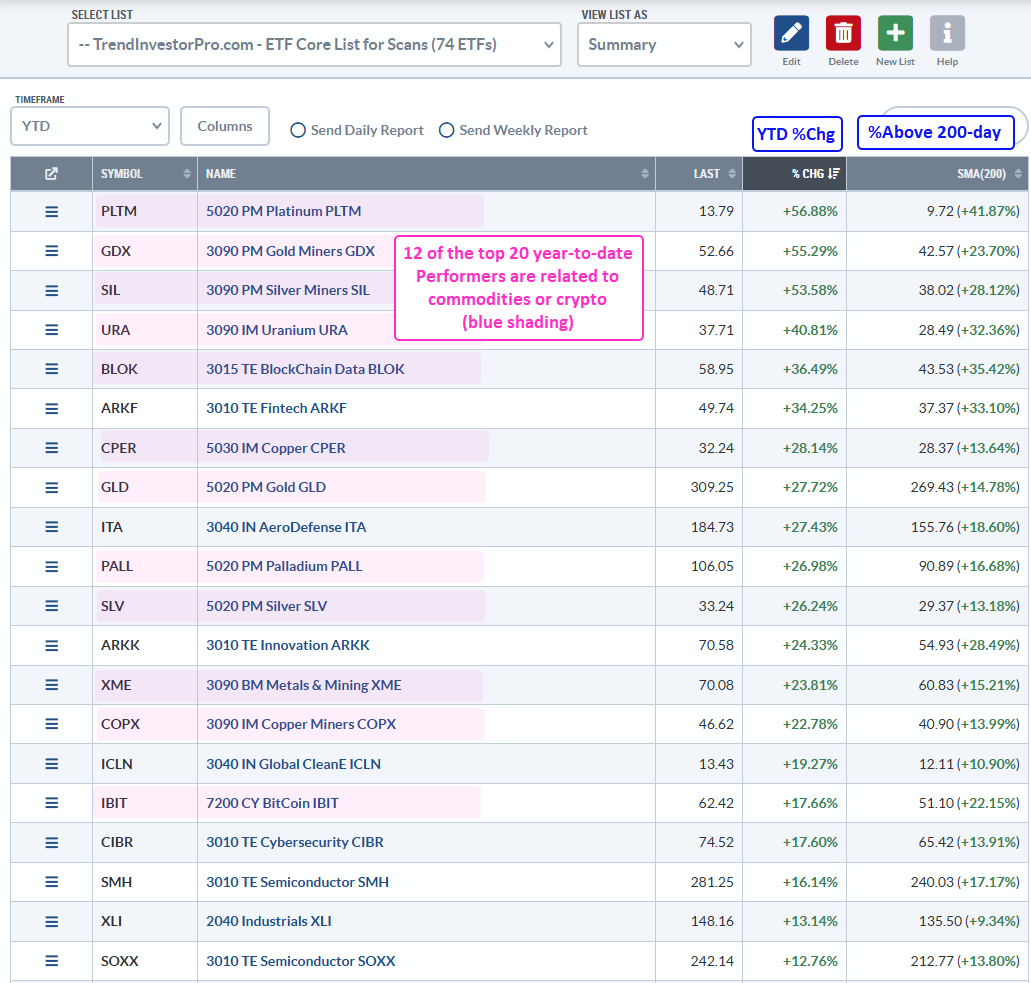
Even though some equity groups are performing well year-to-date, commodity and crypto related ETFs feature prominently on the leaderboard. The pink shading on the image below highlights these leaders. The top five ETFs are related to platinum, gold, silver, uranium and blockchain. Further down, we have ETFs related to copper, palladium, mining and BitCoin. SPY and QQQ may be trading at new highs, but they are not leading year-to-date and these alternative ETFs still warrant our attention.
Of the non-crypto non-commodity equity ETFs leaders, two groups stand out. Industrials and Technology. The Aerospace & Defense ETF and the Industrials SPDR are in the top 20. Within tech, the ARK Fintech, Global Clean Energy, Cybersecurity and Semiconductor ETFs are in the top 20. It is good to see semis rebound and lead within the tech sector.
IEF Falls Back to Breakout Zone
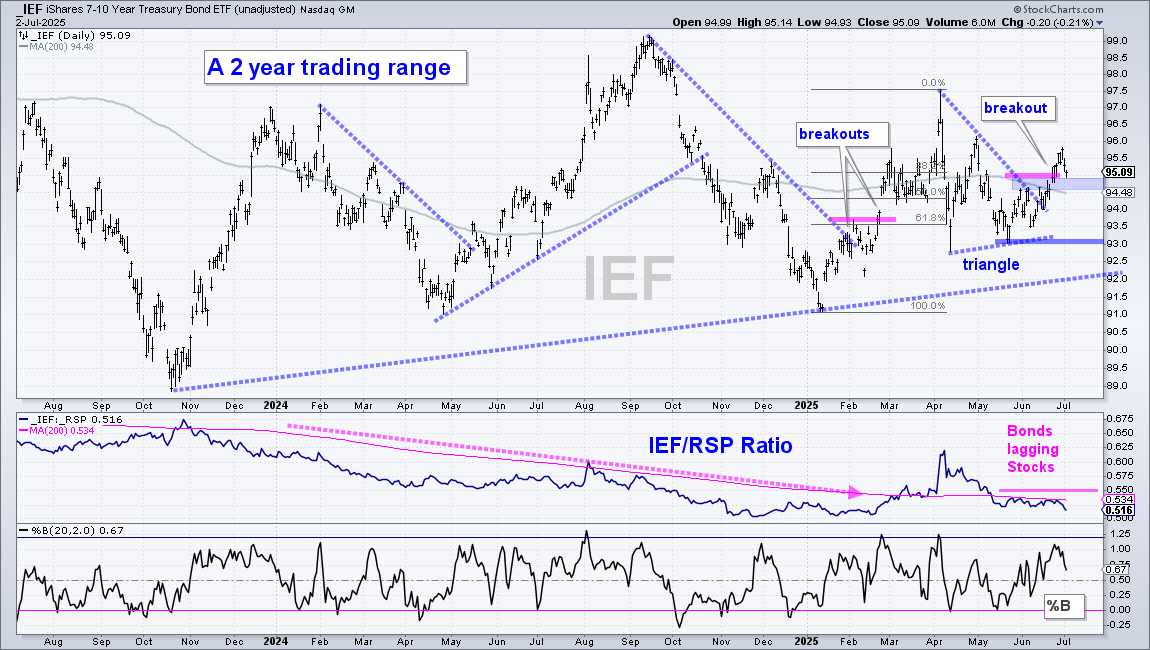
The 7-10Yr TBond ETF (IEF) is mostly range bound the last two years, but has a slight upward bias with the breakouts in late February and June. First, IEF fell from September to early January and reversed this downswing with a breakout in February. After tagging 97.5, IEF consolidated with a triangle and broke out with a surge in late June. I view the triangle as a correction after the advance from early January to early April. The June breakout, therefore, signals a continuation of this advance. IEF fell back the last three days with the breakout zone marking the first support area to watch (blue shading). A throwback to the breakout zone is not uncommon and offers a second chance. Key support is set at 93. The middle window shows the IEF:RSP ratio falling since April as bonds underperform stocks.
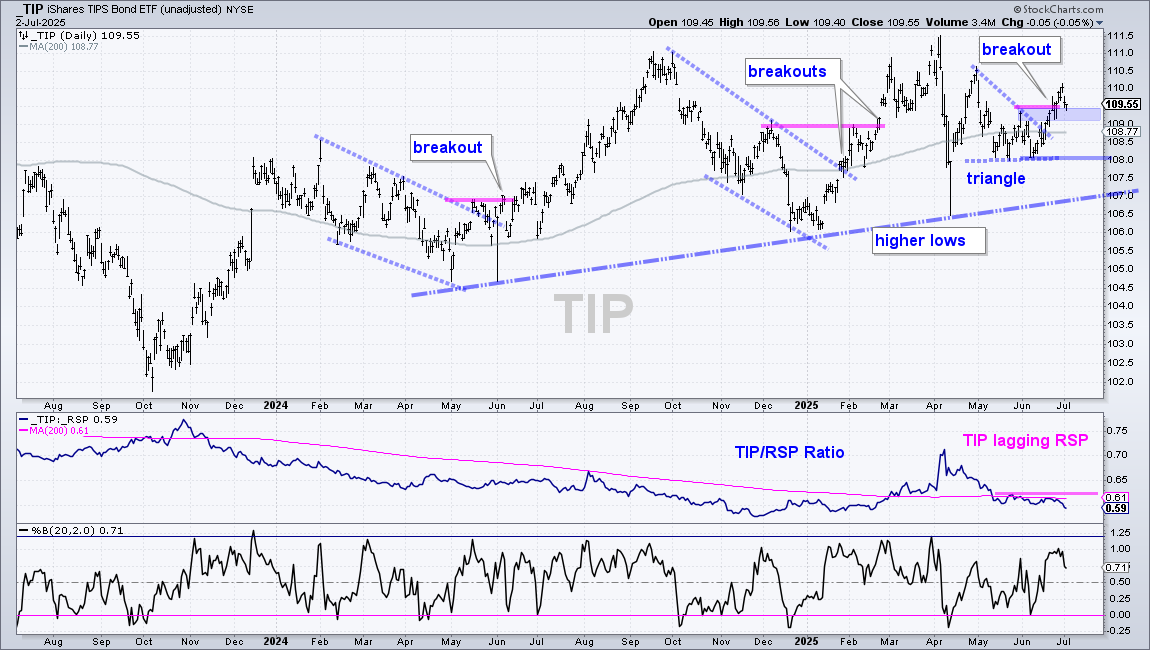
The next chart shows the 0-30Yr TIPS Bond ETF (TIP), which is inflation-protected. TIP is in a long-term uptrend with new highs in September and April. Most recently, the ETF fell back after the early April high, consolidated into late June and broke out with a surge to 110. This breakout argues for a continuation of the bigger uptrend. As with IEF, TIP fell back the last three days with the breakout zone marking first support (blue shading). I am marking re-evaluation support at 108.
GLD Consolidates within Uptrend and Becomes Oversold
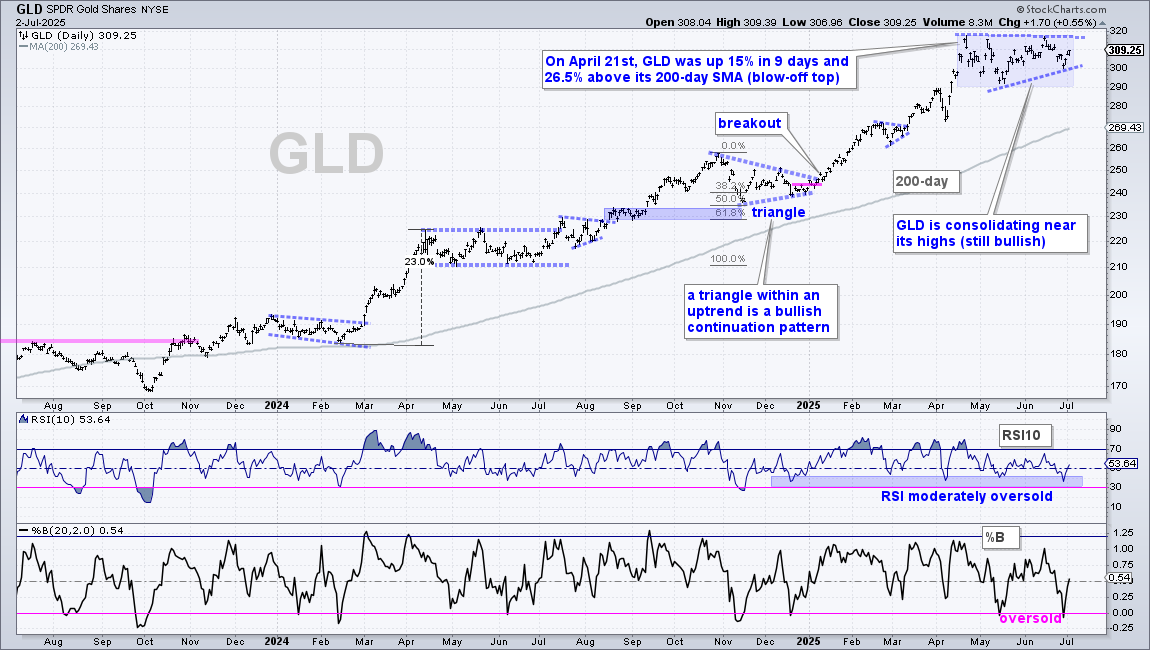
The Gold SPDR (GLD) remains in a leading uptrend with a new high in April and price well above the rising 200-day SMA. GLD became very overbought on April 21st and worked off this overbought condition with a triangle consolidation, which is a bullish continuation pattern. A breakout at 320 would signal a continuation higher. Within the triangle, GLD fell from 320 to 300 and then turned up the last three days. The swing within the triangle turned up and this increases the chances for a breakout at 320.
The indicator windows show %B dipping below 0 to become oversold and RSI dipping into the 30-40 zone. A %B dip below 0 is clearly oversold, while an RSI dip in the 30-40 zone marks a moderately oversold condition. Oversold within an uptrend means there was a pullback and pullbacks within uptrends are opportunities.
SLV Holds above Breakout Zone
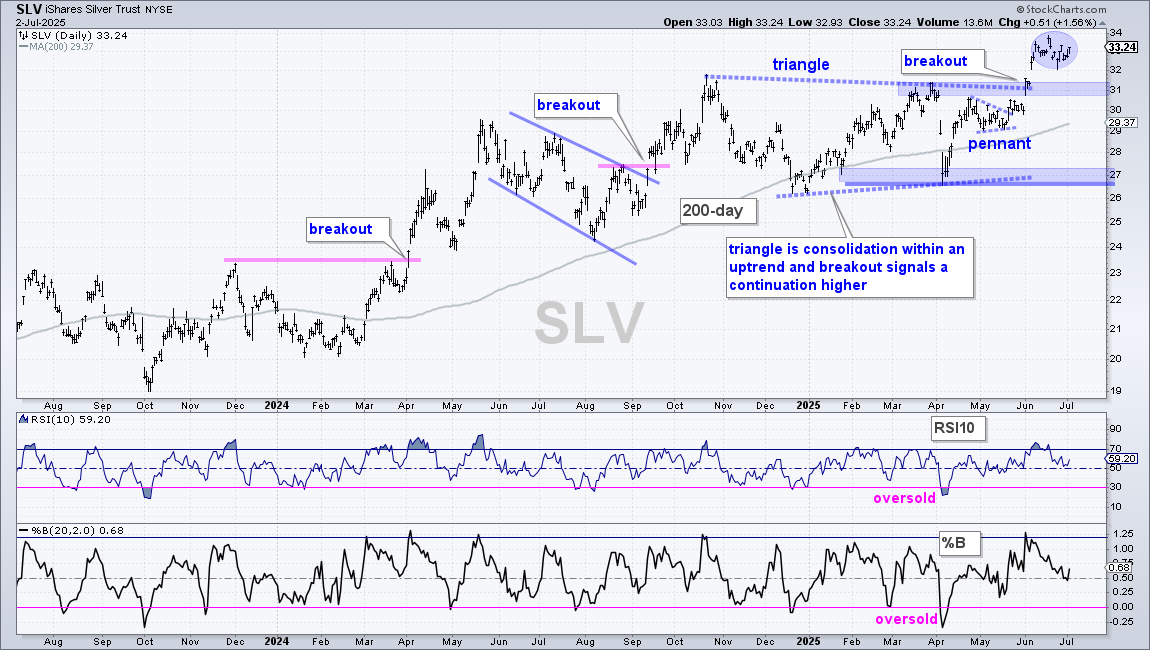
The Silver ETF (SLV) remains in a long-term uptrend with a new high in June and price well above the rising 200-day SMA. The most recent signals were the pennant breakout on May 21st and the triangle breakout on June 3rd. Broken resistance in the 31 area turns first support should SLV pullback. Currently, the ETF is simply consolidating above the breakout zone (blue circle). While I do not see a clean flag or pennant, a consolidation after a sharp advance is a bullish continuation pattern.
GDX and SIL Consolidate after New Highs
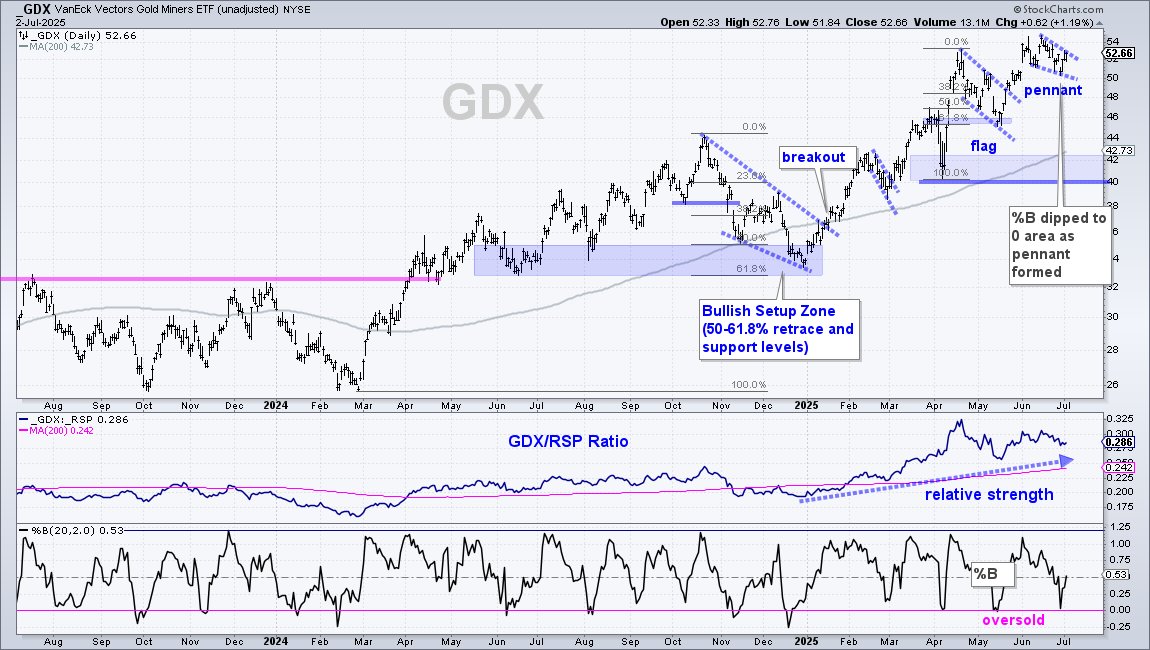
The Gold Miners ETF (GDX) remains in a leading uptrend with a new high in mid June and price well above the rising 200-day SMA. Most recently, GDX surged from mid May to mid June and then consolidated with a pennant. This is a short-term bullish continuation pattern and a breakout at 53.5 would signal a continuation higher. The lower window shows %B almost dipping below 0 last week to signal an oversold setup.
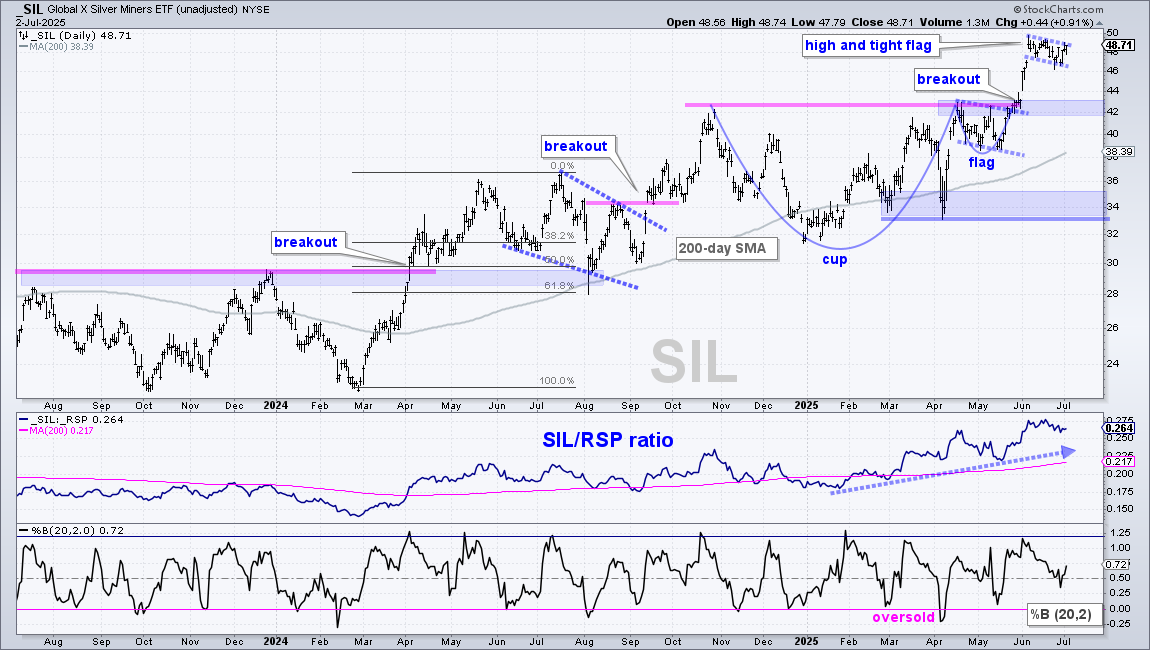
The Silver Miners ETF (SIL) is also in a leading uptrend with a new high in June and price well above the rising 200-day SMA. Most recently, SLV formed a cup-with-handle from October to May and broke rim resistance in late May. Also notice that a flag marked the handle and the flag breakout was also bullish. After surging from 38 to 50, SLV consolidated with a high and tight flag the last few weeks. This is a bullish continuation pattern and a breakout at 49 would signal a continuation higher.
Keep in mind that 2-3 week patterns are short-term and short-term price action is subject to noise (random fluctuations). A flag breakout would fail with a move below 46, but this would not affect the long-term uptrend. Instead, it would likely need to the next setup. Broken resistance turns support in the 42-43 area. Chartists can also watch for %B to become oversold.
Palladium Extends on Breakout
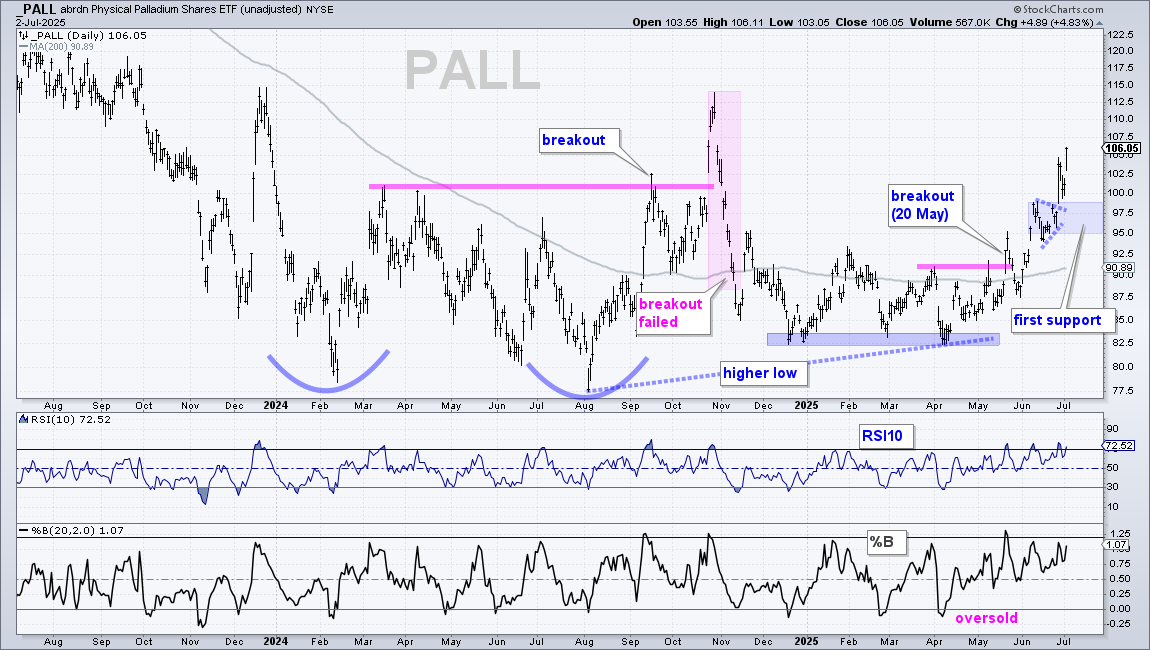
The Palladium ETF (PALL) moved into a long-term uptrend with the breakout on May 20th and the 200-day SMA also turned up in May. PALL surged above 95 in mid June, formed a small pennant and broke out with a surge above 102.5 in late June. After a two day pullback to 100, the ETF surged again on Wednesday and the long-term uptrend is extending. I do not see a setup on this chart right now. PALL is in the trend-monitoring phase, which means it is time to monitor price action and wait for the next tradable setup to emerge.
Platinum ETF Extends Even Further
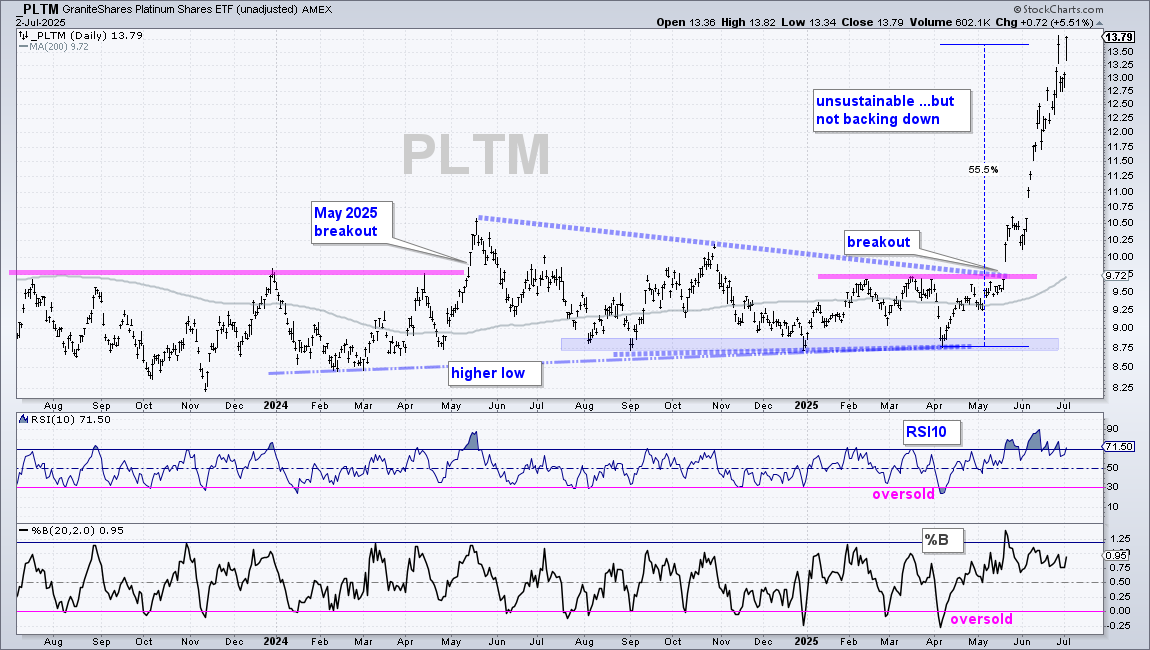
There is no change for the Platinum ETF (PLTM) as it extended even further and hit a new closing high this week. This unsustainable advance looks even more unsustainable, but PLTM is not backing down. There are some serious money flows into this gold substitute. I do not see a setup on this chart. Just a runaway train. Normally, a parabolic move like this is dangerous. At the very least, volatility is above average and don’t forget that volatility cuts both ways. There is nothing to do here except watch for tradable pullbacks and short-term oversold conditions.
CPER Extends on Upswing
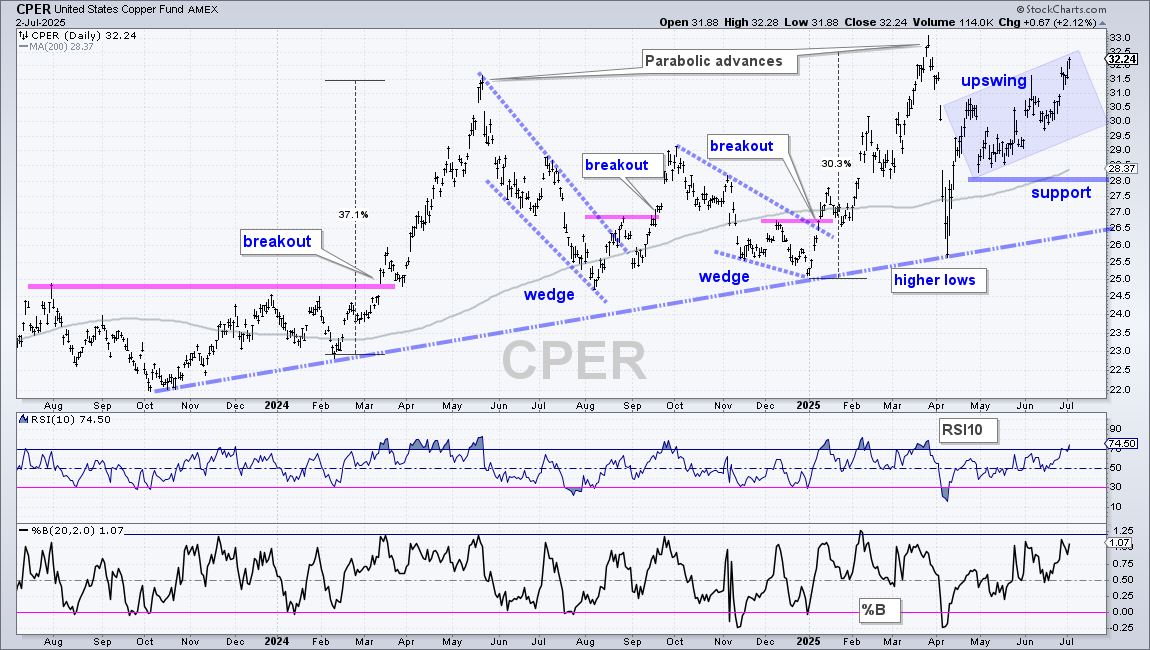
The Copper ETF (CPER) remains in a long-term uptrend with a new high in March and price above the rising 200-day SMA, Short-term, CPER plunged to 26 in early April and formed a V reversal with a surge to 31. This put the ETF back above the rising 200-day SMA. CPER has since worked its way higher with and upswing the last few months (blue shading). Most recently, the ETF surged from late June to early July and is nearing its April high. I do not see a setup on this chart, just bullish price action and the expectation for a new high. Key support remains at 28.
DB Base Metals ETF Extends on Pennant Breakout
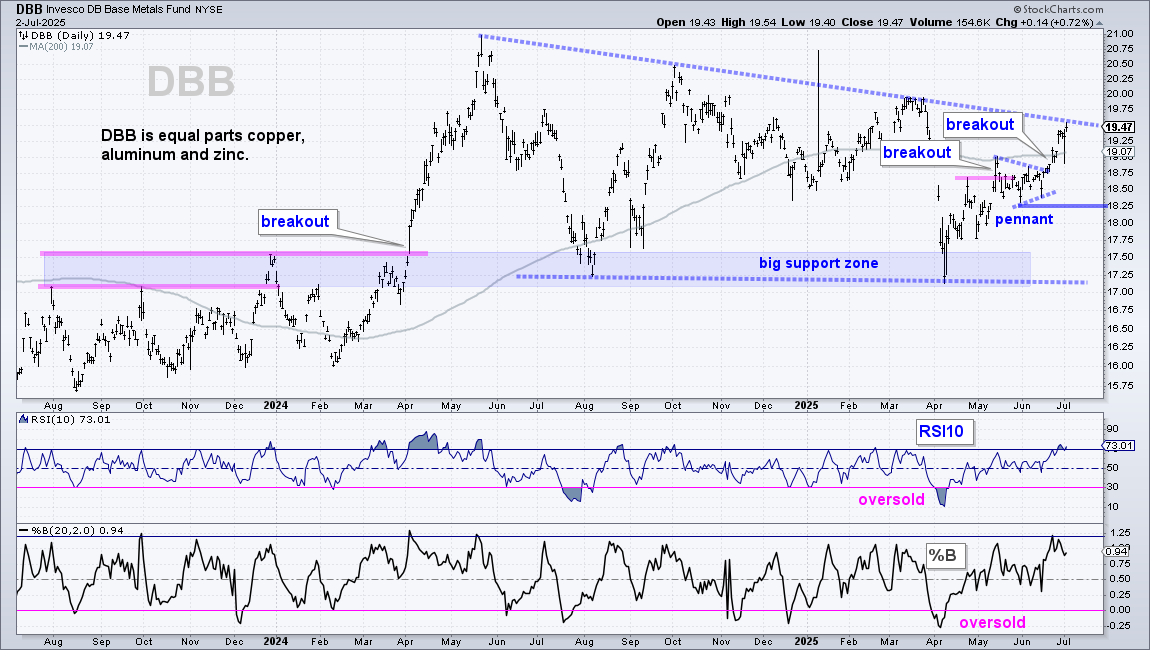
The DB Base Metals ETF (DBB) is equal parts copper, aluminum and zinc. Overall, the ETF remains in a downtrend since the second half of 2024 with a large falling wedge taking shape (blue dashed lines). DBB is challenging the upper line and a breakout at 20 would be long-term bullish. Short-term, DBB surged from early April to mid May, consolidated with a pennant and broke out two weeks ago. DBB is also back above the 200-day SMA, which has started to rise. Given strength in metals overall, I have a bullish bias on DBB. Re-evaluation support is set at 18.25.
LIT Surges, Consolidates and Breaks Out
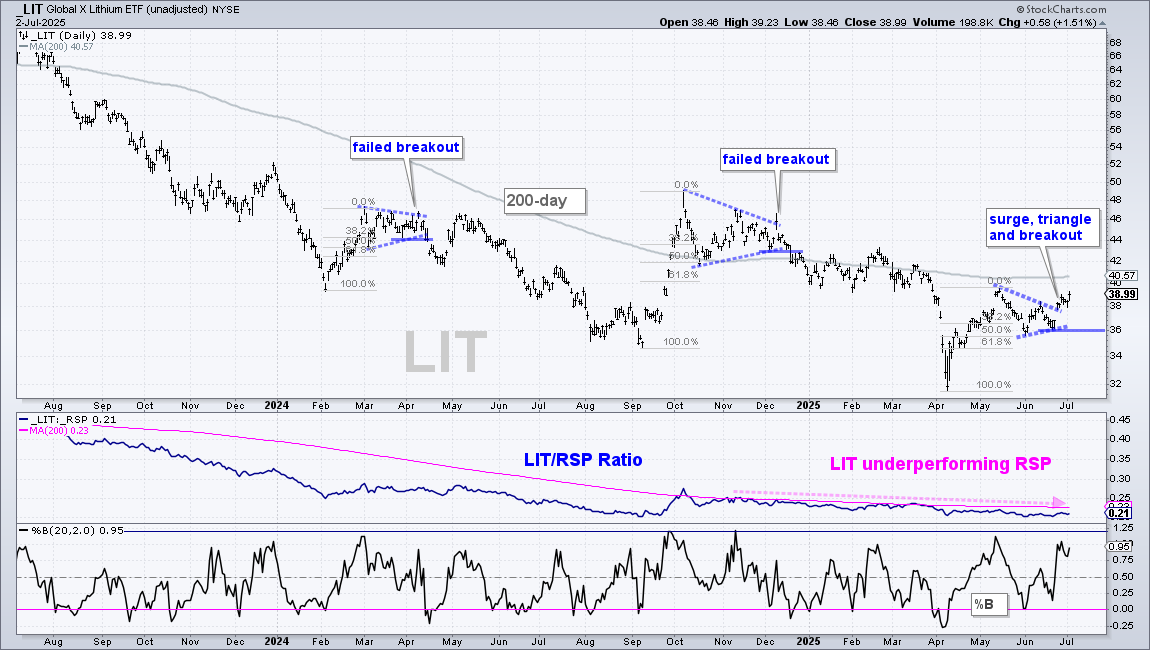
There is no change for the Lithium & Battery Tech ETF (LIT). LIT is in a long-term downtrend with a new low in April, but the ETF is making a breakout bid with a surge the last two weeks. There were two failed breakouts in 2024 when the ETF surged, consolidated, broke out and then moved lower. Another surge, consolidation and breakout sequence is underway. LIT surged from 32 to 40 in April-May, consolidated into June and broke out at 38. This breakout is bullish with re-evaluation support marked at 36. Note that LIT has above average volatility (risk).
Should the breakout extend to the 42 area, traders can consider booking partial profits and ride the remainder with a trailing stop. Selling one third to one half for a profit will ensure that the entire position does not develop into a loss. Note that LIT is largely a play on China with 43.5% exposure to the country. 20% of component stocks are US-based with the largest being Albemarle (7.8%) and Tesla (5%).
Natural Gas ETF Breaks Triangle Line
The Natural Gas ETF (UNG) is also going off the leader list because it broke triangle support and is below the 200-day SMA. Short-term, UNG fell back to support with a decline from March to April. This 38% decline looked a pullback after the 98% surge from November to March, but UNG failed to bounce and instead formed a triangle. The ETF broke the triangle line this week and this signals a continuation lower. At the very least, UNG is clearly not a leader because it is below its 200-day and back near its April lows.
DB Agriculture ETF Breaks Down
The DB Agriculture ETF (DBA) is going off the leader list because the wedge breakout failed and DBA moved below the 200-day SMA. I also see a lower high from February to May. DBA is no longer in a clear uptrend and no longer a leader. Even though %B and RSI became oversold this week, I am not interested in oversold conditions when the bigger trend is down.
Bitcoin Breaks Out of Bull Flag
The Bitcoin ETF (IBIT) remains in a long-term uptrend with a new high in May and price above the rising 200-day SMA. Medium-term, the last signal was the wedge breakout in late April. IBIT extended to a new high in late May and then corrected into June with a falling flag. These are short-term continuation patterns that take their trading bias from the direction of the prior move, which was up. IBIT broke the flag line with a 4.3% gain on Wednesday and this signals a continuation higher. I would then mark re-evaluation support at 59. A close below this level would negate the flag breakout.
As with any setup or breakout. It is important to plan your trade and then trade that plan. Are you a short-term active trader focused on the flag breakout? Or, are you a long-term weekend trader using pullbacks and bullish patterns to accumulate during an uptrend? While a close below 59 would negate the flag breakout and a move below 57 would seem quite negative. Keep in mind that the long-term uptrend would not be affected by such breaks. A move to the mid 50s would likely lead to the next setup. An RSI dip to the 30 area or %B dip to the 0 area would create an oversold condition that could provide a mean-reversion setup.
Send feedback to support(at)trendinvestorpro.com or use the contact form.