I am merging Chart Trader and System Trader into one offering (TrendInvestorPro Premium). This means subscribers have access to all areas, regardless of their subscription level.
To this end, I changed the website Navigation Menu, which is at the top of every webpage. The Premium Services section shows links to subscriber sections. Hopefully, it is self-explanatory. Here is a link to the Getting Started Page for more information.
Report Headlines
Minding the Breakout Gaps
Mid-caps are Still Struggling
Tech Related ETFs Dominate the Top 20
XLK Tags a New High
Tight Stops vs Wide Stops
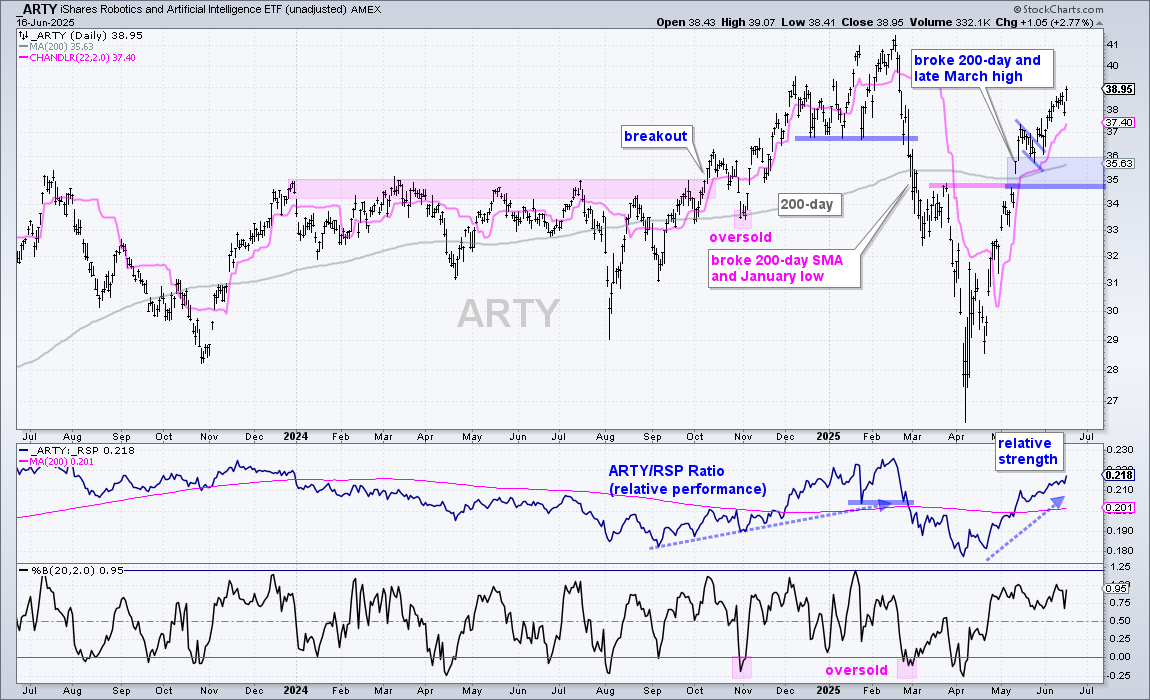
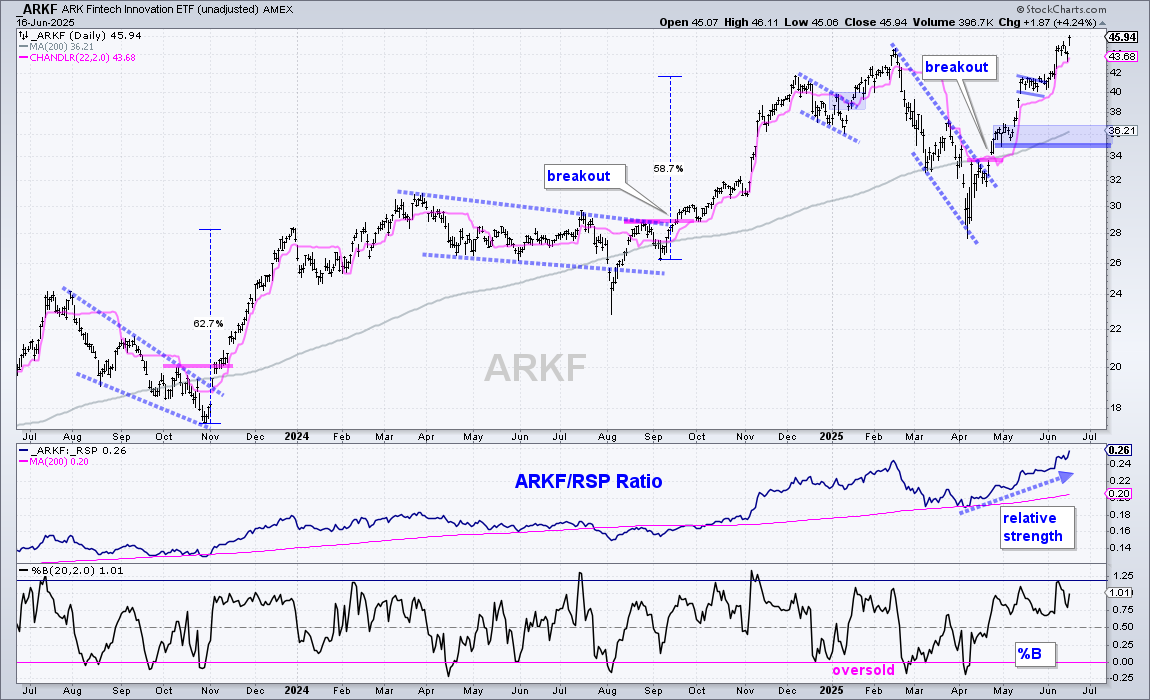
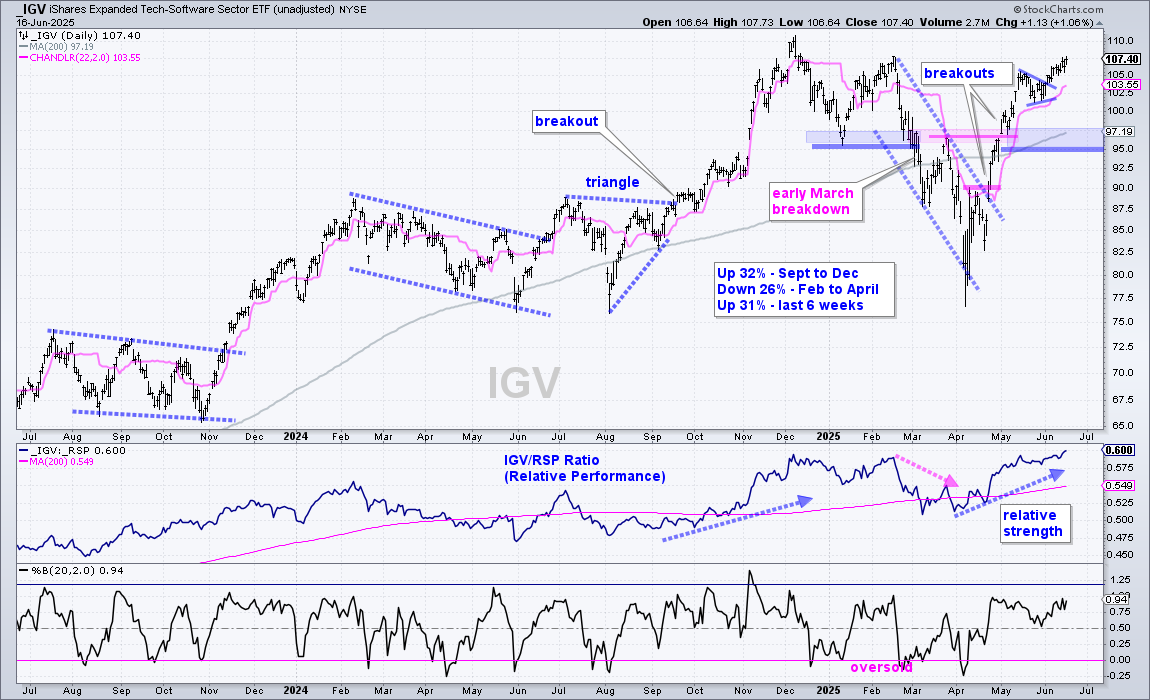
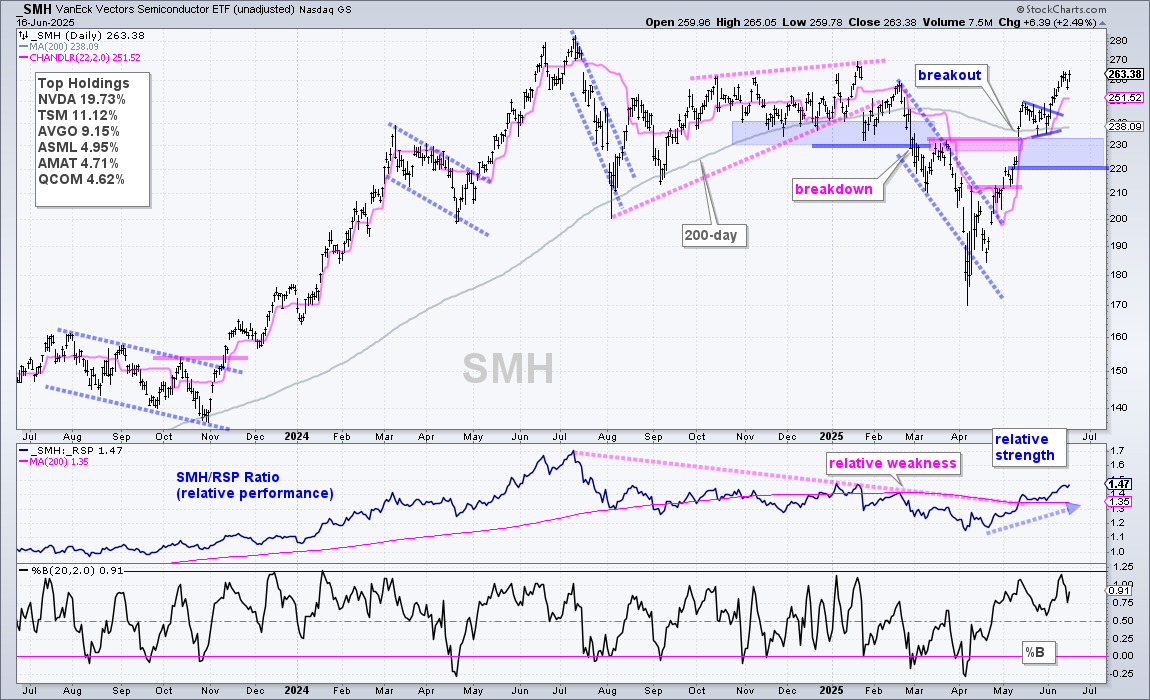
Seven Tech ETFs with Pennants and Tight Stops
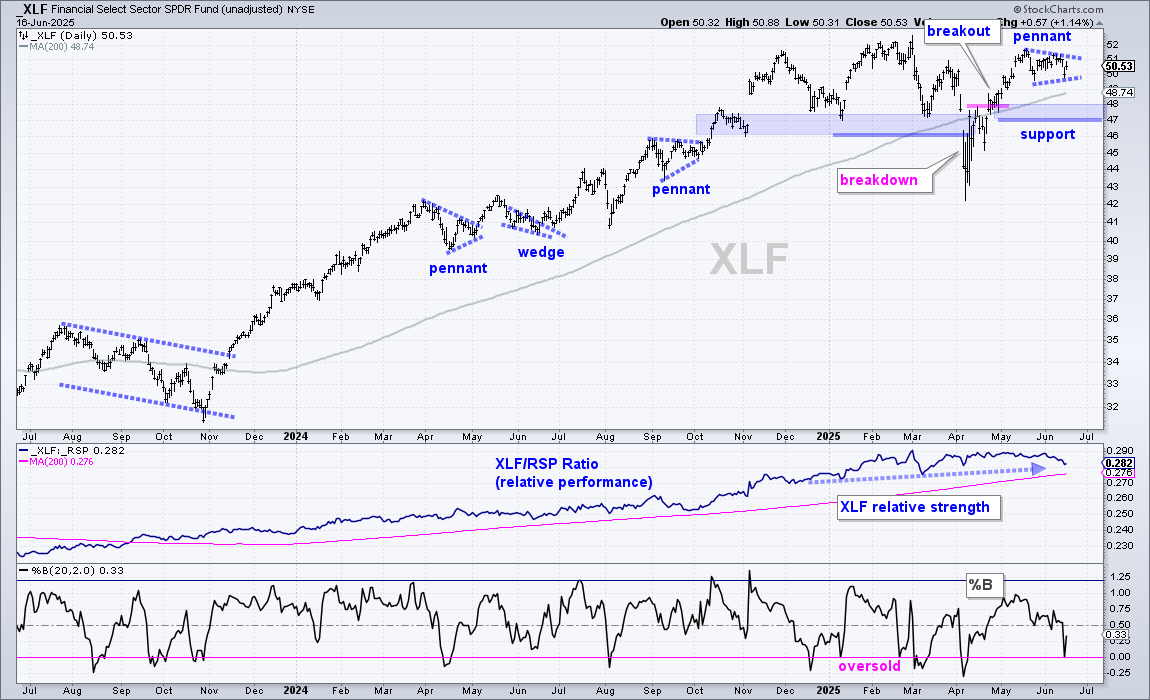
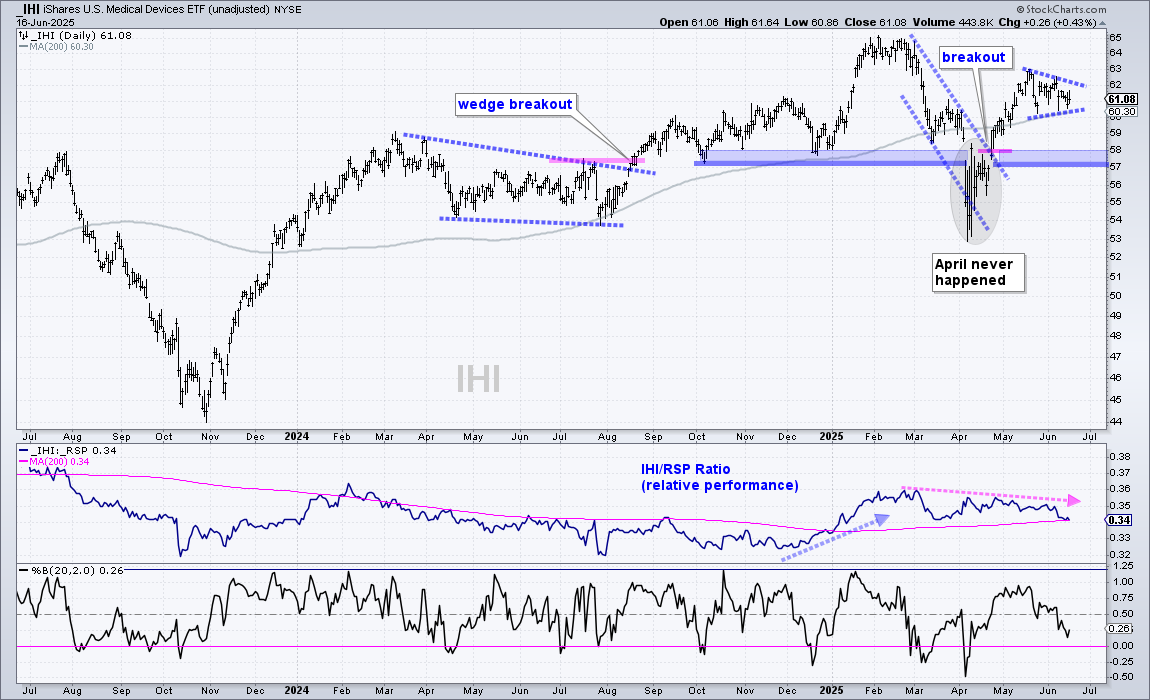
XLF and IHI Forms Pennants above 200-day SMAs
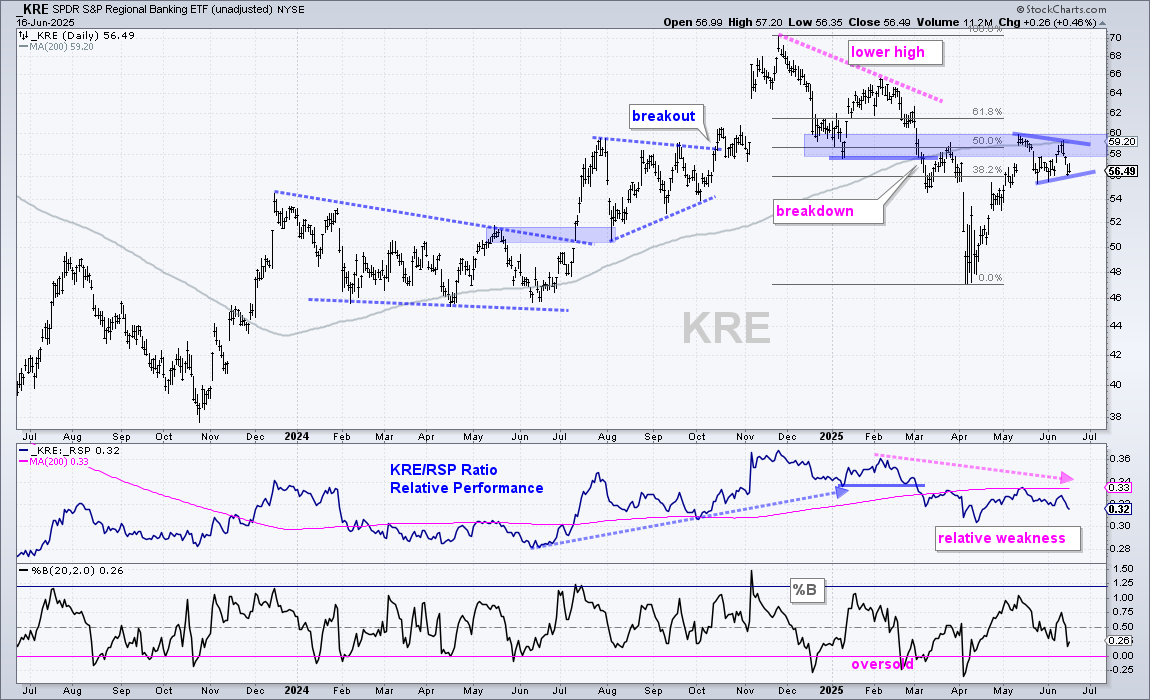
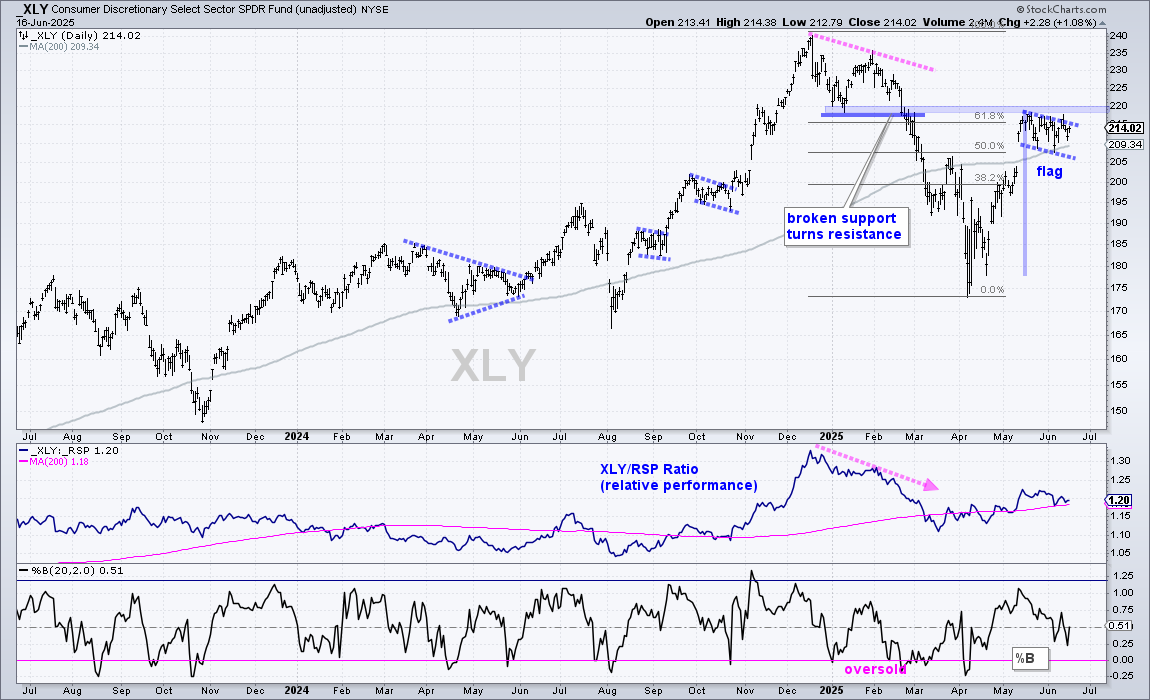
Regional Bank ETF and XLY Stall at Resistance
Tech and Communication Services Lead
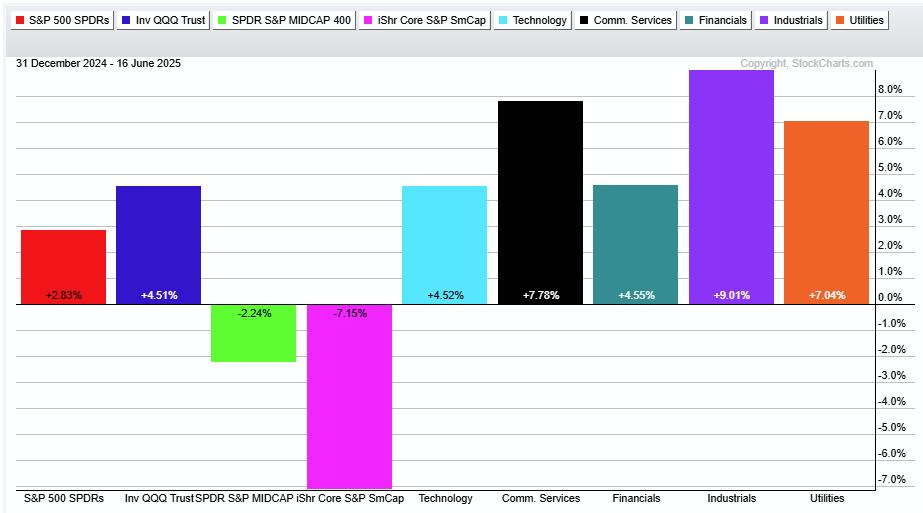
The stock market remains mixed. Large-caps are leading small and mid caps. SPY (+2.83%) and QQQ (+4.51%) are up year-to-date, but MDY (-2.24%) and IJR (-7.15%) are down. Within the market, we are seeing leadership from tech-related ETFs, industrials, defense and utilities. Year-to-date, we have XLK (+4.52%), XLC (+7.78%), XLF (+4.55%), XLI (+9.01%) and XLU (+7.04%).
Tech-related ETFs are leading in June as several broke out of pennants and extended higher. Today’s report will update these breakouts and their trailing stops. Despite continued strength in tech, I am seeing short-term underperformance emerge in mid-caps, finance, banks and consumer discretionary. These four are lagging the last 20 days because their respective ETFs have yet to clear their May highs.
Technical Event Timeline
March 13th – Bearish Long-term Breadth and Trend Indicators
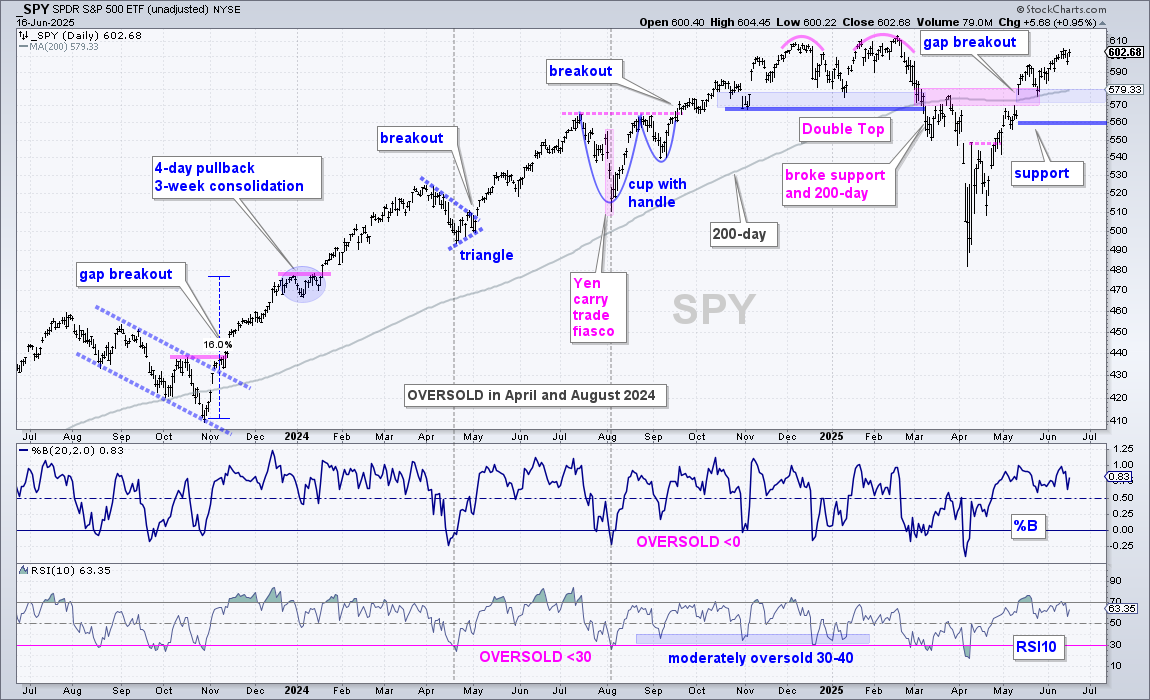
SPY turned bullish with the gap-breakout on May 12th. This move pushed SPY above the 200-day SMA and the long-term trend is up. I am marking long-term support at 560 (blue line). A close below 560 would erase the gap-breakout, break the 200-day SMA and reverse the long-term uptrend.
The short-term trend is up, but SPY is quite extended after a 17% gain since April 22nd. This overextended condition could lead to a pullback or a grind higher. A pullback to the 570-580 area would create a moderately oversold condition and an opportunity (blue shading). A %B dip below .25 and/or RSI dip below 40 would create a moderately oversold condition.
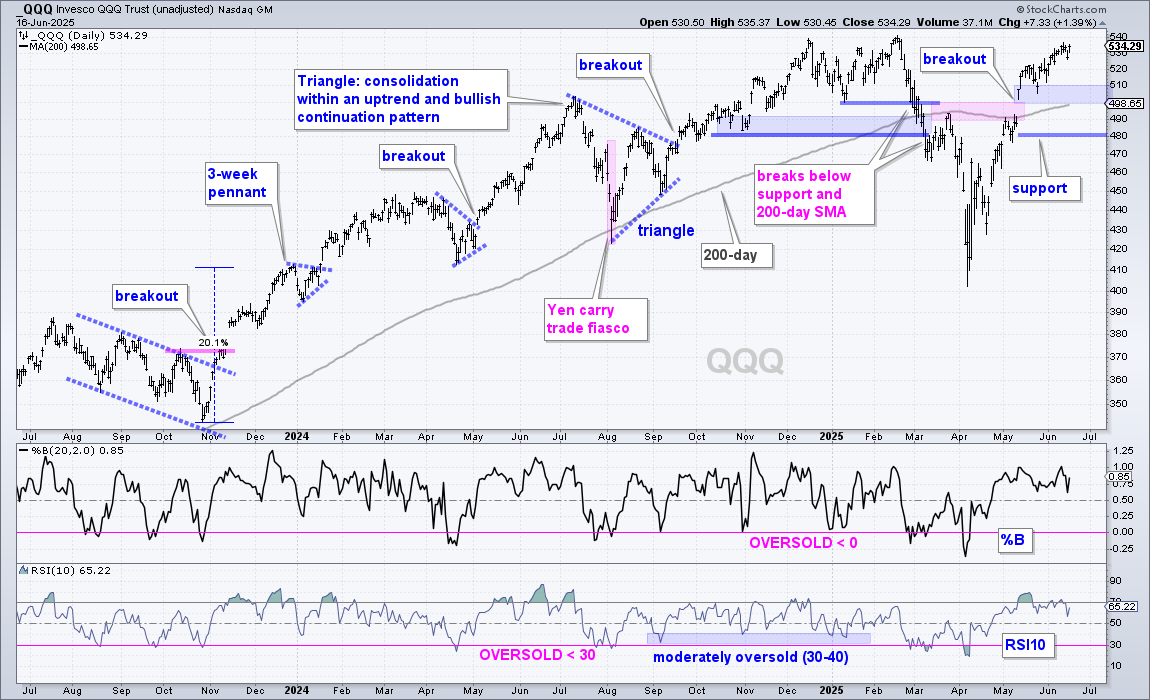
The QQQ chart shows similar characteristics, but QQQ is stronger than SPY because it is closer to a new high and further above the breakout zone (490-500). Long-term support is set at 480 for QQQ (blue line). A close below this level would fill the gap and break the 200-day SMA.
Short-term, QQQ is also extended after a 23% advance since April 22nd. Overextended or overbought conditions within an uptrend are normal because it takes strong buying pressure to become overbought. The overextended conditions simply increase the odds for a pullback or consolidation. Should QQQ pull back, I would watch the 500-510 area for potential support and a moderately oversold condition (blue shading).
Mid-caps are Still Struggling
The S&P MidCap 400 SPDR (MDY) captures the mood for the broader market, which is more than just large-caps. The broader market includes large-caps (SPY), mid-caps (MDY) and Small-caps (IJR). SPY and QQQ are in uptrends and leading, while IJR is still in a downtrend and lagging. MDY is caught in the middle.
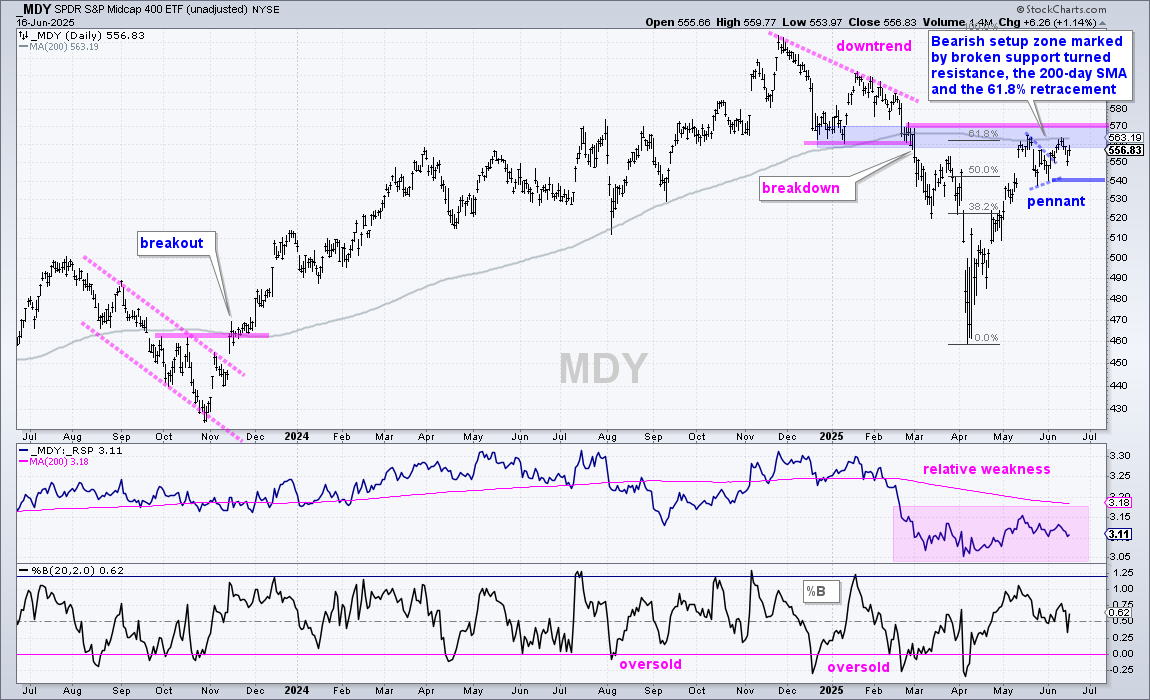
MDY remains in a long-term downtrend and the short-term uptrend hit a bearish setup zone in the 560-570 area. The long-term uptrend reversed with the breakdown in early March and MDY returned to broken support in May-June. I am marking a Bearish Setup Zone using broken support turned resistance, the 200-day SMA and the 61.8% retracement (blue shading). This is the area where one would expect a counter-trend bounce to reverse and the long-term downtrend to continue. Thus, MDY is at a make or break point. A close below 540 would reverse the short-term uptrend and signal a continuation of the long-term downtrend.
Short-term, MDY formed a pennant and broke out with a bounce last week. This breakout is already getting cold feet as MDY fell back to 550 on Friday. For now, the breakout is holding and I am marking re-evaluation support at 540. A close below this level would negate the pennant breakout. Should 540 hold, a breakout at 570 would be long-term bullish and suggest broadening strength within the stock market. I will add back the Chandelier Exit if MDY breaks 570.
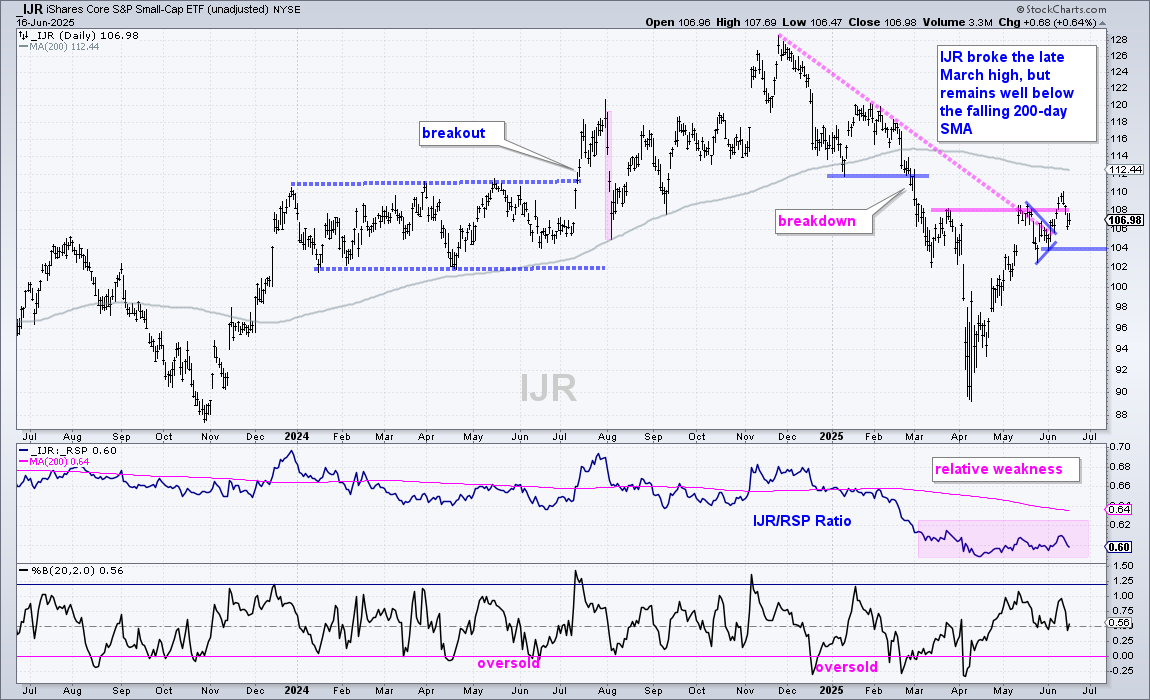
The MDY chart helps us understand why the long-term breadth indicators for the S&P 500 and S&P 1500 are still bearish. See the Market Regime report for details. SPY and QQQ look fine, but the bounce in MDY looks like a classic bear market rally. MDY is just below its flat 200-day SMA. The S&P SmallCap 600 SPDR (IJR) is well below its falling 200-day SMA. This is not a bull market that lifts all boats. At best, we are in a selective bull market.
Tech Related ETFs Dominate the Top 20
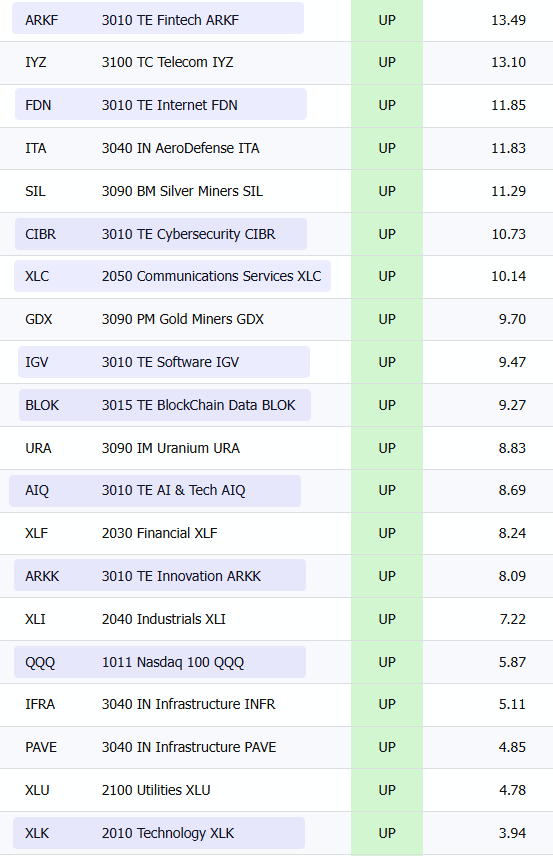
The table below comes from the ETF Rotation Strategy. See this page for more details and the complete ranking table. This image shows the top 20 equity ETFs, as ranked by the ETF Momentum indicator. All are in uptrends because the Trend Trio is positive (Up). The blue shading highlights the tech-related ETFs, and there are 10. This means tech-related ETFs account for 50% of the top twenty. Elsewhere, I am seeing upside leadership in telecom (IYZ), defense (ITA), finance (XLF), industrials (XLI) and utilities (XLU).
XLK Tags a New High
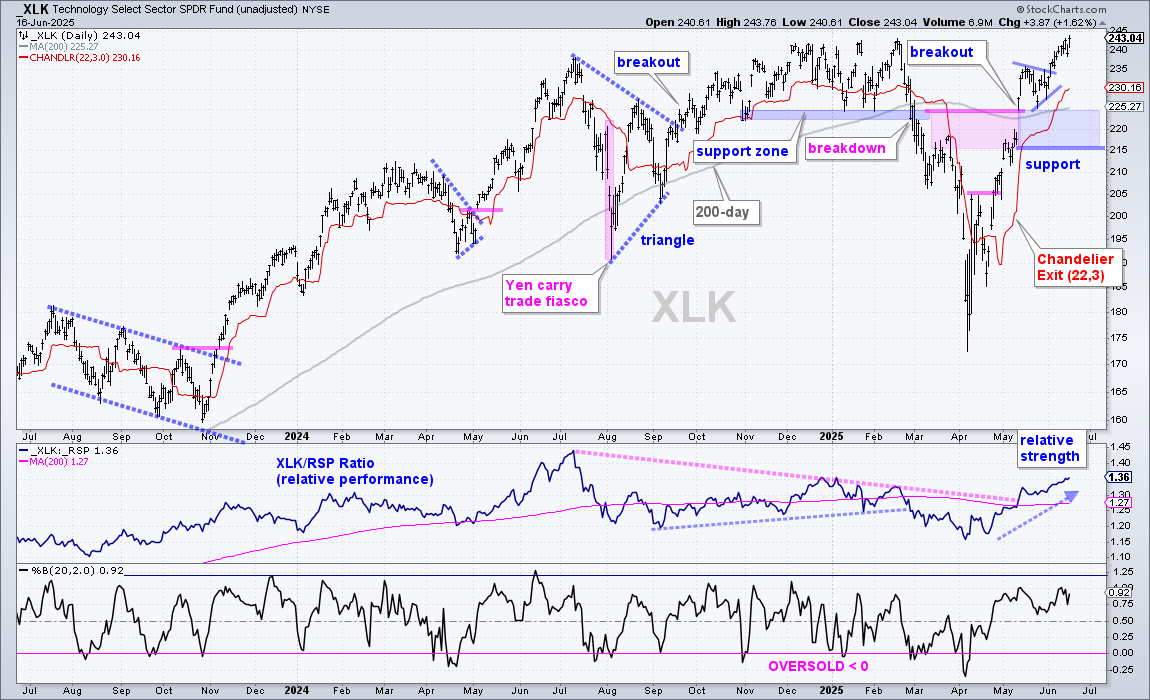
The Technology SPDR (XLK) fell 1.4% on Friday and gained 1.6% on Monday. With Monday’s bounce, XLK hit a new high and is part of the leadership group. ETFs hitting new highs in the last few weeks are clearly leading. In addition, ETFs trading above their May highs are leading short-term.
The chart below shows XLK with a 25% surge from April 22nd to May 15th (18 days). XLK was overextended in mid May and worked off this condition with a pennant consolidation. The ETF broke out of the pennant in early June and extended to a new high this week. This is a classic high-and-tight pennant.
The red line shows the Chandelier Exit (22,3), which is 3 ATR(22) values below the 22-day high. This exit rises as long as XLK rises. With the exit currently at 230.16, an exit here would wipe out the gains over the last two weeks. This is why it is often prudent to combine trailing stops with profit targets. Take some money off the table with profit stops and the use the trailing stop for the rest.
Tight Stops vs Wide Stops
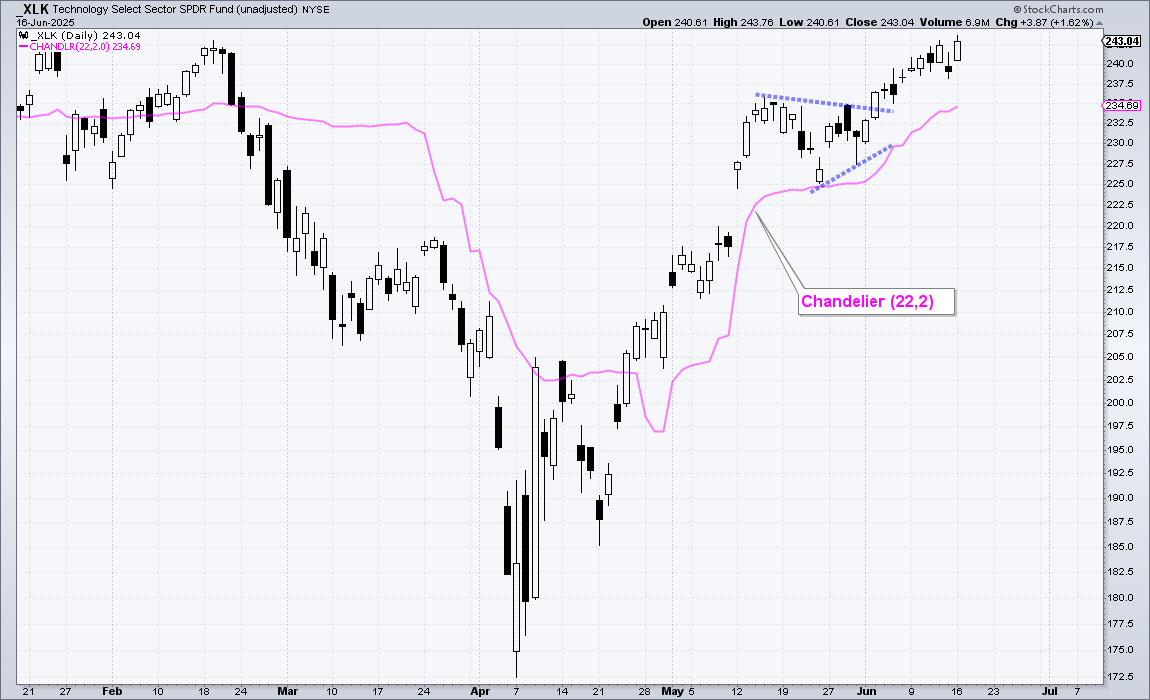
Tighter stops are also an alternative. The next chart shows XLK with the Chandelier Exit (22,2), which is 2 ATR(22) values below the 22 day high. This stop is tighter and near the breakout zone (234.69). Pennants extending two weeks are short-term patterns that deserve tighter stops. Patterns that extend four weeks or more deserve wider stops.
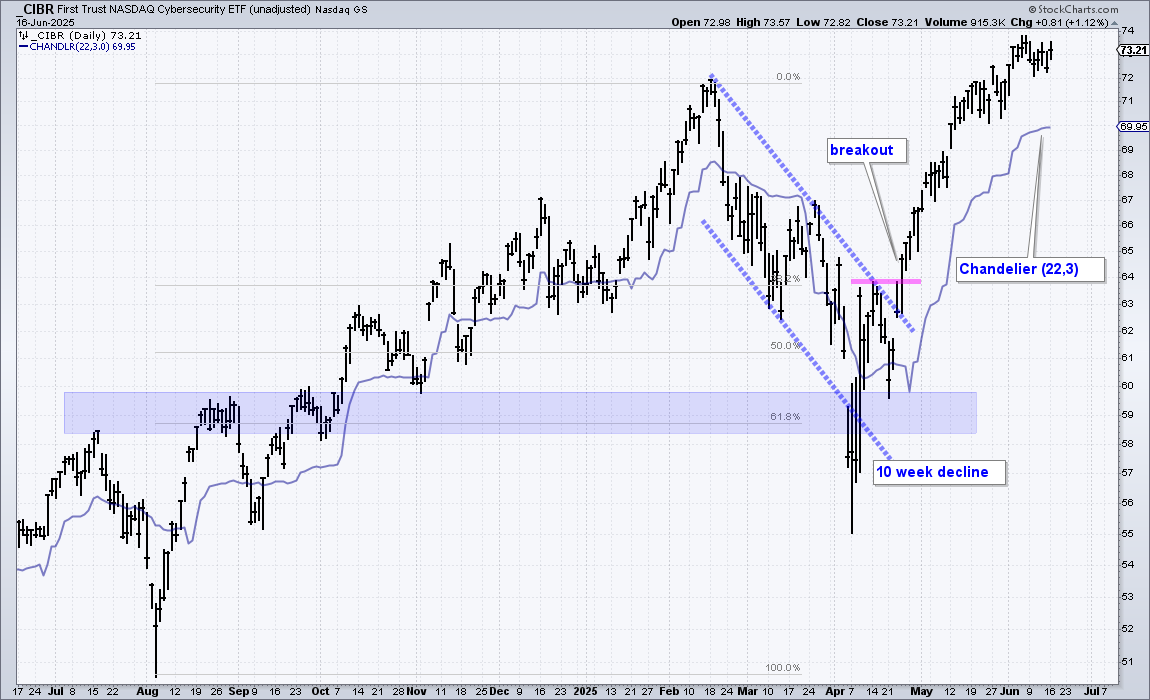
The next chart shows the Cybersecurity ETF (CIBR) with a 10 week decline and a breakout in late April. This bigger pattern deserves a wider stop. The blue line shows the Chandelier Exit (22,3) for reference. Again, a close below this exit would not affect the long-term uptrend. Instead, it would suggest that another corrective period is emerging.
Seven Tech ETFs with Pennants and Tight Stops
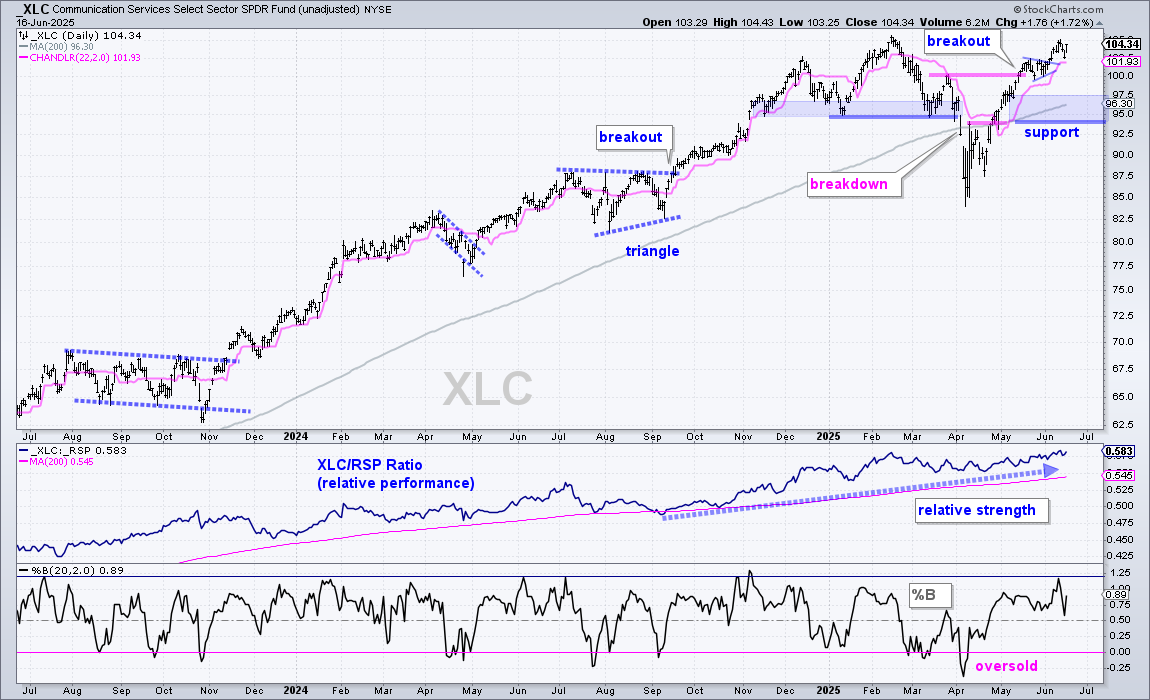
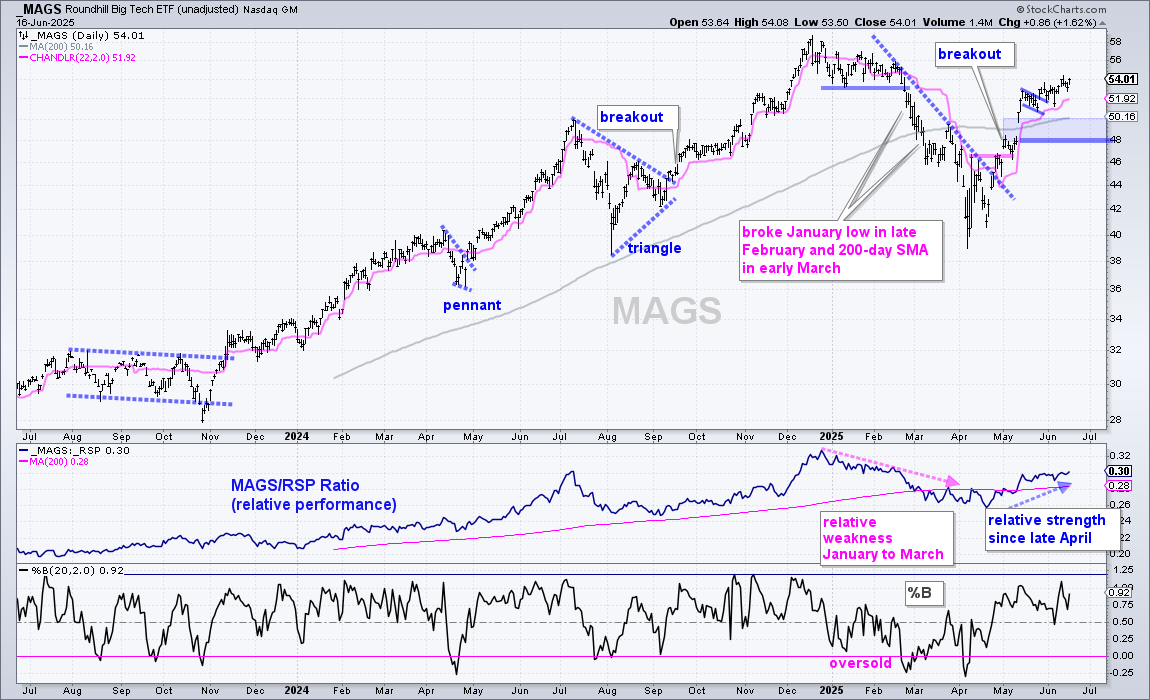
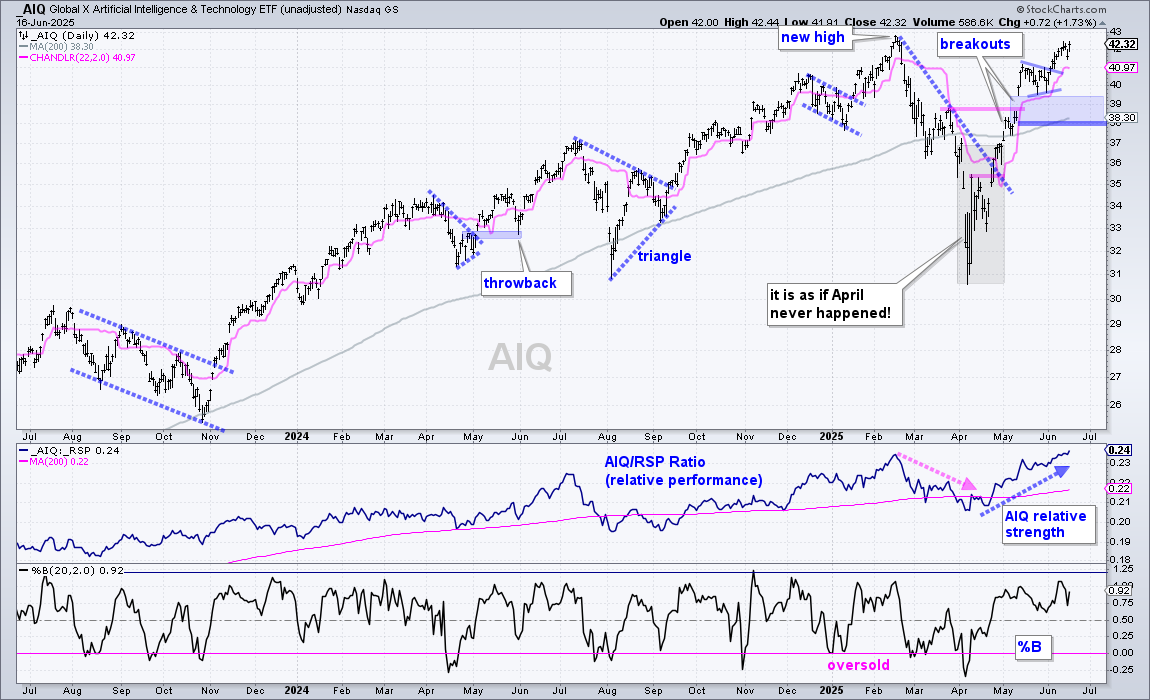
The next charts show six tech-related ETFs with pennant breakouts and Chandelier Exits (22,2). Because these pennants are 1-2 weeks long, I am opting for a tighter stop. A close below the stop would reflect weak follow through on the pennant breakouts. Keep in mind that these are short-term patterns. A close below the stop would be negative for the pennant, but not affect the long-term uptrends. I would then reset and wait for the next bullish setup to materialize.
XLF and IHI Forms Pennants above 200-day SMAs
The tech-related ETFs are leading because they surged in June and exceeded their May highs. SPY and QQQ also exceeded their May highs. There are several ETFs stuck in short-term consolidations and below their May highs. They are lagging short-term.
The chart below shows the Finance SPDR (XLF) with a pennant forming just below the February-March highs. An upside breakout would signal a continuation higher. The late May low marks support and a break here would reverse the upswing since early April. This would argue for a pullback, perhaps the support in the 47-48 area.
The next chart shows the Medical Devices ETF (IHI) with a pennant forming just above the 200-day SMA.
Regional Bank ETF and XLY Stall at Resistance
The Regional Bank ETF (KRE) chart looks similar to the MDY chart. KRE broke down in early March, plunged into early April and then rebounded into late May. The rebound retraced around 50% of the December-April decline and returned to the 200-day SMA (and broken support turned resistance). As with MDY, the April-May bounce looks like a counter-trend move within a bigger downtrend. The blue shading marks a Bearish Setup Zone, which is where I would expect a counter-trend bounce to fail. A break below the late May lows would reverse the short-term upswing and signal a continuation of the bigger downtrend.
I favor the bearish alternative because KRE is below its 200-day and showing relative strength, but here is a bullish alternative to consider. Short-term, KRE formed a pennant, which could be a bullish continuation pattern. A breakout at 60 would signal a continuation higher. Such a move would be positive for small-caps because financial services is the biggest sector in the S&P SmallCap 600 SPDR (IJR).
The next chart shows the Consumer Discretionary SPDR (XLY) hitting its moment of truth as a bull flag forms at the 61.8% retracement. A flag breakout and move above 220 would be bullish, while a break below 205 would reverse the short-term upswing.
Send feedback to support(at)trendinvestorpro.com or use the contact form.