Gold and Silver Miners Lead their Respective Metals
Palladium Falls back after Breakout
Platinum ETF Gets Massive Breakout
Copper ETF Falls Back after Breakout
Natty Battles Support Zone
DBA Remains with Uptrend and Breakout
IBIT Backs off after New High
Commodities and Crypto Leading in 2025
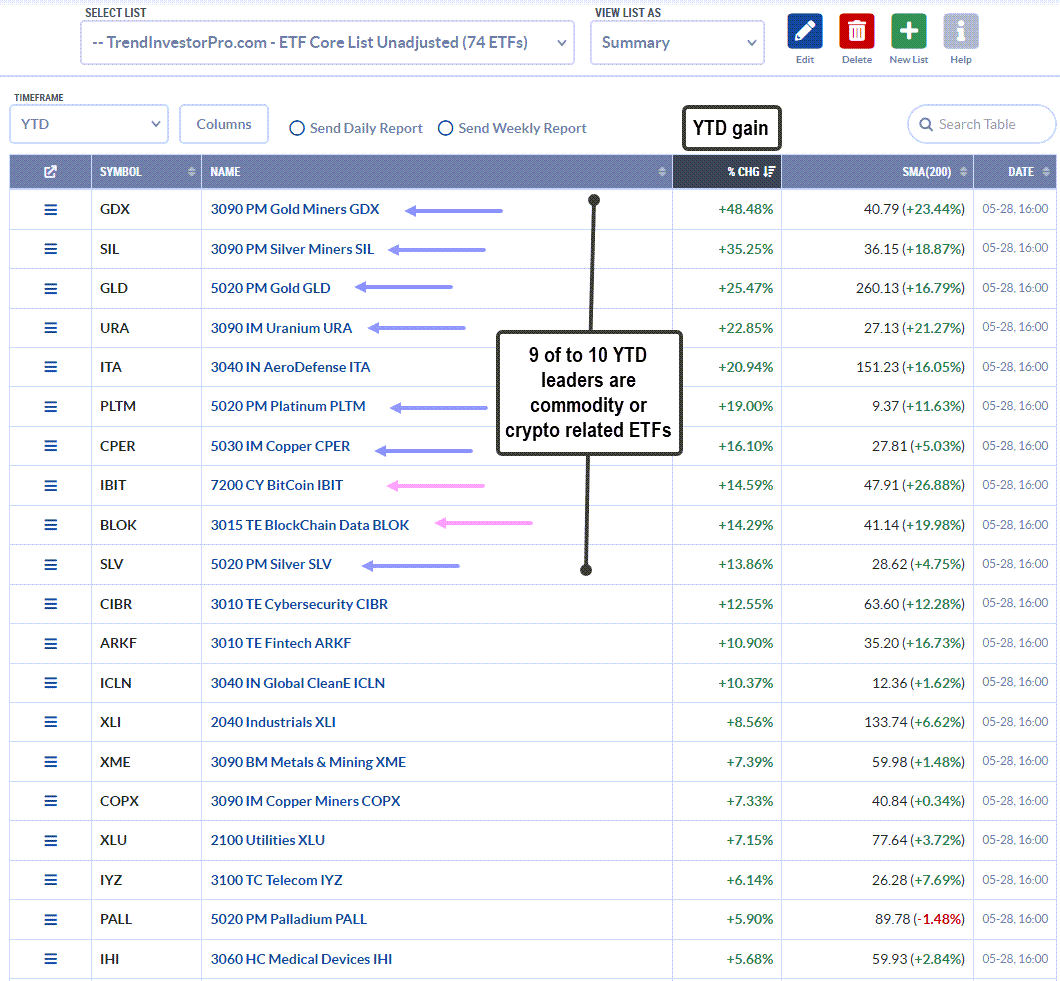
Today’s report covers commodity ETFs and the Bitcoin ETF (IBIT), simply because they are leading in 2025. Year-to-date, nine of the top ten performing ETFs are commodity or crypto related. My focus list has 74 ETFs covering equities, commodities, bonds and crypto. I recently added PALL and PLTM to the list. The Aerospace & Defense ETF (ITA) is the only equity ETF in the top ten right now. The table below shows the 20 ETFs with the highest year-to-date gains. We see seven equity ETFs in the second half of this list (CIBR, ARKF, ICLN, XLI, XLU, IYZ, IHI). There are also three more commodity-related ETFs (XME, COPX, PALL). These 20 ETFs are leading the market right now.
GLD Forms Flag as SLV Breaks Out of Pennant
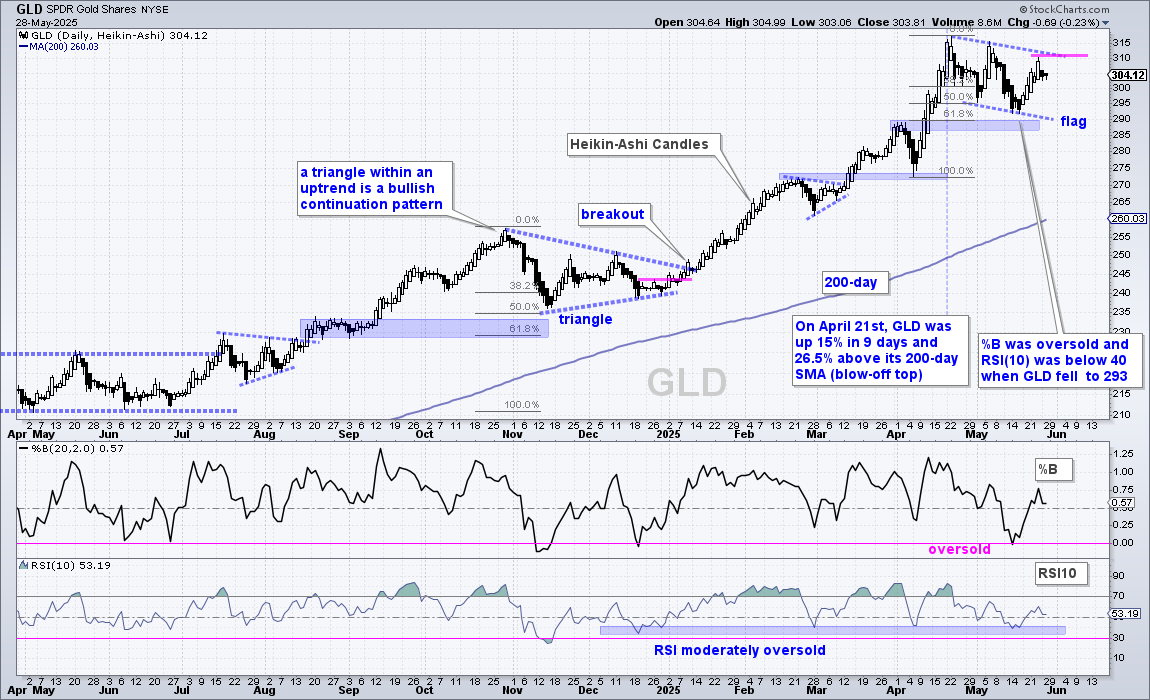
The Gold SPDR (GLD) remains in a long-term uptrend with a bullish flag forming since mid April. GLD became extremely overbought after surging to a new high on April 21st. The ETF worked off these overbought conditions with a falling flag. These patterns represent a correction after a sharp advance, and they are bullish continuation patterns. A breakout at 312 would confirm the pattern and open the door to new highs.
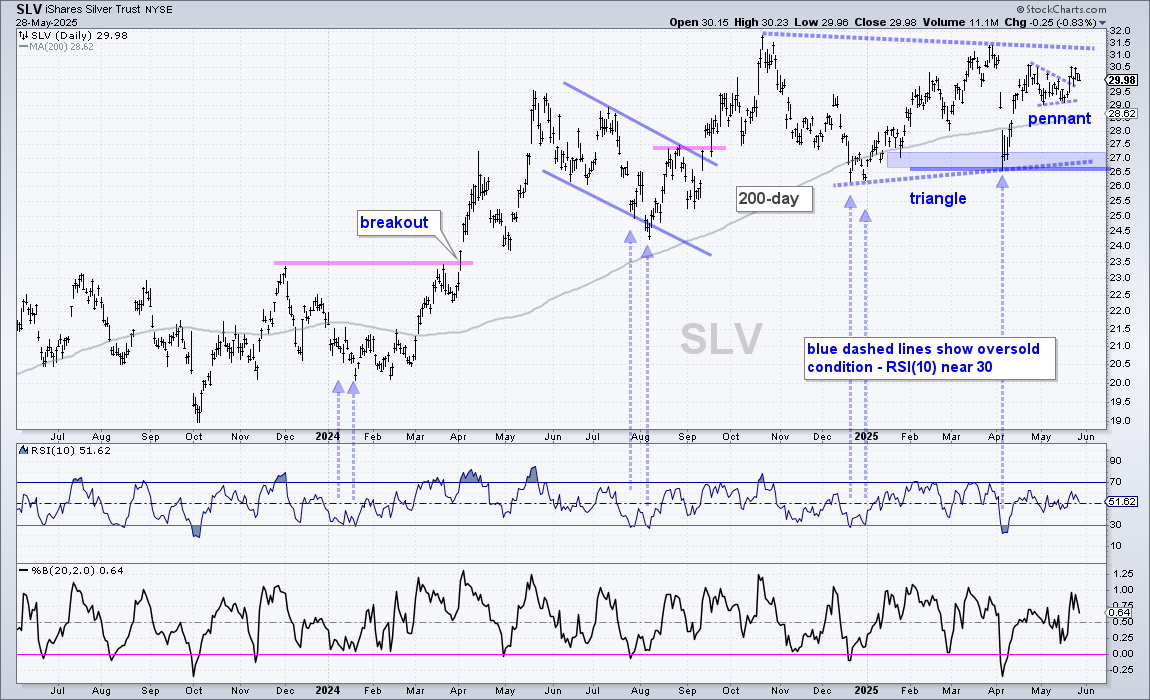
The Silver ETF (SLV) is in some sort of long-term uptrend because it is above the rising 200-day SMA. The ETF, however, trades choppy and can easily swing 10+ percent in a few weeks. Overall, SLV hit a new high in October and then consolidated with a large triangle. I view this as a consolidation within a long-term uptrend. A breakout at 31.5 would signal a continuation higher. Within this large triangle, SLV surged in early April, formed a small pennant and broke out last week. The ETF is stalling around the breakout zone, but this breakout is holding. A close below 29 would negate this signal.
Gold and Silver Miners Lead their Respective Metals
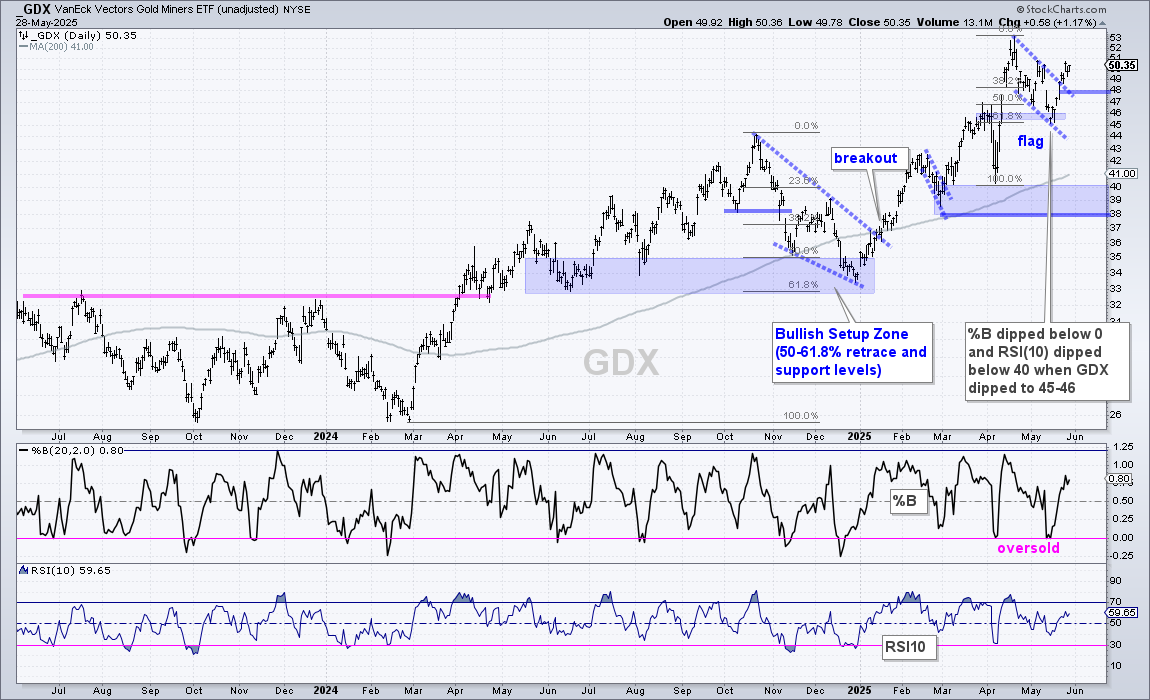
The Gold Miners ETF (GDX) is slightly stronger than GLD because it has a flag breakout working. Keep in mind that flags are short-term patterns. The shorter the pattern, the more noise and the higher the chances of whipsaw (failure). A strong breakout should hold and a close below 48 would negate the breakout. A failed breakout, however, would not affect the bigger uptrend. Instead, it may lead to a pullback and oversold condition for the next setup (as long as the uptrend holds).
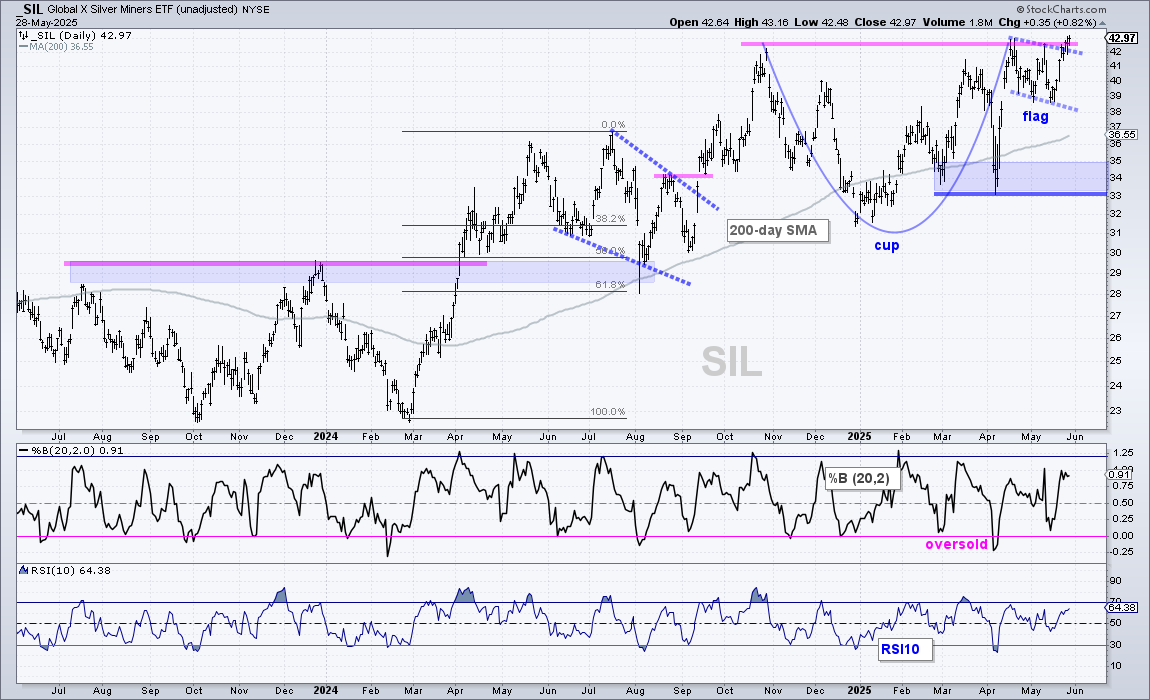
The Silver Miners ETF (SIL) is leading silver because it broke out of the flag and tagged a new high this week. Overall, the swoon into December and rise into April look like a cup, the flag looks like a handle. This makes for a bullish cup-with-handle pattern and the new high means the Silver Miners ETF (SIL) is leading the market. SIL is more volatile than GDX, GLD and SLV, which makes it more prone the wild swings.
Palladium Falls back after Breakout
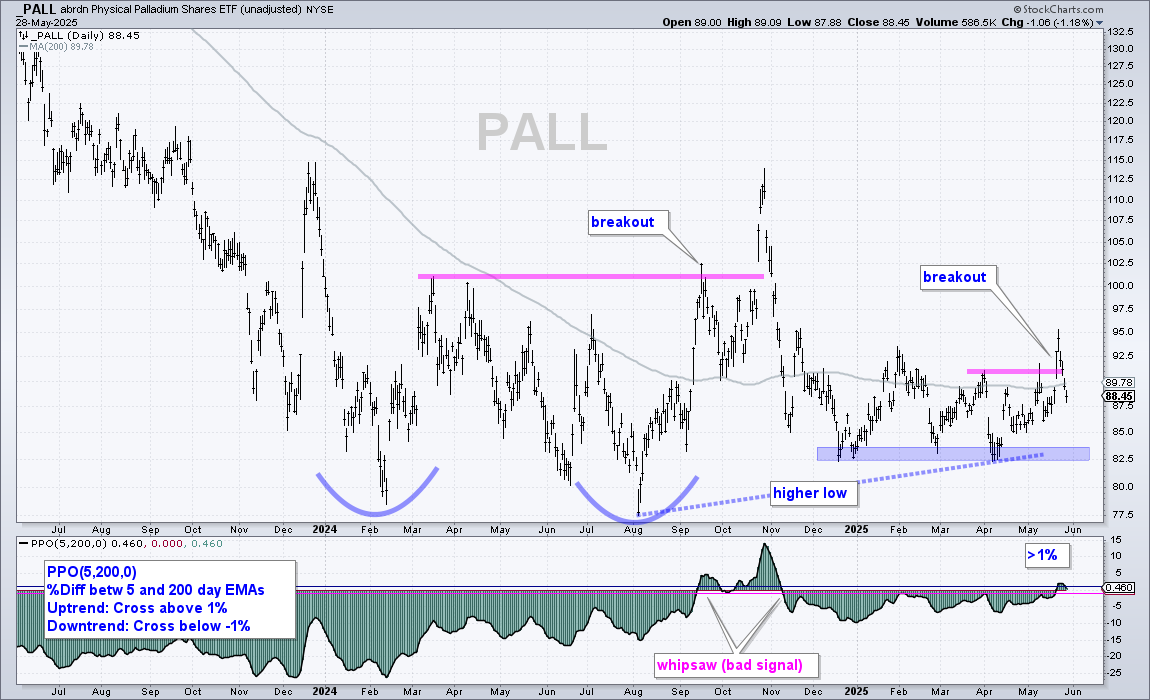
The Palladium ETF (PALL) is bidding to start a new uptrend with a price breakout and PPO signal. PALL surged above resistance in September-October and then held above its 2024 lows on the subsequent pullback. The ETF established support in the 82.5 area from December to April and broke resistance with a surge last week. Despite the sharp four day pullback, I view this breakout as bullish. The indicator window shows the PPO(5,200,0) exceeding 1% to signal an uptrend. This signal remains valid until a move below -1%. As with all trend-following indicators, there will be bad signals (September 2024) and good signals.
Platinum ETF Gets Massive Breakout
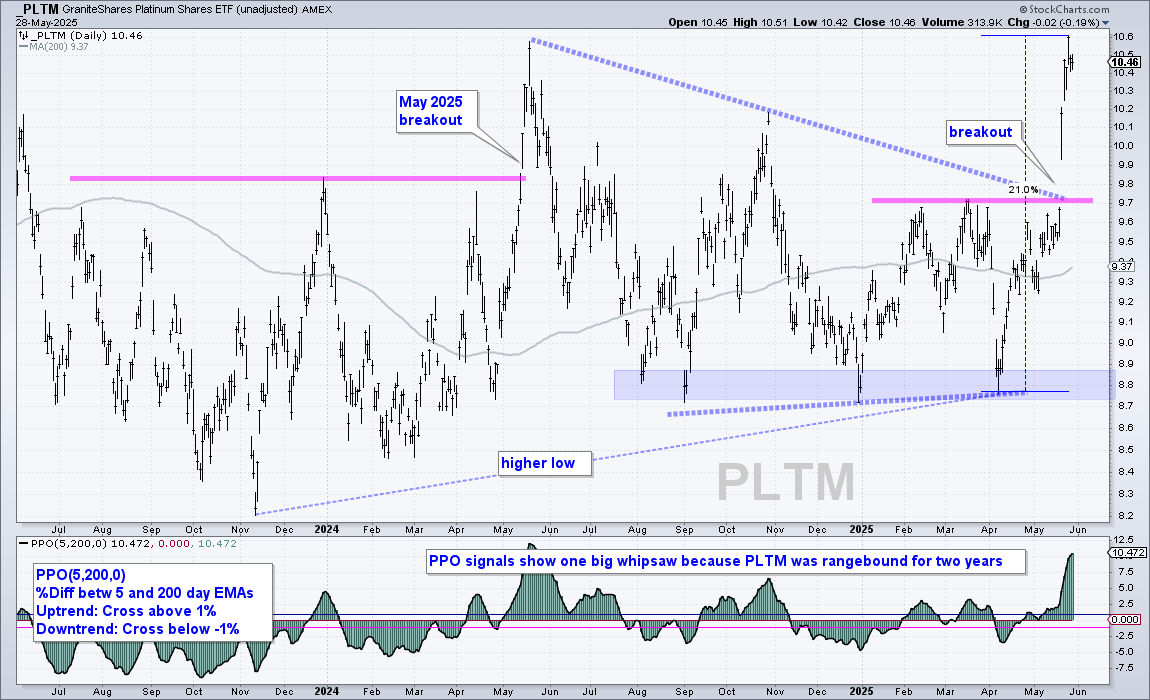
The next chart shows the Platinum ETF (PLTM) with a large triangle consolidation and a breakout at 9.7 last week. This breakout is as impressive as the May 2024 breakout, which failed. We never know ahead of time which breakouts will hold and lead to extended trends, and which will fail. This breakout is bullish until proven otherwise and I would use the 200-day SMA as the re-evaluation level. Chartist not wishing to buy into an overbought situation can watch/wait for a pullback, perhaps to the 9.7-10 area. There are no guarantees here either.
Copper ETF Falls Back after Breakout
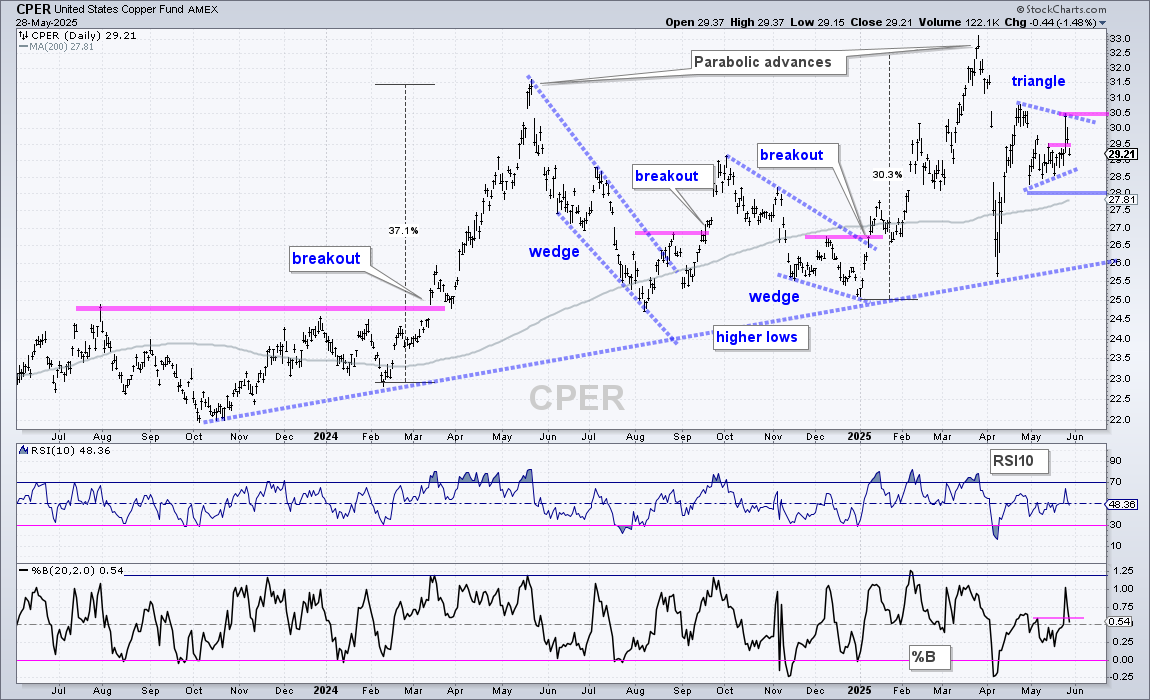
The Copper ETF (CPER) broke pennant resistance with a sharp surge and then fell back to the breakout zone. CPER can be quite noisy and erratic, especially short-term. With the pop and drop, I redrew the triangle lines and set resistance at 30.5, and a breakout here would be bullish. Short-term support remains at 28. Long-term, I still see an uptrend as the ETF trades above the rising 200-day SMA. In addition, CPER forged higher highs from May 2024 to March 2025 and higher lows since February 2024.
Natty Battles Support Zone
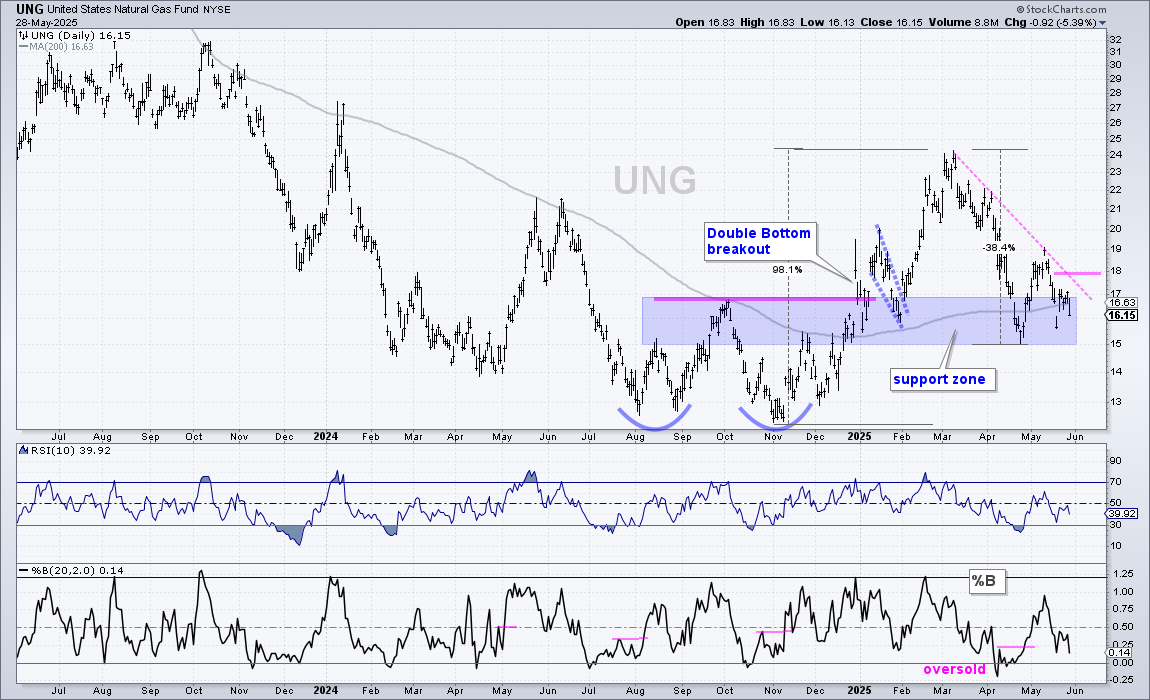
The Natural Gas ETF (UNG) is battling a support zone in the 15-17 area (blue shading). Overall, the ETF broke double bottom resistance with a surge into March and then fell back to the breakout zone. The 200-day SMA is also in this area. There is support here, but UNG cannot get a sustainable bounce. I am marking resistance at 18 and a breakout here would be bullish.
DBA Remains with Uptrend and Breakout
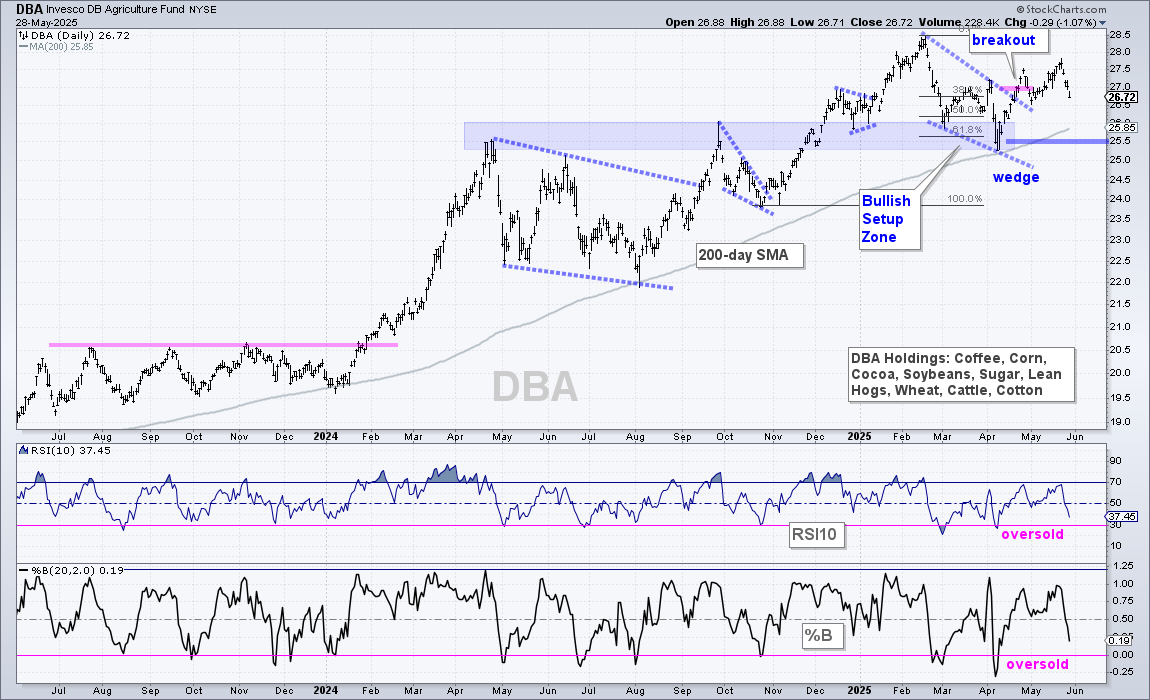
The DB Agriculture ETF (DBA) fell rather sharply the last four days, but remains in a long-term uptrend and with a wedge breakout. The breakout zone in the 26.5 area turns first support that should hold on a pullback. Adding a buffer and accounting for the rising 200-day SMA, I am marking key support at 25.5, a break of which would be bearish.
IBIT Backs off after New High
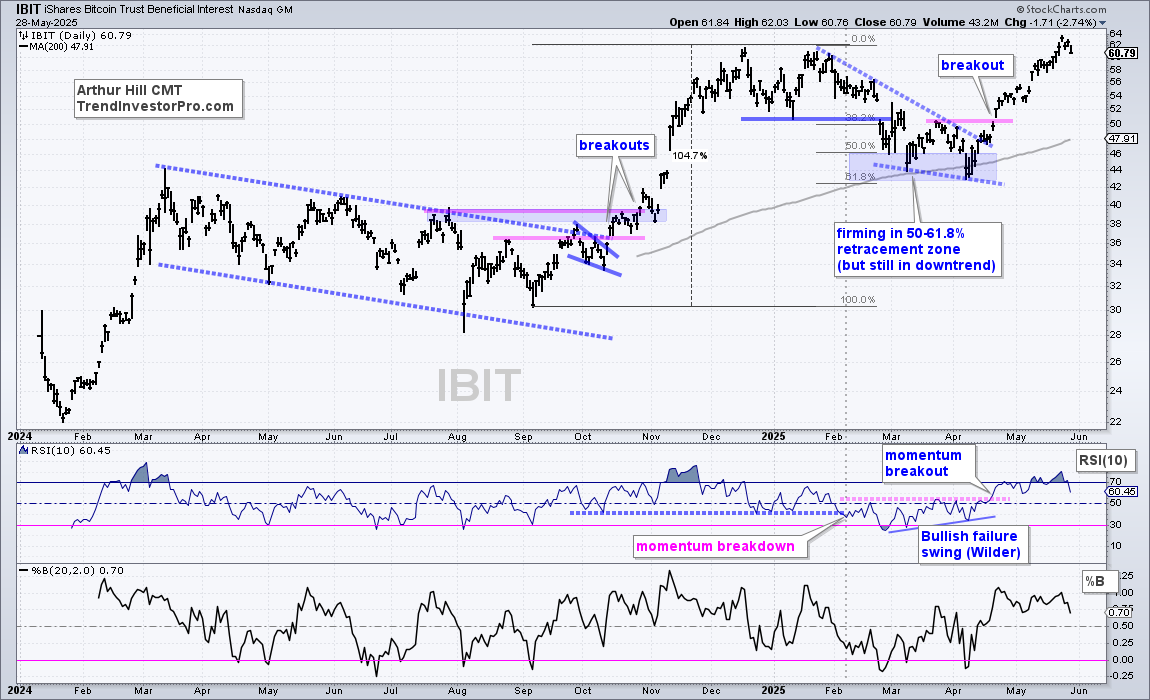
There is no change with the Bitcoin ETF (IBIT). It remains in a post-breakout advance and there is no setup on the chart. The ETF formed a falling wedge into April and then triggered a series of breakouts in mid-late April. IBIT extended to new highs after these breakouts with a 45% gain (mid April to late May). A short-term overbought condition is the only issue right now, and these could lead to a corrective period. Short-term pullbacks, consolidations or oversold readings would be viewed as opportunities.
Send feedback to support(at)trendinvestorpro.com or use the contact form.