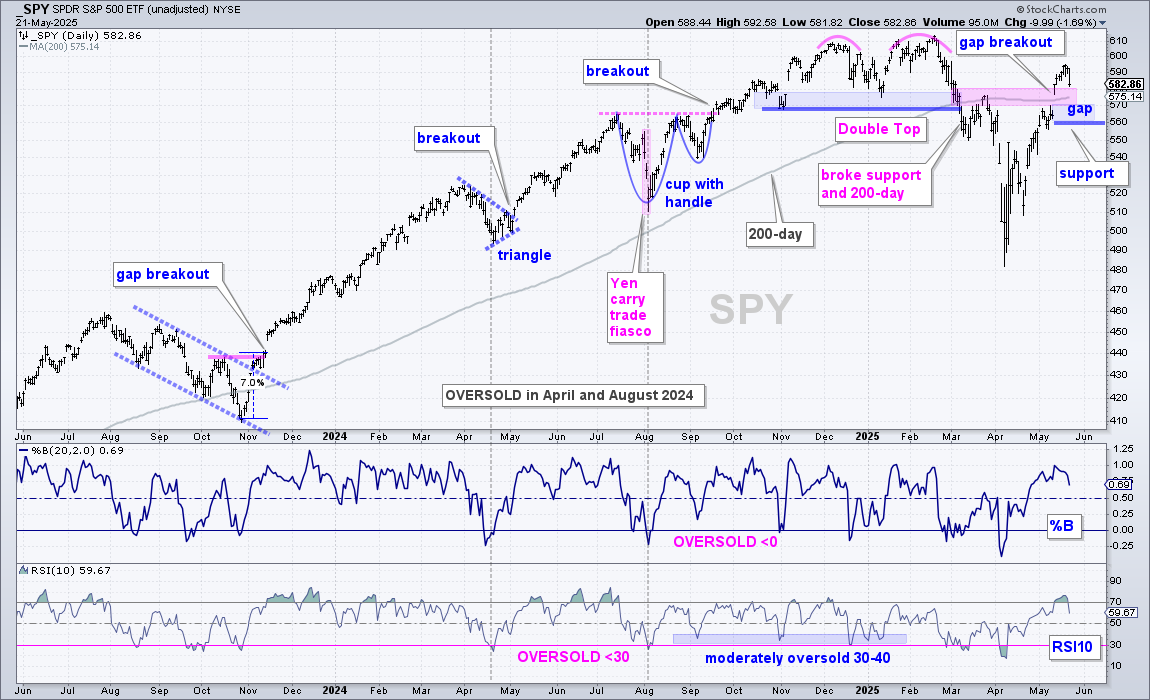
Stocks were hit as SPY fell 1.69%, its largest 1-day decline since April 21st, which was just before the Zweig Breadth Thrust. We do not need to look far for the reasons. First, stocks were short-term overbought after the surge from April 22nd to May 20th. SPY was up over 16% in 20 days. Second, the 30-yr Treasury Yield surged above 5% and hit a new high for 2025. As noted before, long-term Treasury yields were already elevated, they were already in uptrends and these uptrends are extending. Continued strength could provide a headwind for stocks. All eyes are on the gap from May 12th. A strong breakout move should hold. A break below 560 would signal failure.
Mid and Small Caps Still Lagging
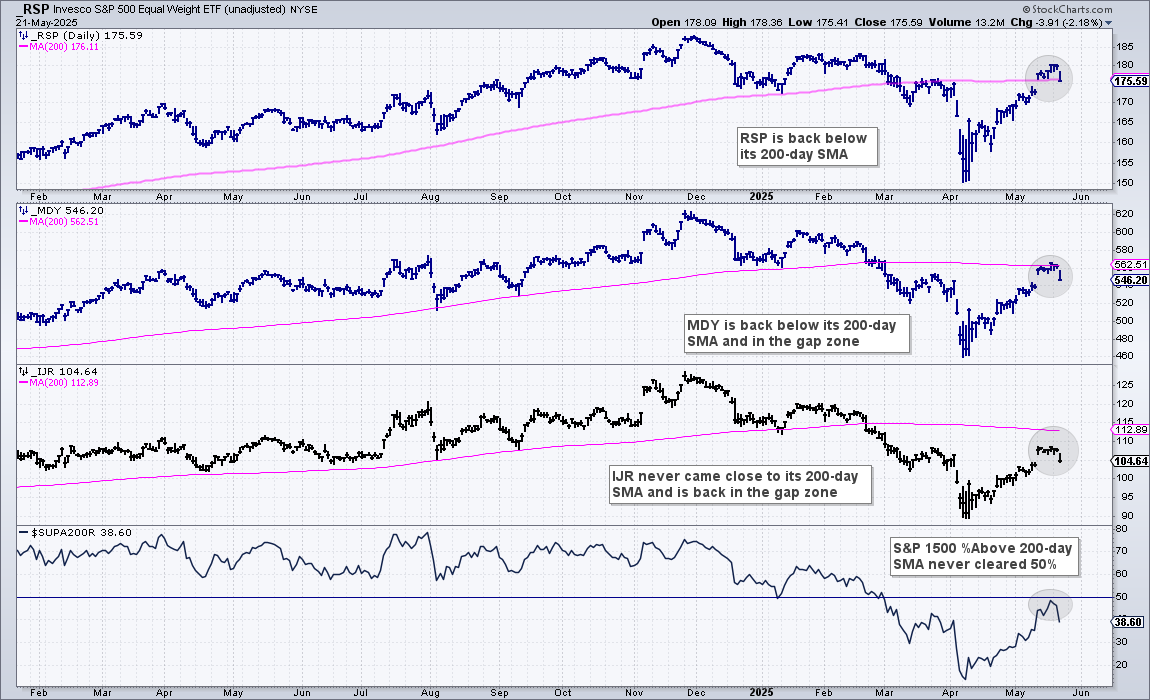
Note at the S&P MidCap 400 SPDR (MDY) and S&P 500 EW ETF (RSP) are already back below their 200-day SMAs. The S&P SmallCap 600 SPDR (IJR) and Russell 2000 ETF (IWM) never came close to their 200-day SMAs. Small-caps were, and are, in long-term downtrends. Also note that just 50% of S&P 500 are above their 200-day SMAs, which means 50% are below. Only 38.4% of S&P 1500 stock are above their 200-day SMAs. From a bull-bear market perspective, this market is split, at best, and still bearish at worst.
TLT Hits 52-week Low as 30yr Surges
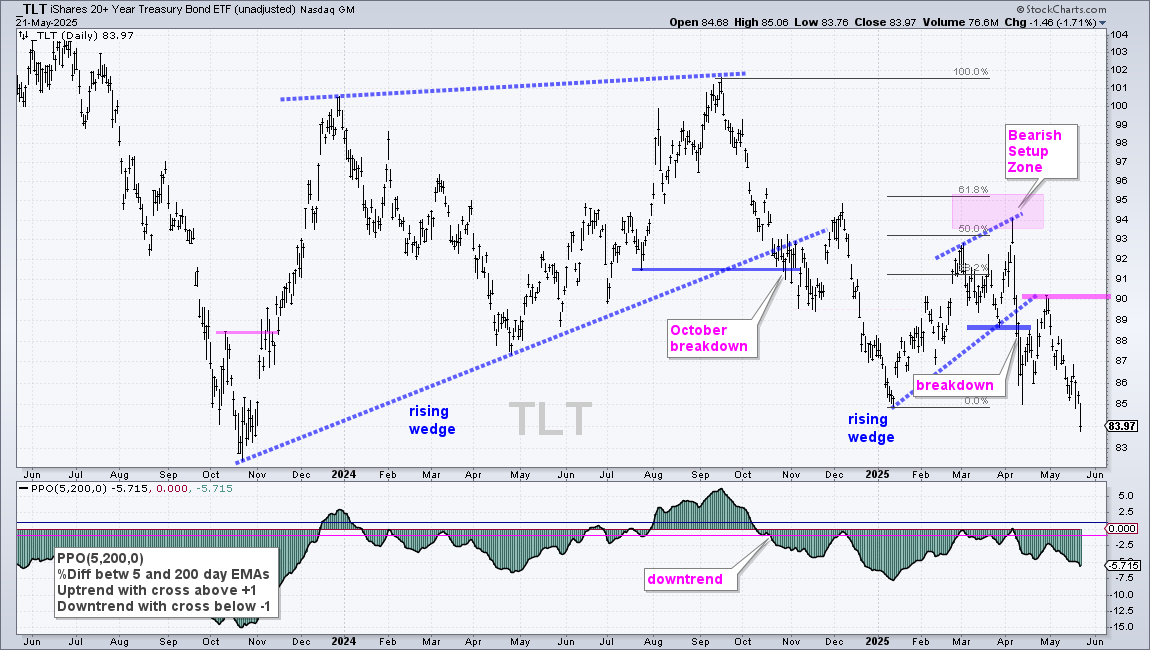
I updated the 20+ Yr Treasury Bond ETF (TLT) chart in Wednesday’s Market Regime update. The outlook was already bearish and remains bearish as TLT fell below its January low. After hitting a 52-wk low in early January, TLT rose into early April and then broke down on Liberation week. There was a sharp bounce back to 90 and then a sharp decline in May. The late April high at 90.21 marks resistance going forward. The bottom window shows the PPO(5,200,0) dipping below -1% in October and remaining in bear mode since this bearish trend-following signal. A break above +1% would be bullish.
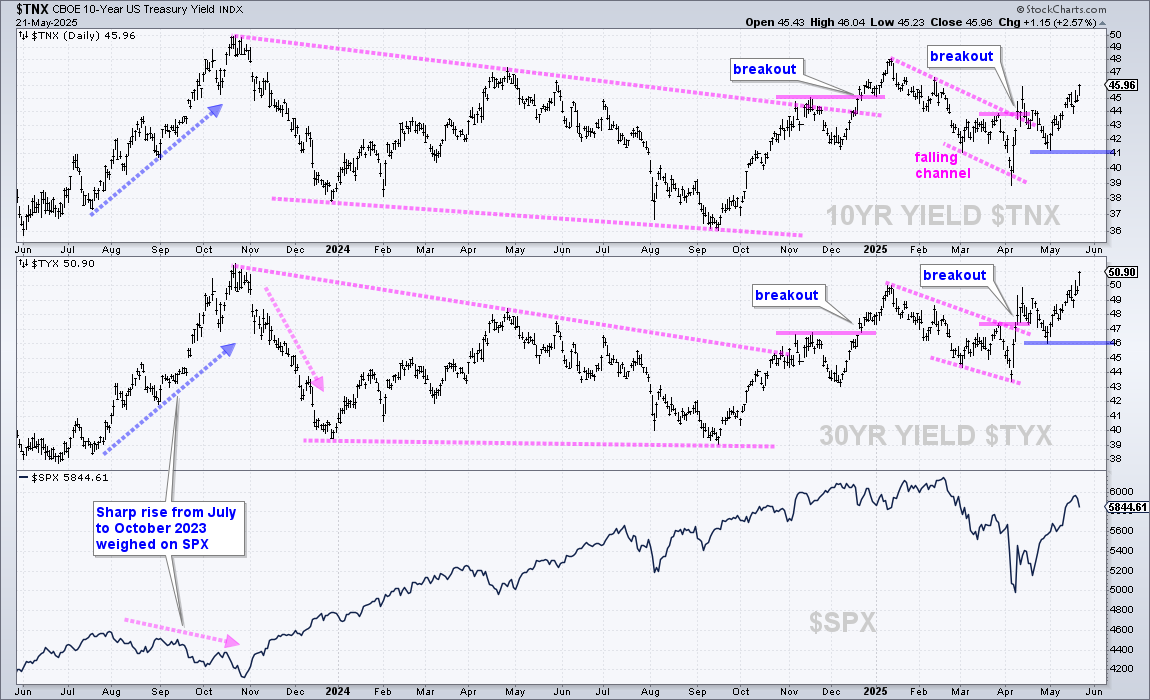
The next chart shows the 10-yr Treasury Yield ($TNX) and 30-yr Treasury Yield ($TYX) with mirror images of TLT. Both broke out in early April, fell back into late April and then surged in May. The 30yr moved above 5% and hits its highest level since October 2023. These yields are rising from high levels and could provide a headwind for stocks. Notice how the steep rise from July to October 2023 weighed on stocks. Stocks then surge in early November as yields fell sharply.
GLD, Silver and Gold/Silver Miners Surge
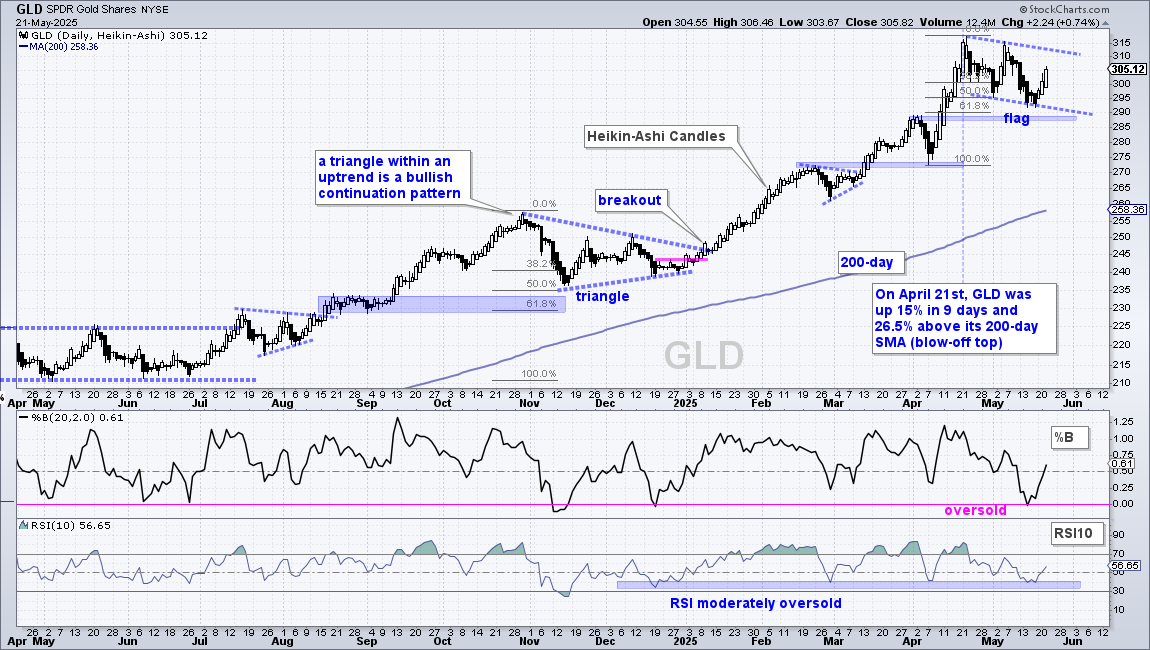
The Gold SPDR (GLD) price chart is quite “gappy” so I am showing Heikin-Ashi Candlesticks. These candlesticks combine price action from the last two periods (days). This removes most of the gaps. GLD surged from 275 to 315 in mid April to become extremely overbought on April 21st. The ETF worked off these overbought conditions with a pullback the last four weeks as a falling flag formed. Note that this flag retraced 50-61.8% of the prior advance and found support just above broken resistance (blue shading). GLD also became oversold last week as %B dipped below 0 and RSI(10) dipped to the 40 area. The ETF turned up with the last three candlesticks this is the first sign that GLD will challenge the flag line. Note that falling flags are short-term bullish continuation patterns and a breakout would open the door to new highs.
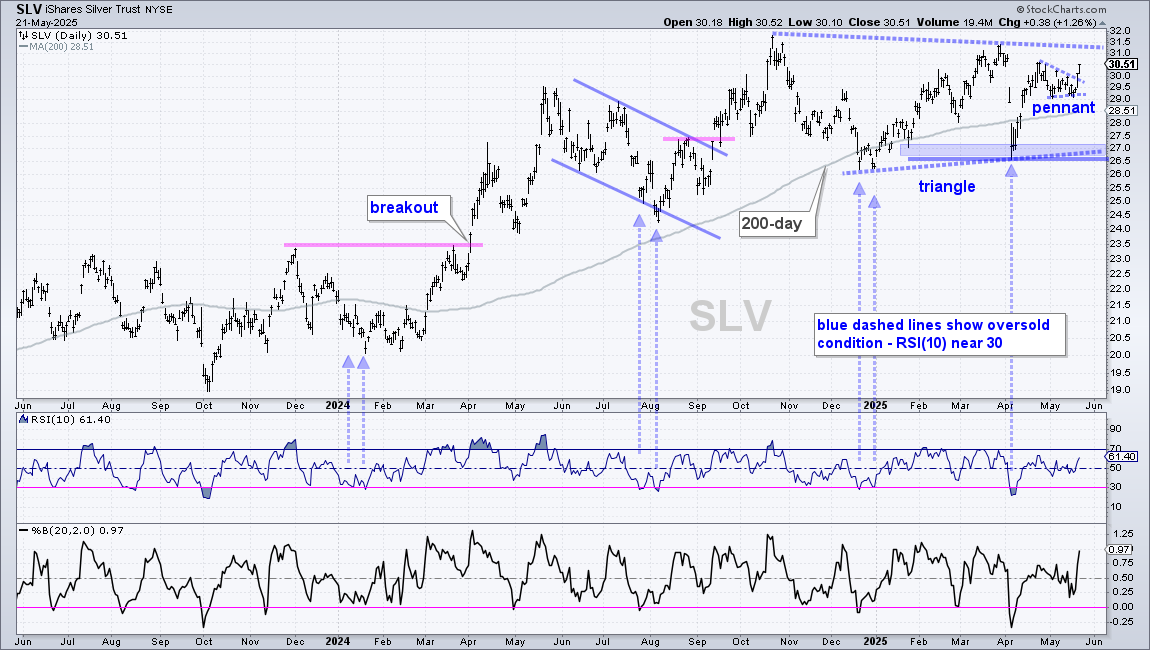
The next chart shows the Silver ETF (SLV) with a large triangle forming. I view this as a large consolidation within a long-term uptrend, which makes it a bullish continuation pattern. SLV is above the rising 200-day SMA. A breakout at 31.5 would be long-term bullish. Short-term, SLV surged in mid April, formed a small pennant into May and broke the pennant line with a surge the last two days. This is the first sign that SLV would challenge triangle resistance. A close below the 200-day would call for a re-evaluation.
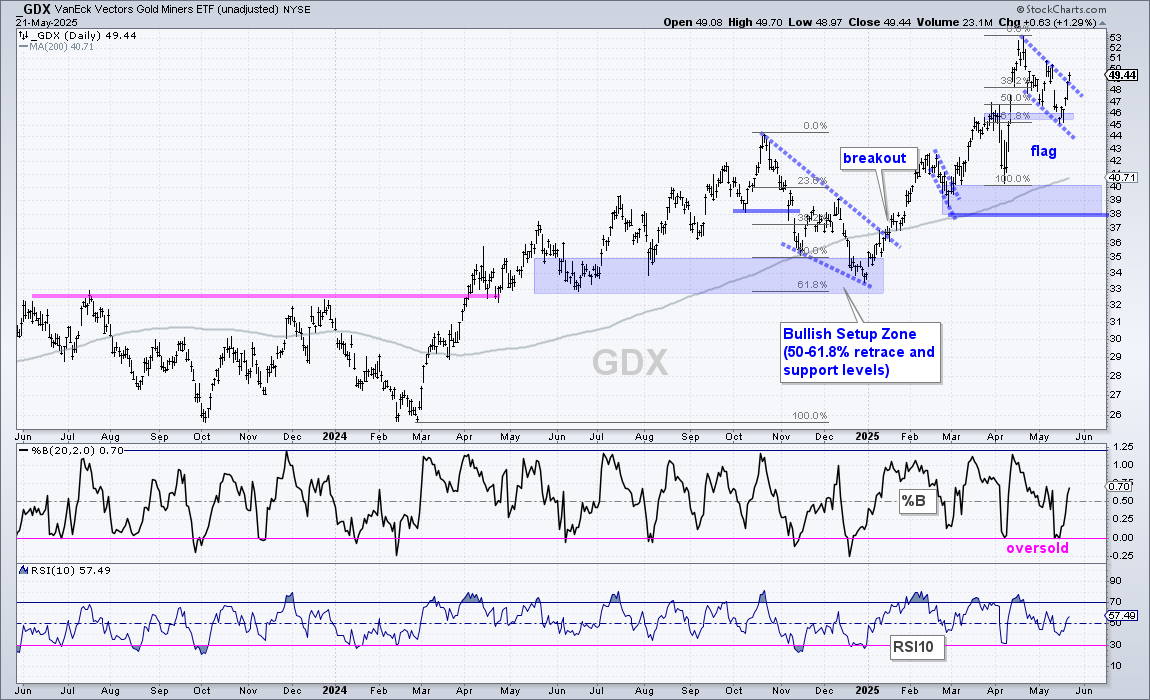
The next chart shows the Gold Miners ETF (GDX) with a flag breakout the last two days.
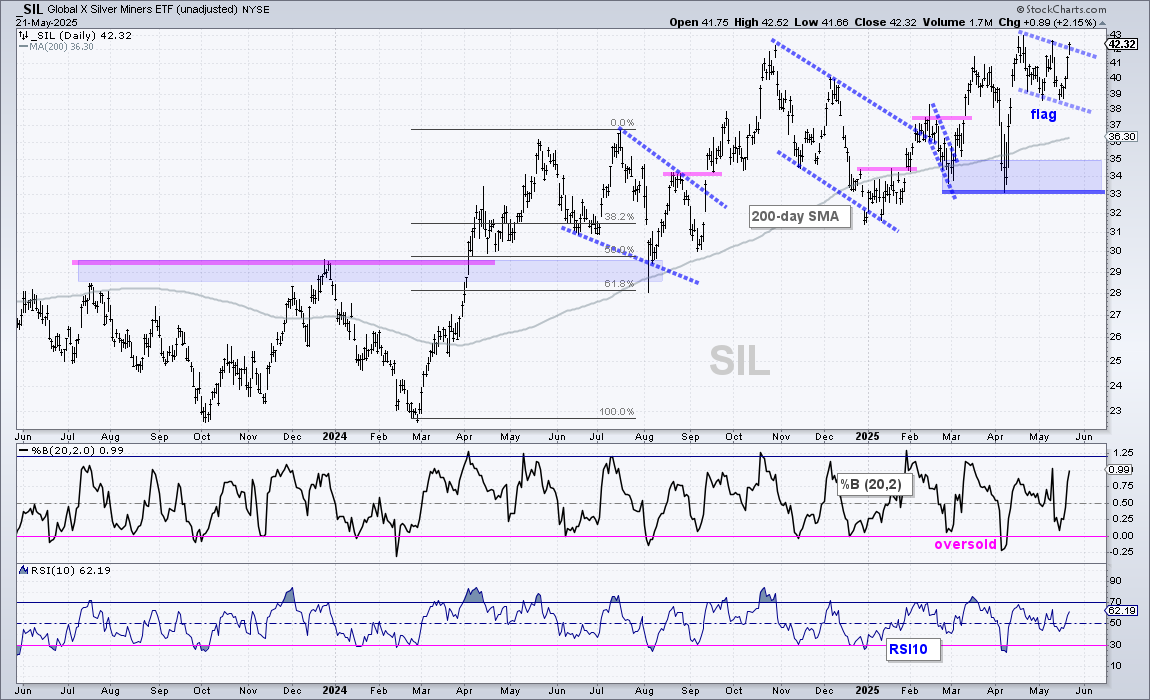
The next chart shows the Silver Miners ETF (SIL) with a flag breakout.
Copper Coils Up after April Surge
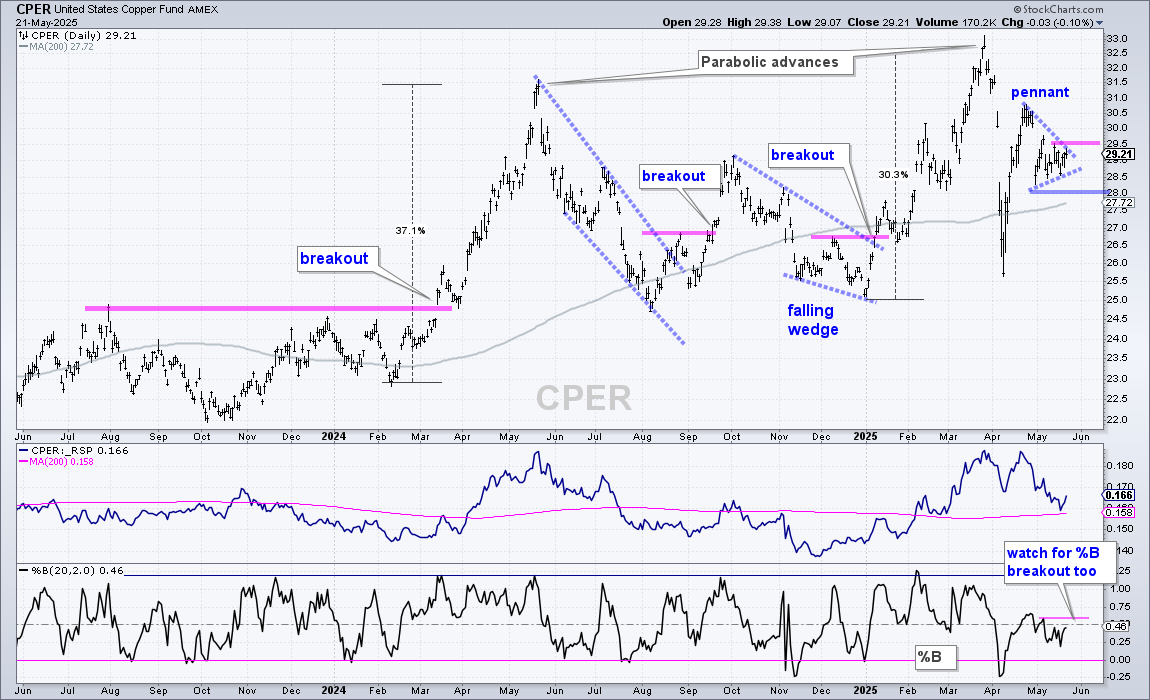
The Copper ETF (CPER) is in a long-term uptrend, but this is a very volatile uptrend. Note the two parabolic advances (37% and 30%) and the subsequent declines (>20%). Overall, I still see higher highs from May 2024 to March 2025 and higher lows in August, January and April. In addition, the 200-day SMA is largely rising. Most recently, CPER surged in mid April and then consolidated with a pennant or small triangle. I view this as a consolidation after a sharp advance, which makes it a bullish continuation pattern. A close at 29.5 would trigger a breakout and signal a continuation of the mid April surge. I would then mark re-evaluation support at 28.
DB Agriculture ETF Extends on Breakout
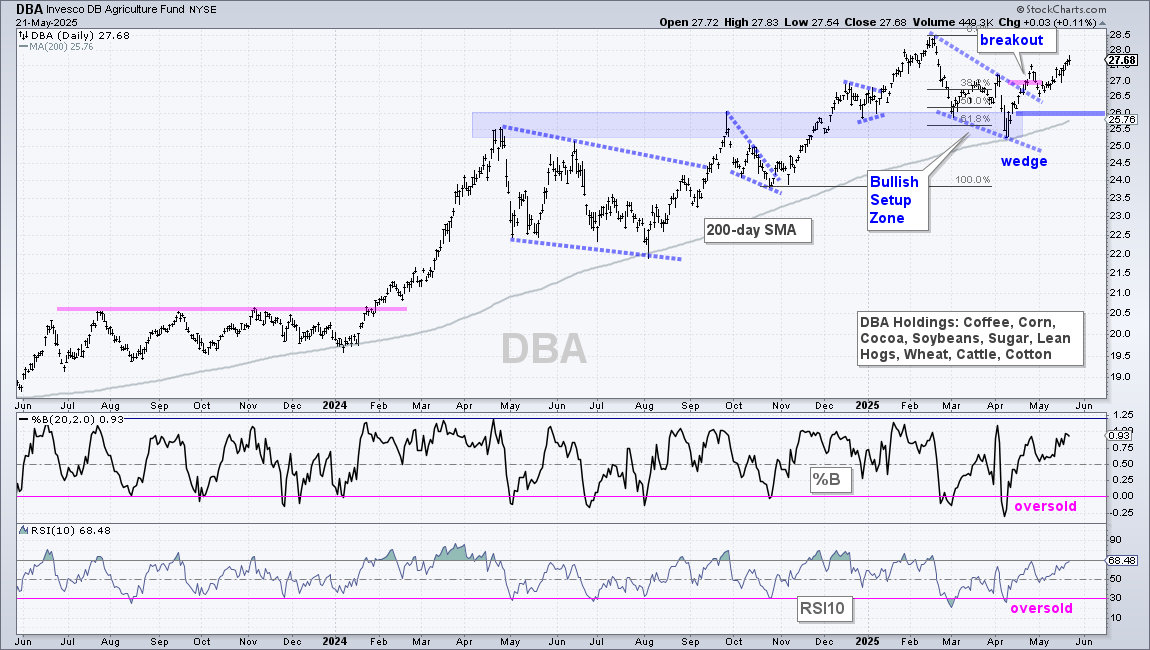
There is no change in the DB Agriculture ETF (DBA) as it extends on its late April breakout. Overall, DBA is in a long-term uptrend with a 52-week high in February. The ETF corrected with a falling wedge that retraced around 61.8% of the prior advance and returned to the rising 200-day SMA. This was a correction within the bigger uptrend, which is an opportunity, not a threat. There was also support from broken resistance in this area (blue shading). DBA broke out in late April, fell back for four days and then continued higher. This breakout remains bullish and new highs are expected. A close below 26 would argue for a re-evaluation.
IBIT Tags a New High
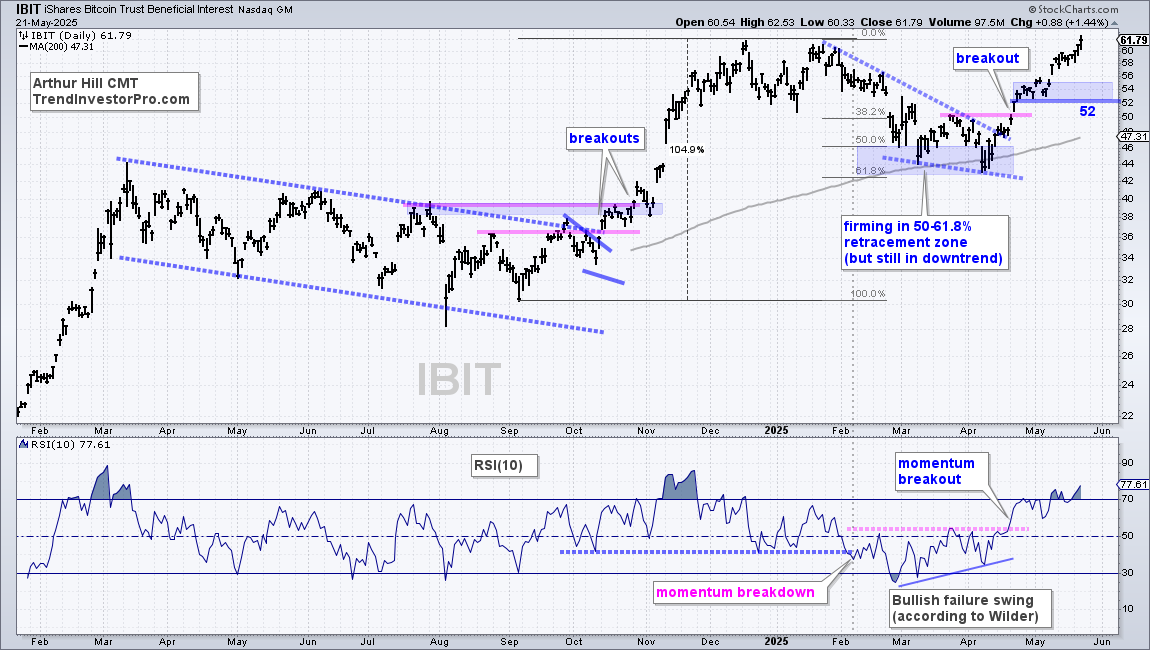
There is no change in the Bitcoin ETF (IBIT) as it extends on its late April breakout. As noted in mid April, IBIT was setting up as a falling wedge retraced around 61.8% of the prior advance and returned to the 200-day SMA. An RSI bullish failure swing also formed. We can then see a progression of signals as IBIT broke the wedge line, broken resistance (pink line) and RSI broke out. There was a short stall in the 52-54 area in late April and early May. I am using these lows to mark re-evaluation support at 52.
Indicators for Trailing Stops
Exits are perhaps the hardest part of any trade. Chartists can consider profit targets, tailing stops or trend reversals. Another option is to close part of the position and book partial profits. For example, close half and then set a trailing stop to ensure that the entire position does not devolve into a loss. The key is to plan your trade ahead of time and trade that plan!
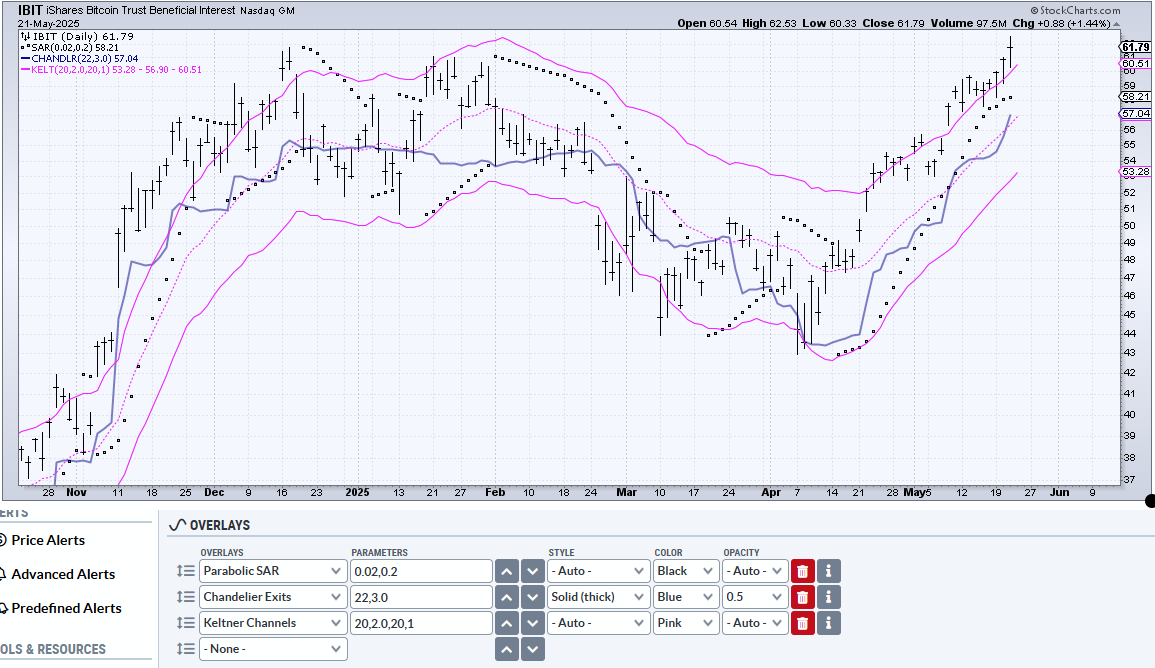
This next chart shows IBIT with three possible trailing stops. The solid blue line is the Chandelier Exit (22,3), which is 3 ATR(22) values below the 22-day high. This stop rises as long as IBIT records higher highs. The dotted line is Parabolic SAR (0.02, 0.2), which was developed by Welles Wilder, creator of RSI. The formula is quite complex and you can read more in this ChartSchool article.
The third option is the Kelter Channel (20,2.0,20,1), The lower line is 2 ATR(20 values below the 20-day EMA. Keltner Channels rise as long as the 20-day EMA rises. This means the lower line acts as a trailing stop. The last parameter (1) shifts the indicator one day forward, which means the current value actually the value for the prior period. A close below the lower would trigger an exit. This is the widest stop and the most likely to hold should this trend extend several months. In other words, this stop will absorb a mild pullback.
Send feedback to support(at)trendinvestorpro.com or use the contact form.