Stocks are in the midst of an oversold bounce, but the weight of the evidence remains bearish. Among other items, I am watching the Zweig Breadth Thrust for signs of a bullish signal that would prove my bearish stance wrong. We have yet to see a thrust signal, which means more follow through it needed.
Stocks broke down with deep declines into mid March (11-13). These deep declines led to short-term oversold conditions, which primed the pump for the current bounce. At this point, I consider this an oversold bounce, as opposed to a bullish thrust that turns the evidence bullish. We need to see strong follow through to go from oversold bounce to bullish thrust.
Overall, commodity and defensive ETFs are leading here in 2025. Today’s report focuses on the leaders that are in uptrends and showing relative strength. Many were setting up bullish in mid March and broke out over the last week or two.
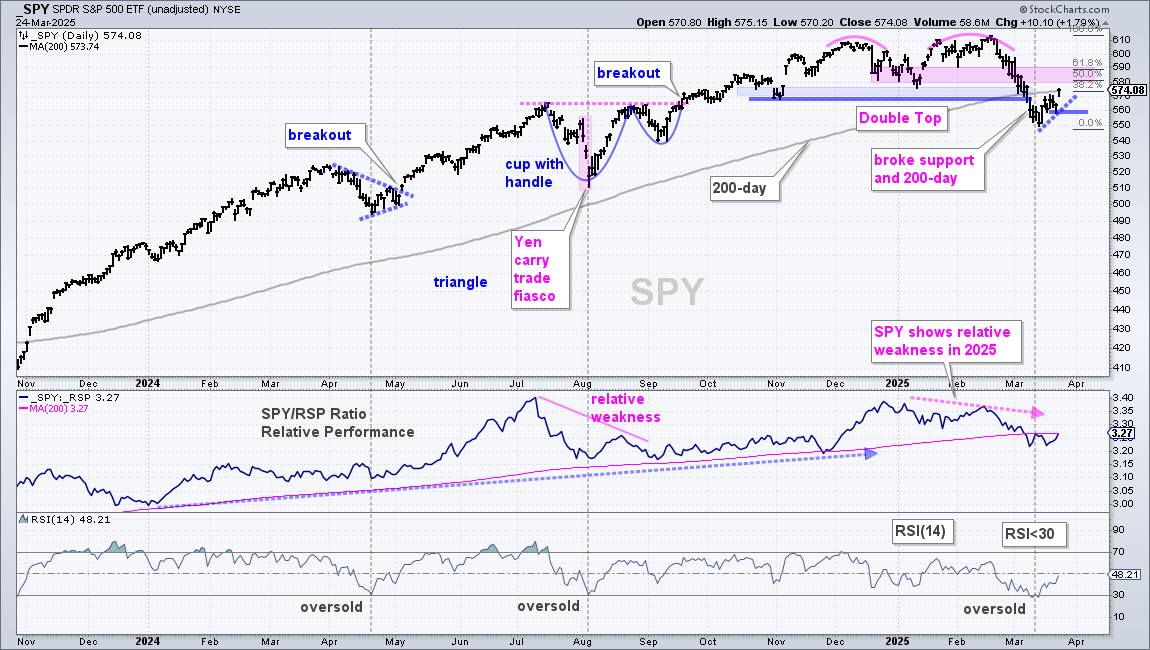
SPY broke Double Top support and the rising 200-day SMA with a sharp decline into early March. These are the breaks that broke the bull’s back as the breadth indicators turned net bearish. SPY became oversold as RSI dipped below 30 on March 11th and 13th. The S&P 500 Zweig Breadth Thrust indicator also became oversold on March 13th. Oversold conditions set the stage for a bounce, which we are seeing as SPY moved back above its 200-day SMA on Monday. I consider this an oversold bounce within a bigger downtrend because the weight of the longer term evidence is bearish. The pink shading marks prior lows (support) that turn into the next resistance zone in the 580-590 area. The 50-61.8% retracements are also in this area.
As noted last week, the 200-day SMA is often a battle zone with downside breaks occurring during periods with higher volatility. This means we could see more than one cross in the coming days/weeks. For example, SPY broke its 200-day on 21-January-2022 and then crossed this key moving average at least six more times from late January to mid April 2022. SPY broke its 200-day SMA on March 10th and closed back above it on March 24th.
QQQ Leads Oversold Bounce
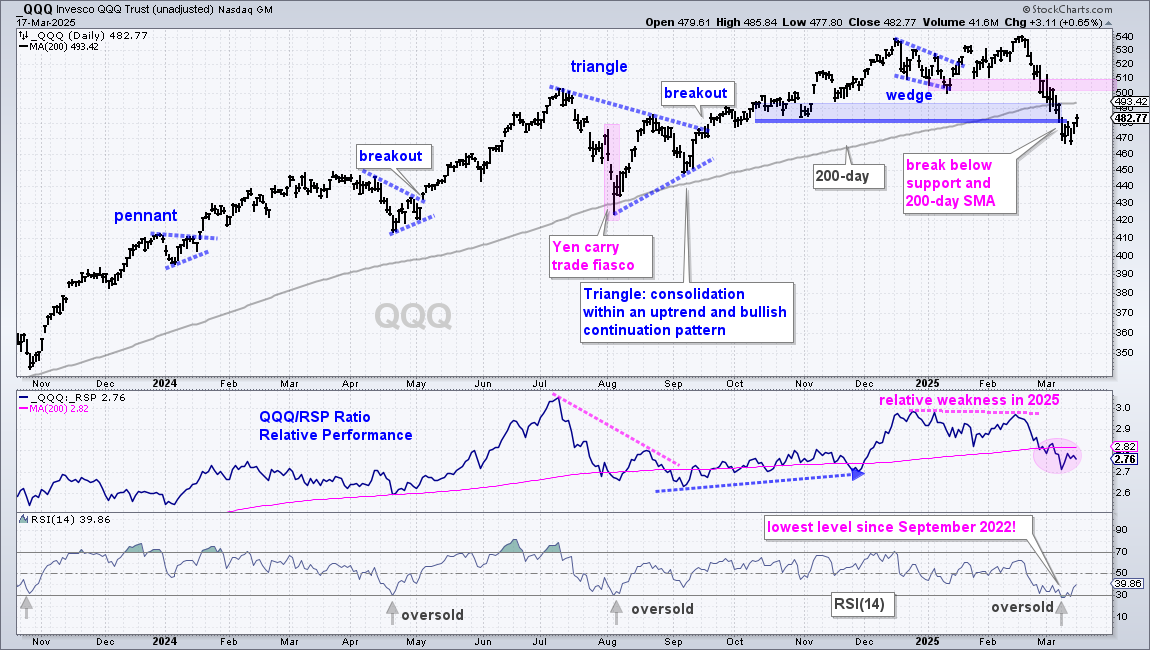
QQQ led on the way down and also on the oversold bounce. This is often the case. Names hit the hardest during a decline experience bigger oversold bounces. QQQ fell some 14% from its late February high and then surged 5% from its mid March low. Note that QQQ broke the 200-day SMA and support zone during this decline. Thus, the longer-term damage was done. Short-term, QQQ reversed its slide with a breakout at 485 and I am marking the next resistance zone in the 500-510 area. This zone stems from prior supports, which turn into resistance. The 50-61.8% retracements are also in this area.
RSP Bounces off Bullish Setup Zone
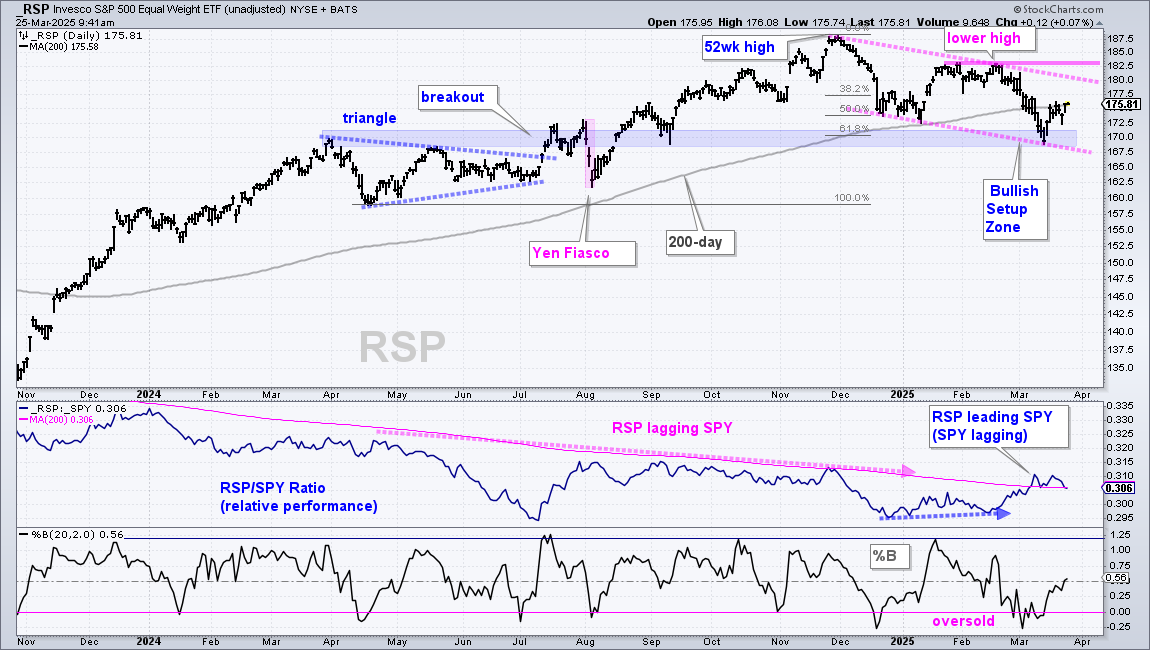
The S&P 500 EW ETF (RSP) hit the Bullish Setup Zone in mid March and got an oversold bounce with the rest of the market. Despite this bounce, the immediate trend is down with a lower high in February and a lower low in March (pink lines). A break above the February highs is needed to reverse this downtrend.
XLK Extends on Oversold Bounce
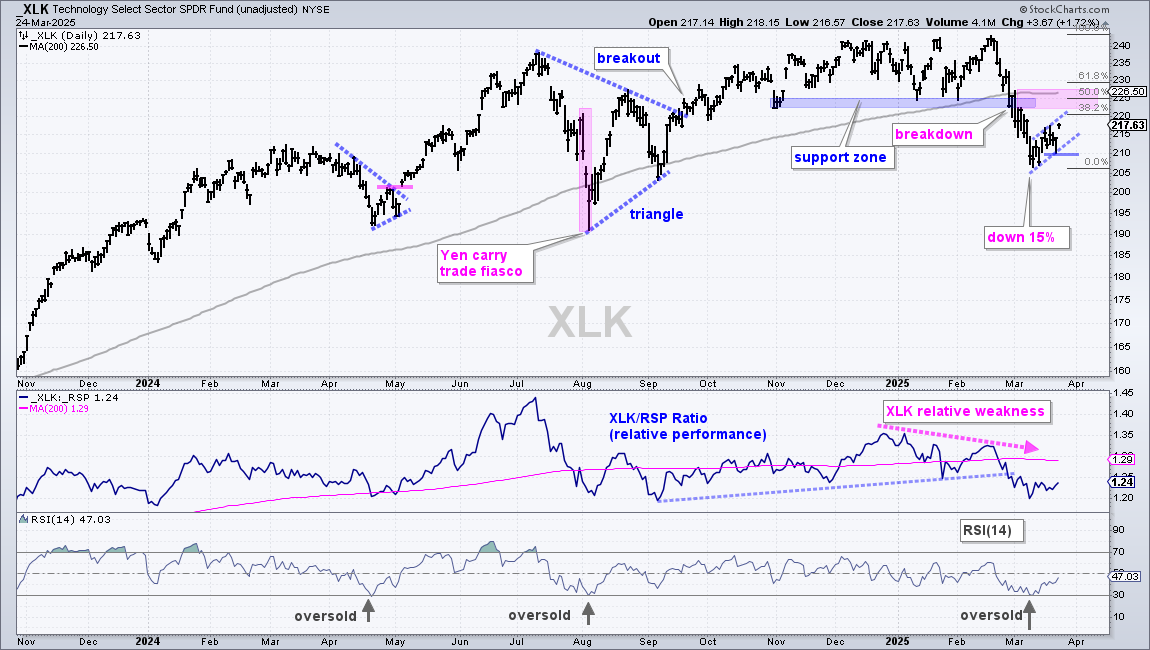
The Technology SPDR (XLK) shows a breakdown, oversold condition and bounce. This is a pretty common sequence on the charts right now. First, XLK broke support and the 200-day SMA with a 15% decline into mid March. This outsized decline reversed the long-term uptrend and XLK is now in a long-term downtrend. Second, XLK became short-term oversold with the 15% decline and was ripe for an oversold bounce. This is the double-edged sword of technical analysis: the long-term breakdown created a short-term oversold condition for a bounce. Third, XLK is getting that bounce with a 5% advance off the mid March low. Perhaps a bear flag is taking shape here with support at 210. A break here would reverse the upswing. For next resistance, we have broken support turning resistance and the 50% retracement in the 220 area (pink shading).
Top Performing ETFs in 2025
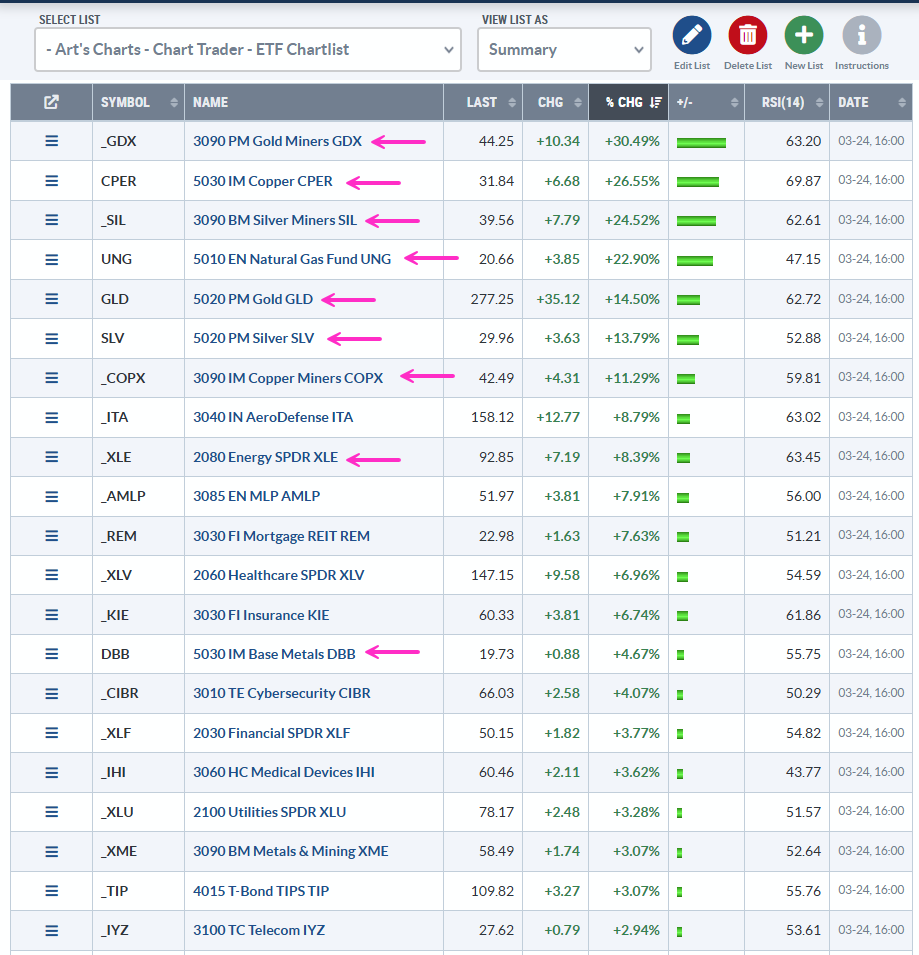
The table below shows some of the top performing ETFs year-to-date. Three themes are present. First, commodity-related ETFs are performing well. Gold Miners (GDX), Copper (CPER), Silver Miners (SIL), Gold (GLD), Silver (SLV) and Copper Miners (COPX) are in the top ten (pink arrows). Second, the leading equity ETFs are defensive and reflect risk-aversion in the stock market. These include Aerospace-Defense (ITA), MLPs (AMLP), Healthcare (XLV), Insurance (KIE), Medical Devices (IHI), Utilities (XLU) and Telecom (IYZ). Third, there is only one tech-related ETF: the Cybersecurity ETF (CIBR).
2025 leaders show a preference for hard assets and defensive stocks (risk off). This is also reflected in the Market Regime charts because the weight of the evidence is bearish for stocks. The ETFs featured below fit with the defensive theme in the market.
XLV Maintains 2025 Upswing
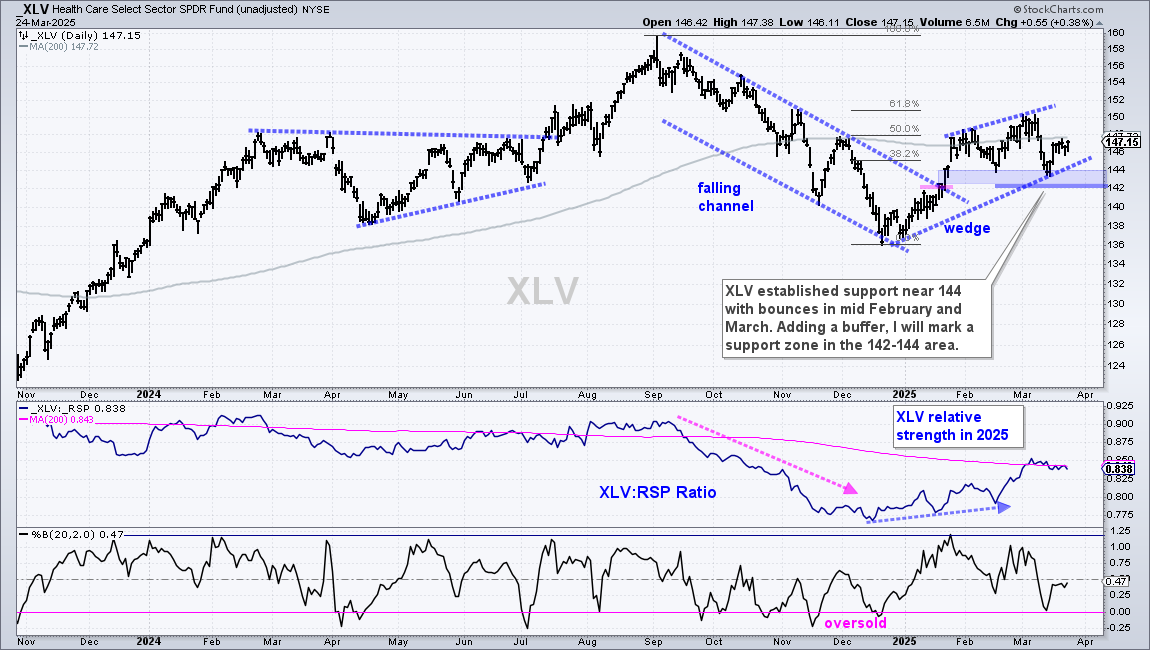
The Healthcare SPDR (XLV) is now the second strongest sector year-to-date (+6.96%) because the Energy SPDR (XLE) takes top honors (+8.39%). On the price chart, XLV broke out of a falling channel with a surge in mid January and the breakout zone is holding (blue shading). A rising wedge is taking shape this year and the trend is up as long as this wedge rises. The February-March lows mark a support zone in the 142-144 area. A close below 142 would reverse the uptrend.
XLF and XLC Hold Above Rising 200-day SMAs
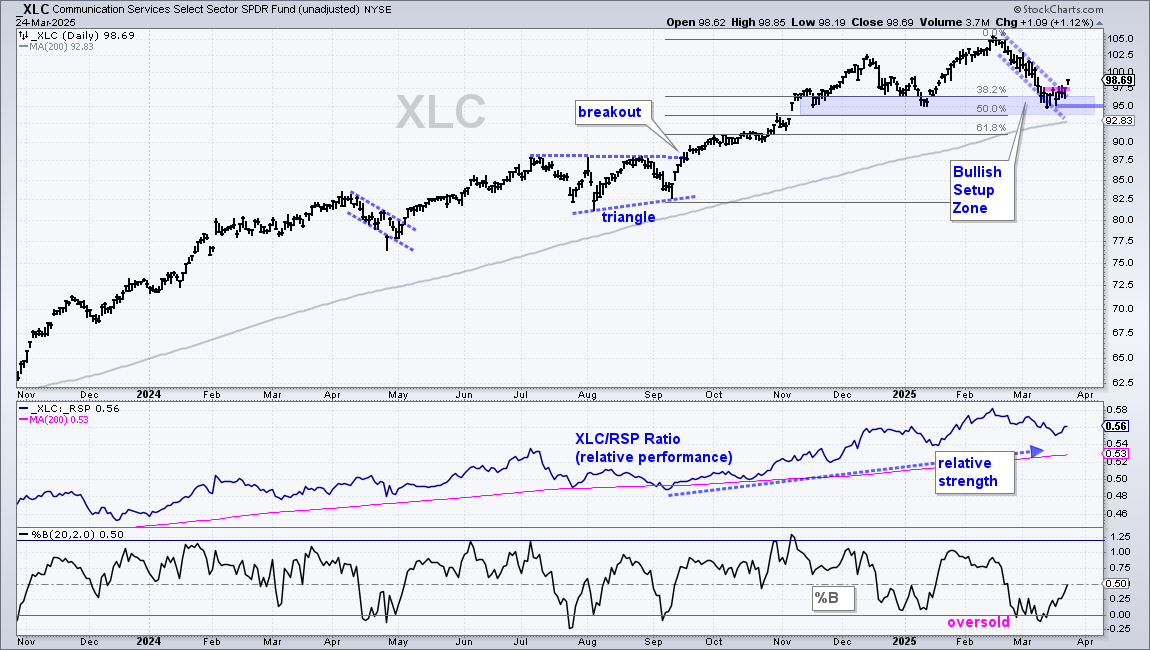
The Finance SPDR (XLF) and the Communication Services SPDR (XLC) held up better than the broader market because they did not break their 200-day SMAs. They are also in leading uptrends with new highs in February. The first chart shows XLC hitting a new high and falling back to the January lows. This decline also retraced around 50% of the September-February advance. Thus, we have a Bullish Setup Zone in the 95 area (blue shading). XLC firmed in this area and broke short-term resistance with a pop on Monday. Re-evaluation support is set at 95.
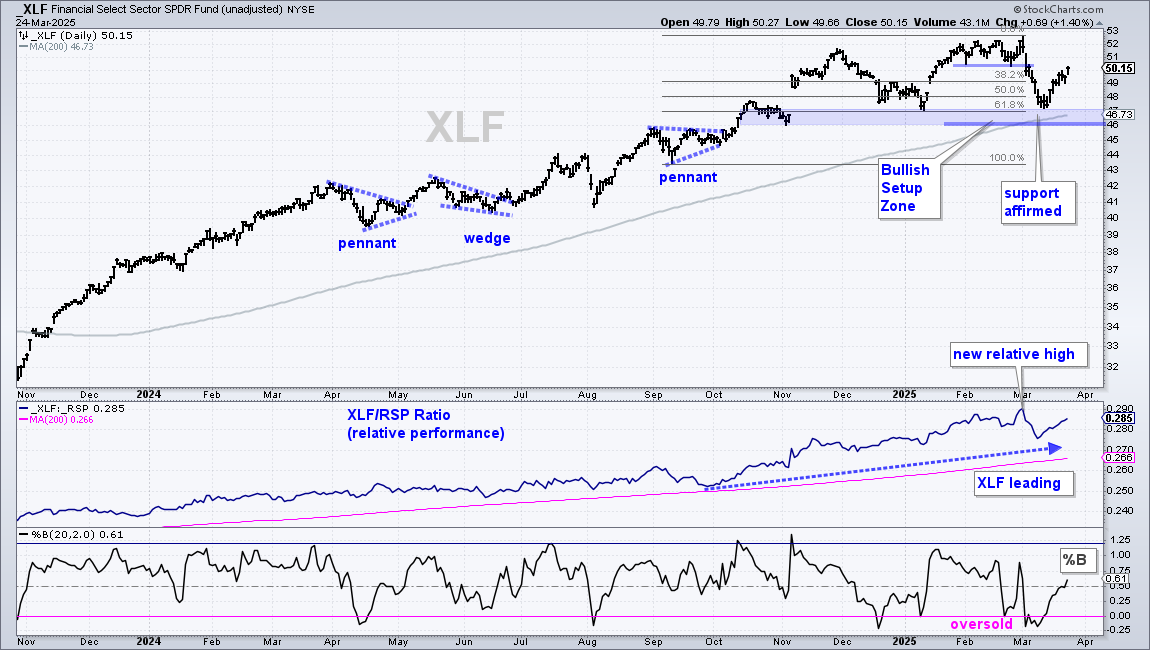
The next chart shows the Finance SPDR (XLF) tagging a new high in early March and then falling sharply into mid March. The ETF ultimately firmed at the January low and held above its rising 200-day SMA. Also note the 61.8% retracement at 47. Overall, XLF hit a Bullish Setup Zone and became oversold in early-mid March as %B dipped below zero. The bounce over the last seven days reinforces support in the 46-47 area (blue shading) and keeps the long-term uptrend alive. XLF is also leading as the price-relative (XLF/RSP ratio) hit a new high at the beginning of March and remains in an uptrend.
AIQ Reverses Near Bullish Setup Zone
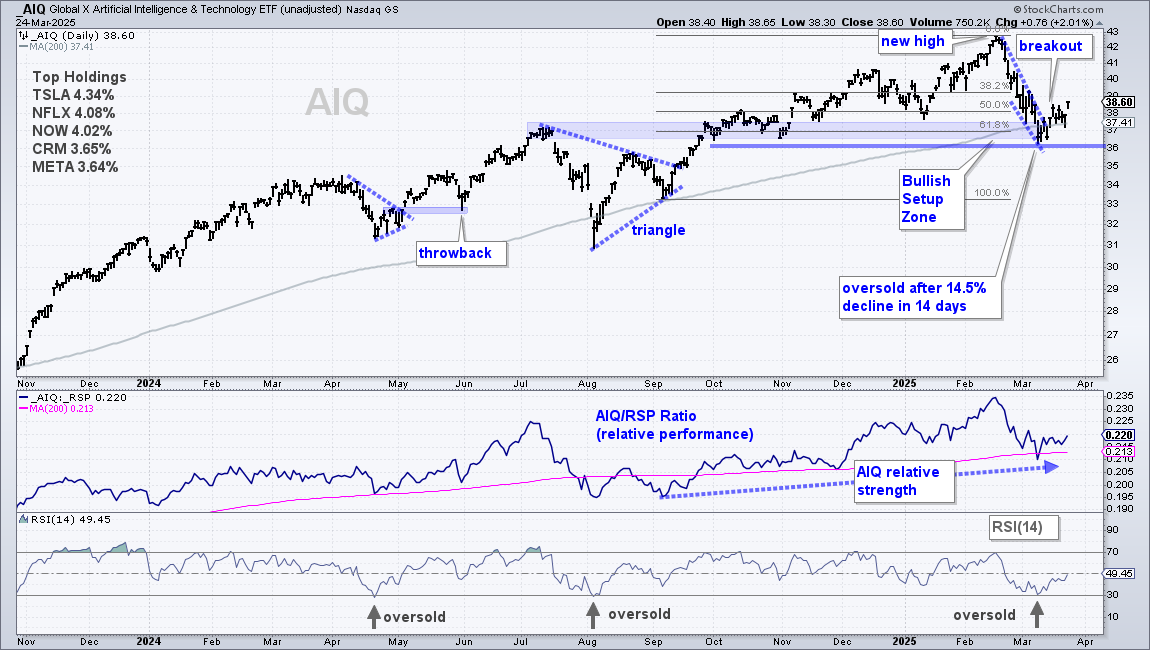
The Global AI & Tech ETF (AIQ) stood out because it held up better than the Technology SPDR this year. AIQ is flat year-to-date, while XLK is down 6.4% in 2025. Also note that AIQ a hit Bullish Setup Zone in mid March (blue shading). Broken resistance, the 200-day SMA and the 61.8% retracement mark this zone. AIQ also became oversold as RSI(14) hit the 30 area. The combination of oversold conditions and a Bullish Setup Zone gave way to an oversold bounce as AIQ broke out of a steep falling wedge. AIQ also reclaimed its rising 200-day SMA. I will mark re-evaluation support at 36.
CIBR Reverses Short-term Slide with Breakout
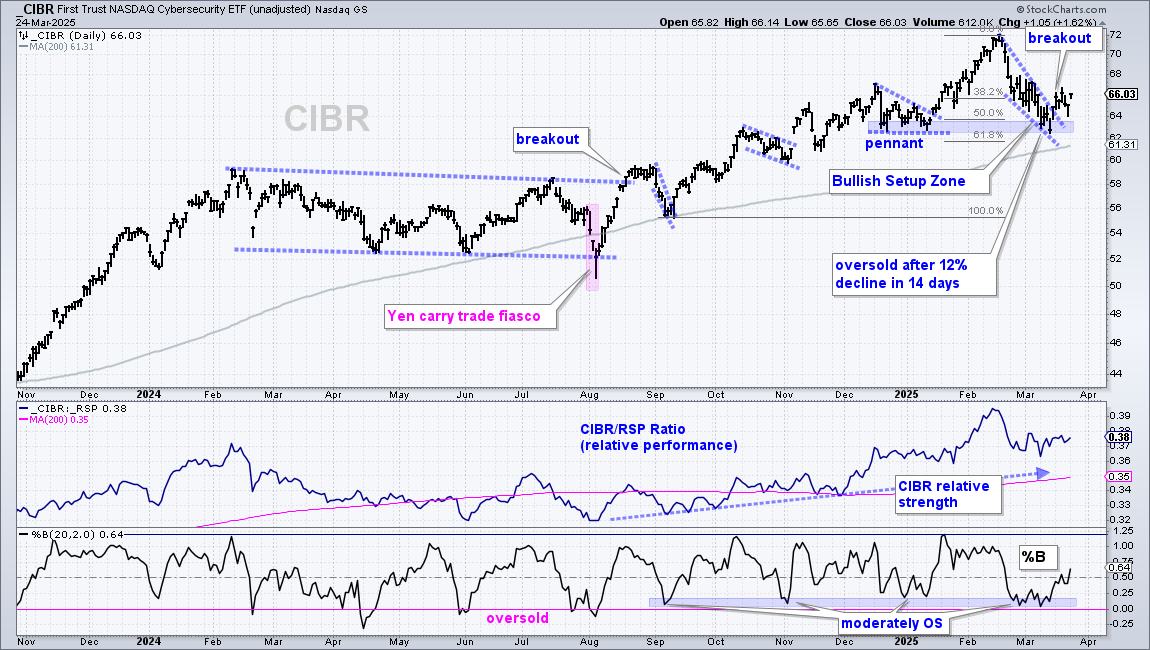
The Cybersecurity ETF (CIBR) is the strongest of the tech-related ETFs in my universe because it is the only one that held above the 200-day SMA and it sports a year-to-date gain (+4%). After hitting a new high, CIBR fell back to the January lows with a steep falling wedge. I view this as a correction within a bigger uptrend because CIBR held above the rising 200-day SMA. The ETF fell to the Bullish Setup Zone (blue shading) and reversed the short-term slide with a breakout last week. The middle window shows the price-relative (CIBR/RSP) in a long-term uptrend, which means CIBR shows relative strength.
KIE Works its Way Higher After Breakout
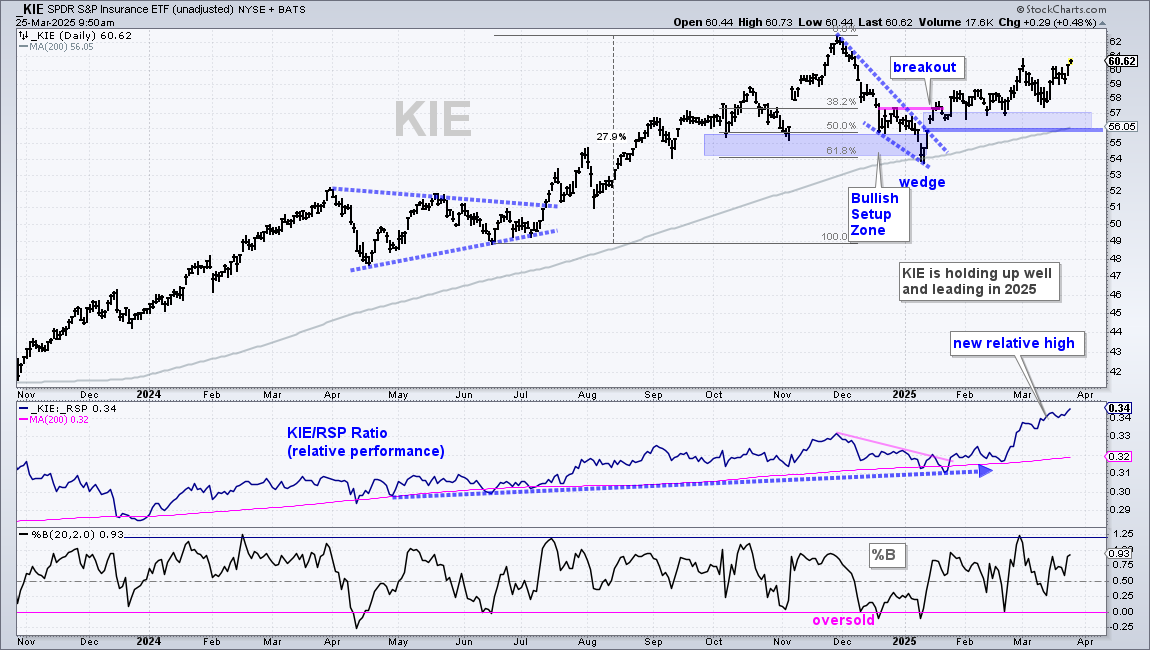
The Insurance ETF (KIE) is not the most exciting, but the ETF is in a leading uptrend as it continues to work its way higher since the mid January breakout. Keep in mind that many ETFs failed to hold their mid January breakouts. KIE held its breakout in February and showed relative strength when the broader market fell. Since this breakout, the ETF worked its way higher into March and the price-relative (KIE/RSP ratio) hit a new high. The February lows and rising 200-day SMA mark a support zone in the 56-57 area.
ITA Breaks Out
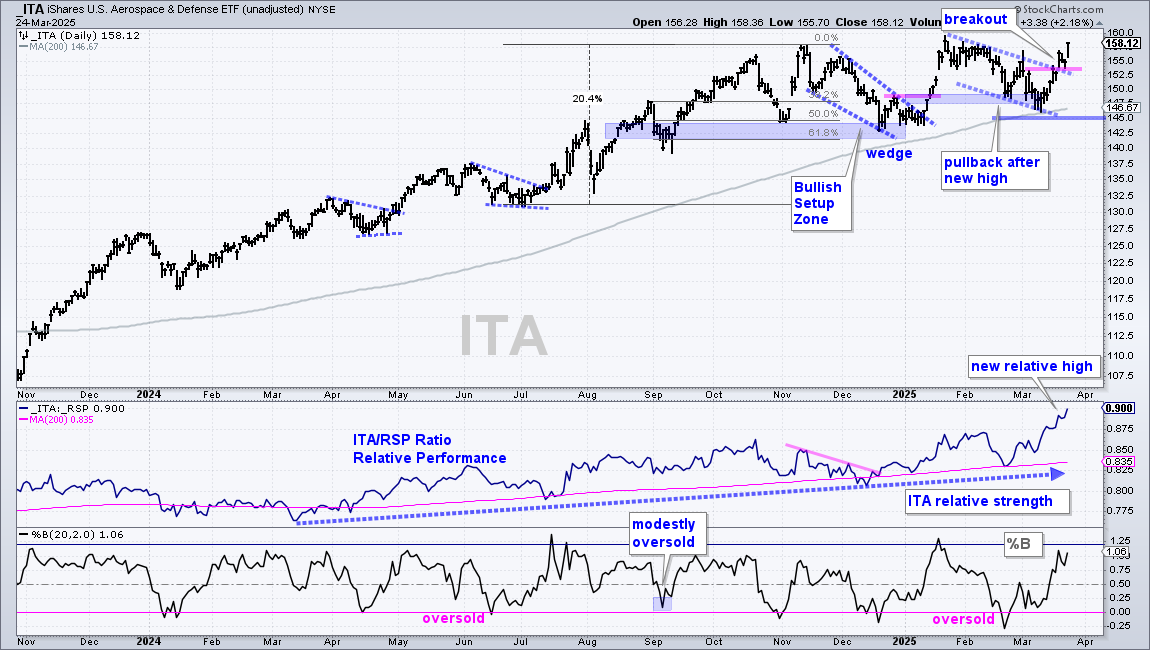
The Aerospace & Defense ETF (ITA) extended on last week’s breakout with a 2% surge on Monday and the ETF is close to another new high. ITA was already a leader with a new high in January and the price-relative hitting a new high this month. The decline into March was viewed as a pullback within the bigger uptrend. ITA broke out with a surge last week and this signals a continuation of the bigger uptrend. Re-evaluation support is set at 145.
IBB Remains within Wedge Pullback
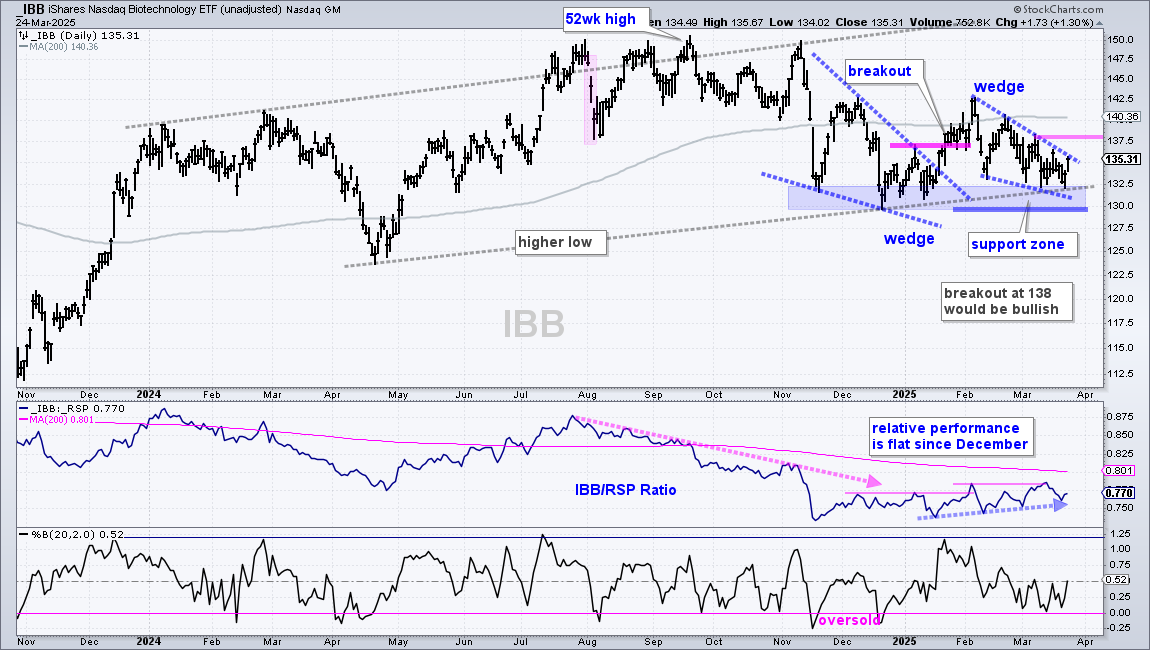
There is no change in the Biotech ETF (IBB) and it remains on my radar. Even though IBB is trading below its 200-day SMA, I can make the case for a long-term uptrend with a higher low from April to December and higher high from February to September (gray dashed lines). IBB fell in late 2024 with a falling wedge and broke out with a surge in mid January (breakout). With a pullback into March, a second wedge formed as IBB tested the support zone in the 130-132.5 area (blue shading). A breakout at 138 would be bullish and argue for a continuation of the choppy uptrend (gray dashed lines). A close below 130 would break the support zone and reverse this choppy uptrend. The middle window shows the price-relative (IBB/RSP ratio) edging higher this year as IBB slightly outperforms RSP. This is a start and a break above the 200-day SMA would show relative strength.
IHI Bounces Off Rising 200-day SMA
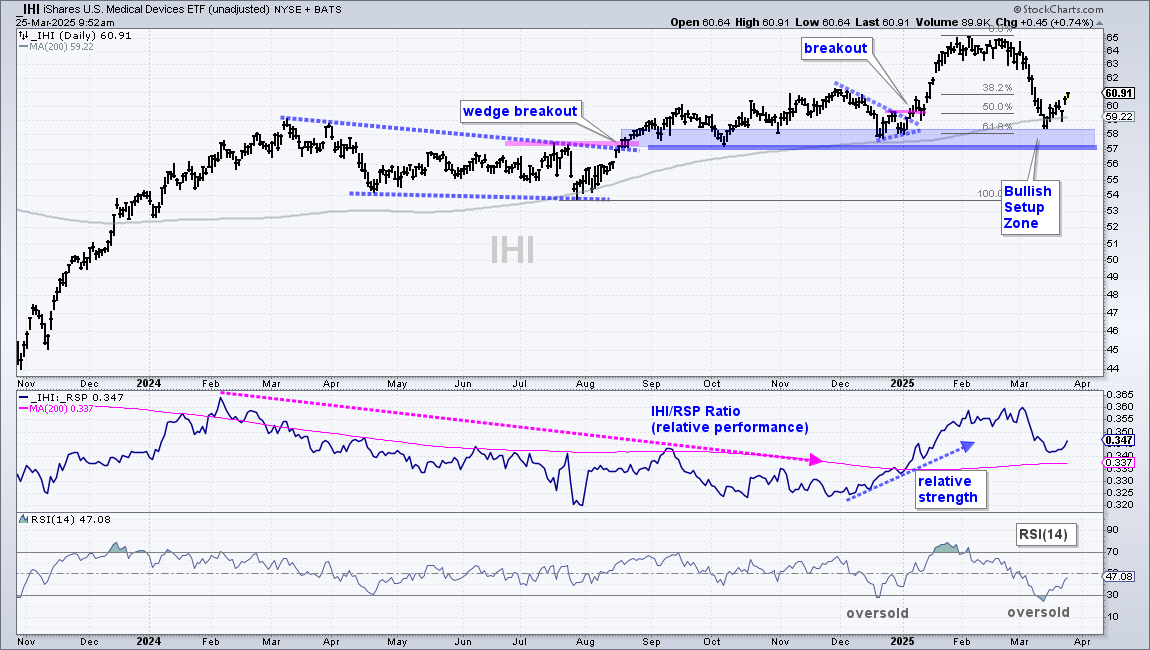
The Medical Devices ETF (IHI) remains in a long-term uptrend as IHI tagged a new high in February and fell to the rising 200-day SMA in mid March. The blue shading also marks a Bullish Setup Zone in the 57-58 area. Here we have the 61.8% retracement, broken resistance and supports from the September-December lows. RSI became oversold with a dip below 30 in mid March. The combination of oversold conditions and the Bullish Setup Zone produced an oversold bounce that recaptured the rising 200-day SMA (gray line). This bounce reinforces support in the 58 area and I will mark key support at 57.
AMLP Breaks Out of Small Corrective Pattern
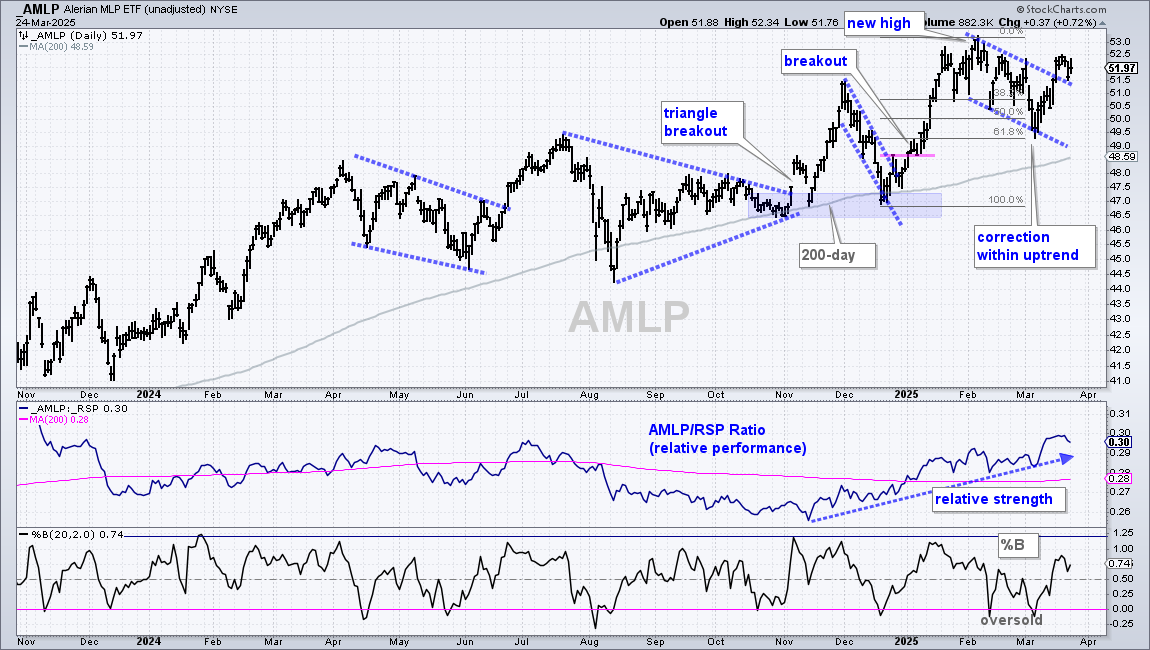
The MLP ETF (AMLP) remains in a leading uptrend with a channel breakout signaling an end to the short pullback. AMLP hit a new high in February, corrected into early March and broke out last week. Notice that this short correction reversed near the 61.8% retracement and when %B dipped below zero (oversold). This channel is deemed a correction withing a bigger uptrend and the breakout signals a continuation higher.
IYZ Bounces off Support Zone
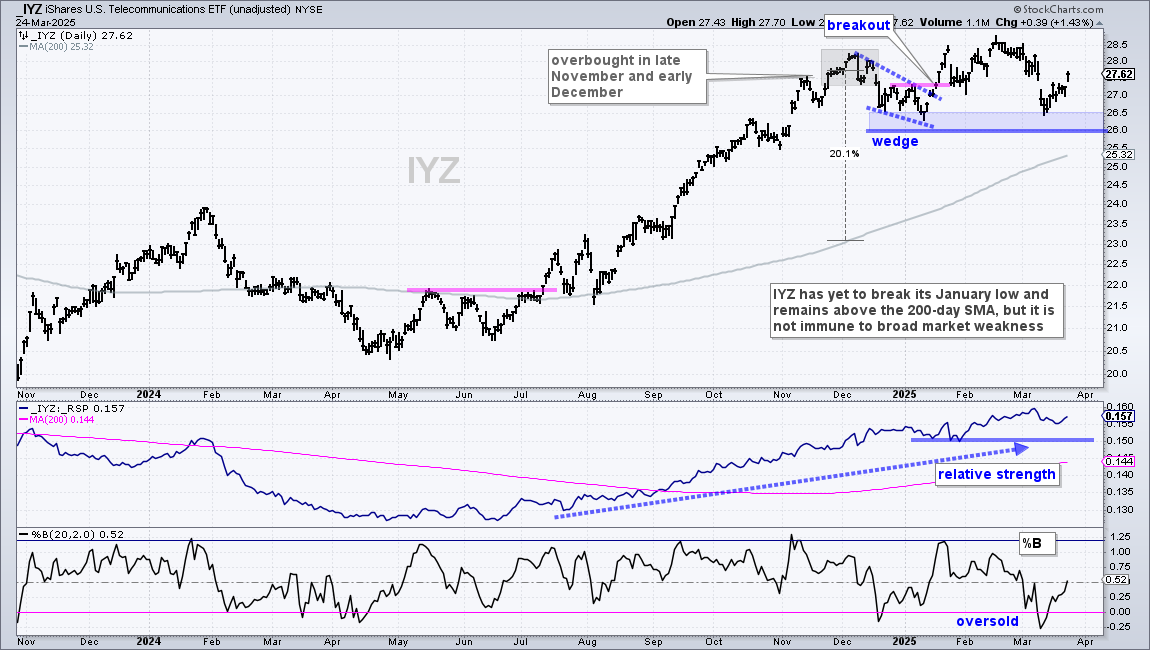
The Telecom ETF (IYZ) remains in a leading uptrend with a new high in February and a rising price-relative (IYZ/RSP ratio). Despite its leading uptrend, the ETF was hit hard in March as it fell to its January lows. These lows mark a support zone in the 26-26.5 area (blue shading). IYZ held support here with a bounce the last two days. This bounce reinforces the support zone and a close below 26 would reverse the long-term uptrend.
Send feedback to support(at)trendinvestorpro.com or use the contact form.