Today’s report covers the commodity, bond and Bitcoin ETFs. Gold continues to lead the markets with strength transferring to the Gold Miners. The only concern is the overbought condition, which is fast approaching. Copper surged to a new high and Coppers Miners broke out. Bonds remain in an uptrend as TLT bids for a short-term breakout. Bitcoin bounces within downtrend.
Using the PPO(1,200,0) to Define Overbought Conditions
Gold Miners Hit New High as Silver Miners Surge
Copper Surges to New Highs and Base Metals Hold Breakout
Copper Miners Breaks Out
DB Agriculture ETF Holds Short-term Breakout
TLT and IEF Go for Short-term Breakouts
Bitcoin Remains with Double Top and Downtrend
Gold SPDR Remains in Beast Mode
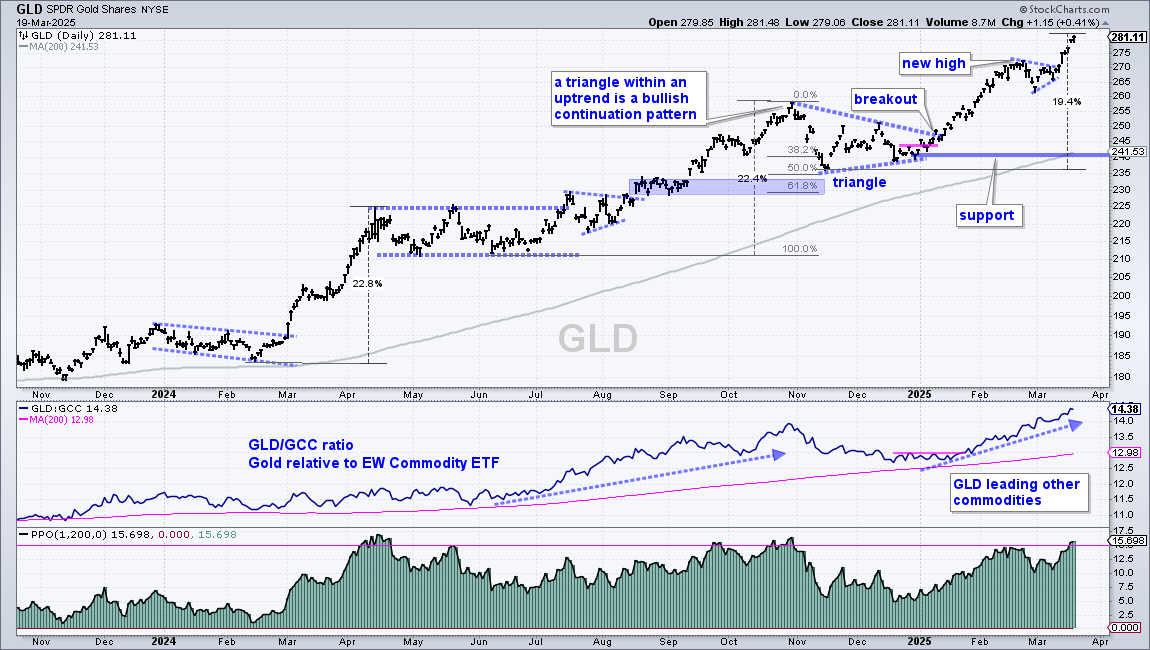
The Gold SPDR (GLD) remains in a leading uptrend with yet another new high this week. Gold is outperforming the commodity group, bonds, stocks and crypto. It is the strongest asset in the financial markets right now. There is nothing new on the chart because GLD is in uncharted territory as it trades at all time highs. The only potential negative is that the ETF is nearing overbought territory. Note that GLD is over 15% above its 200-day EMA, which was also the case in April and October 2024. These overbought readings gave way to a consolidation period to digest the gains. Overbought in an uptrend is not a bearish setup or signal. It simply means prices are extended and ripe for a rest.
The bottom window shows the PPO(1,200,0), which is the percentage difference between the close (1-day EMA) and the 200-day EMA. The last parameter (0) is the signal line, which is not needed for this example. I placed a pink line at 15% to mark overbought conditions, which occurred in April, late September, late October and now. While I prefer simple moving averages (SMAs) to exponential moving averages (EMAs), SharpCharts does not have an indicator to express the difference between two SMAs. StockCharts ACP does though. The PPO is based on EMAs. As far as signals and overbought conditions, there is not a big difference between EMAs and SMAs.
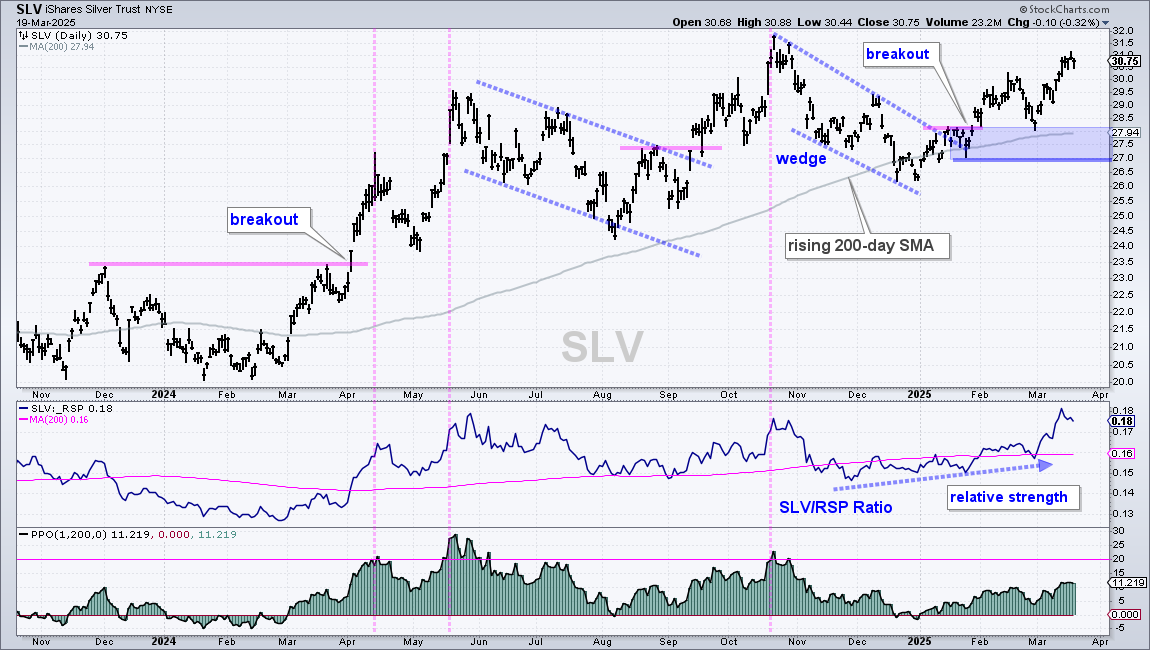
There is no change in the Silver ETF (SLV) as it extends on its late January breakout. Silver is positively correlated to gold so a consolidation or pullback in the yellow metal will also affect silver. SLV corrected with a falling wedge that returned to the rising 200-day SMA in December and broke wedge resistance in late January. The ETF extended on this breakout and the odds favor a move to new highs. For support, I am using the breakout zone in the 27-28 area (blue shading), a break of which would call for a re-evaluation. The bottom window shows the PPO(1,200,0) at 11.21%, and not yet near overbought levels. SLV is much more volatile than GLD so I need to use a higher level to define overbought. SLV becomes overbought when the PPO(1,200,0) exceeds 20%. The pink vertical lines mark overbought conditions in April, May and October.
Gold Miners Hit New High as Silver Miners Surge
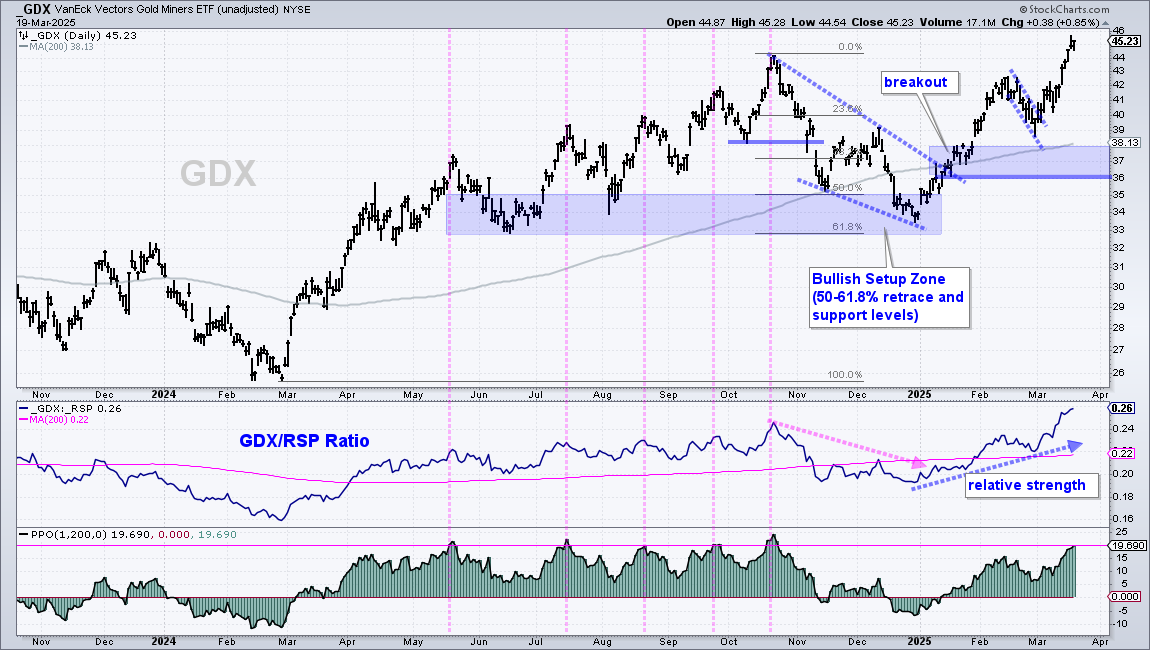
The Gold Miners ETF (GDX) is keeping pace with the Gold SPDR (GLD) as it surged to a new high this week. Needless to say, GDX is also positively correlated to GLD, and also more volatile. GLD broke out of a falling wedge in mid January and extended higher in February-March. I am marking a support zone in the 36-37 area. The middle window shows the price-relative hitting a new high as GDX outperforms the broader market. The bottom window shows the PPO(1,200,0) nearing 20%, which marks the overbought level. As the pink vertical lines show, prior overbought conditions led to pullbacks in May, July, August and September. The October overbought reading foreshadowed a deeper correction into yearend.
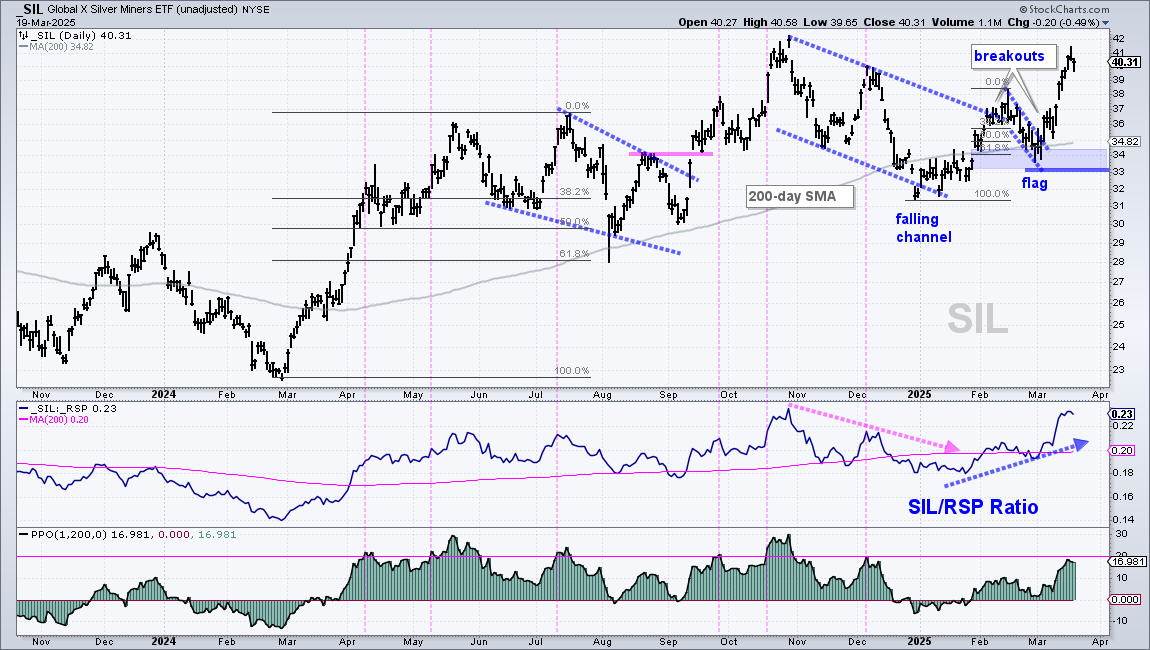
The Silver Miners ETF (SIL) surged in March and is on the cusp of a new high. Overall, I see a falling channel correction into January, a breakout in February, a falling flag into March and a flag breakout in early March. SIL is also above the rising 200-day SMA and in a long-term uptrend. The flag lows and 200-day SMA mark the first support zone to watch (blue shading). As with GDX, I am using the PPO(1,200,0) to define overbought conditions. SIL is more volatile and erratic than GDX, but I will leave the overbought level at 20%. The pink vertical lines show when the PPO exceeds 20%.
Copper Surges to New Highs and Base Metals Hold Breakout
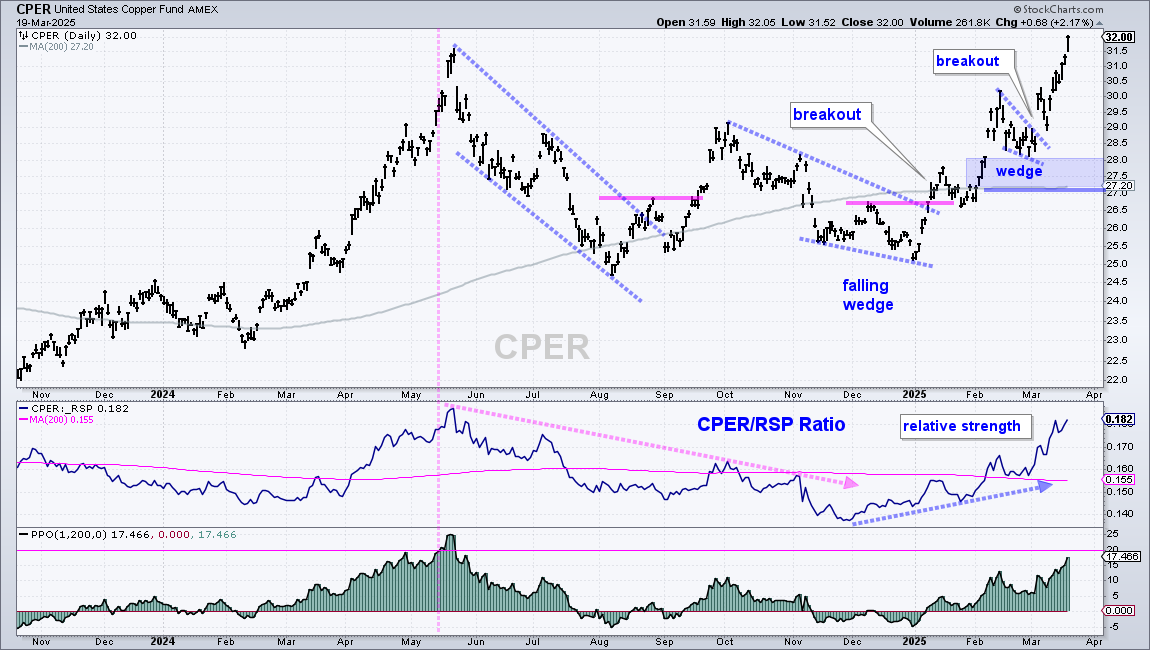
The Copper ETF (CPER) caught fire with a wedge breakout in early March and a surge to new highs this week. Overall, CPER broke falling wedge resistance in early January and surged to 30 in mid February. The ETF was overbought in mid February and worked off this condition with a small wedge into early March. CPER is clearly in a long-term uptrend and leading, but getting a bit frothy after a 27% gain this year. The bottom window shows the PPO(1,200,0) at 17.46% and the overbought line (pink) at 20%. CPER became overbought in mid May as the PPO exceeded 20% and this foreshadowed an extended pullback. Not all overbought readings lead to pullbacks and not all pullbacks lead to extended declines. An overbought reading means the advance is getting extended and ripe for a rest.
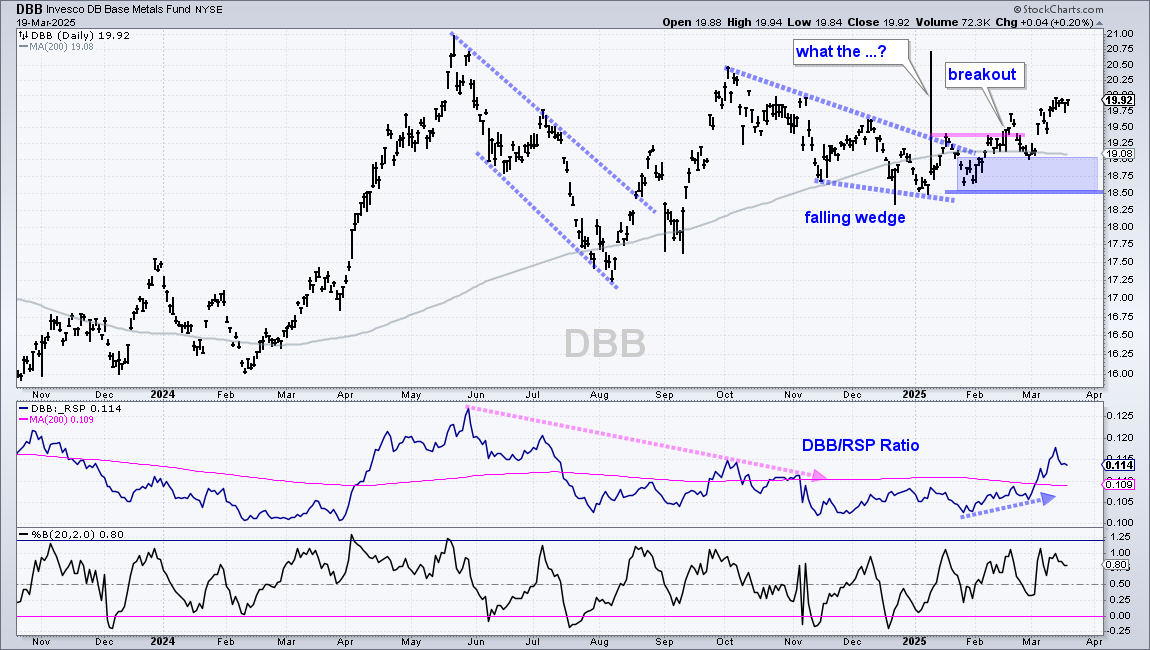
There is no change in the DB Base Metals ETF (DBB), which is equal parts copper, aluminum and zinc. DBB is not as strong as copper, but has a breakout working all the same. As with the other metals, DBB corrected into yearend and then broke out in early 2025. DBB formed a falling wedge and broke resistance with a surge in mid February. I view the wedge as a correction within a bigger uptrend and the breakout signals a continuation of this uptrend. The February-March lows mark support in the 18.50-19 area (blue shading).
Copper Miners ETF Breaks Out
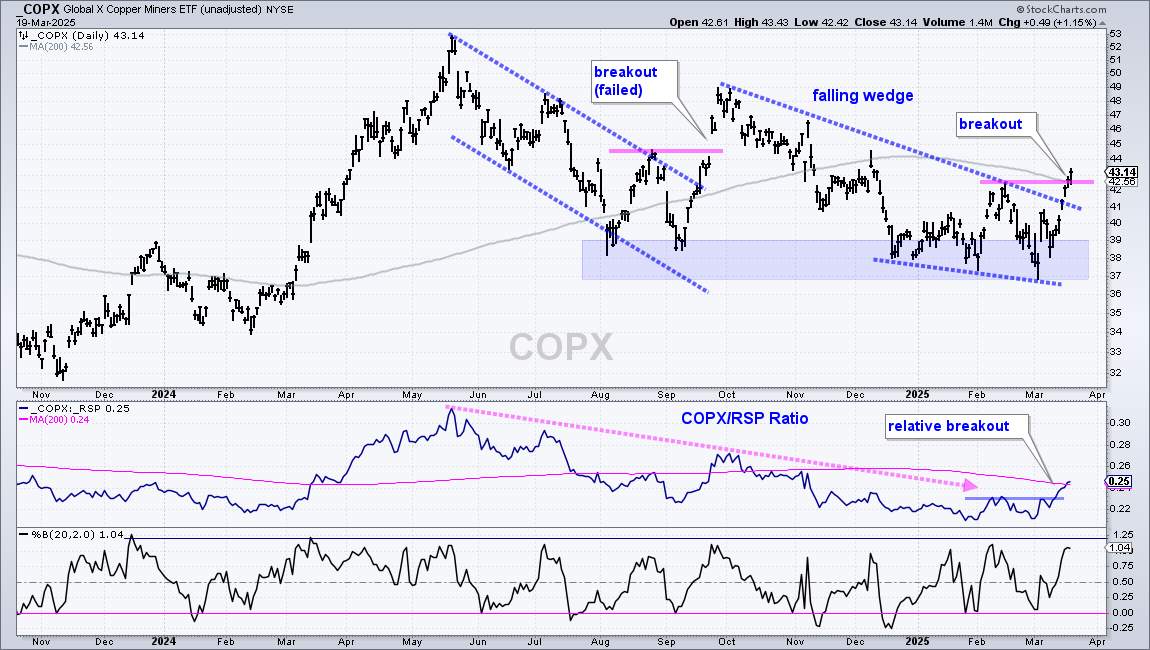
The Copper Miners ETF (COPX) is chasing copper as it finally breaks out and exceeds its 200-day SMA. Last week I showed the falling wedge and the support zone in the 37-39 area (blue shading). COPX held support and surged above resistance with a 14% gain in 11 days. This is the strongest breakout surge since, well, September 2024. That breakout surge ultimately failed as COPX fell into December. Some breakouts fail and some hold. It is part of the ball game. For now, COPX has a breakout working with an outsized move. I view this as bullish and expect a move above the September highs. A close below 38 would argue for a re-evaluation. The middle window shows the price-relative (COPX/RSP ratio) firming in February and breaking out in March. COPX is also showing relative strength.
DB Agriculture ETF Holds Short-term Breakout
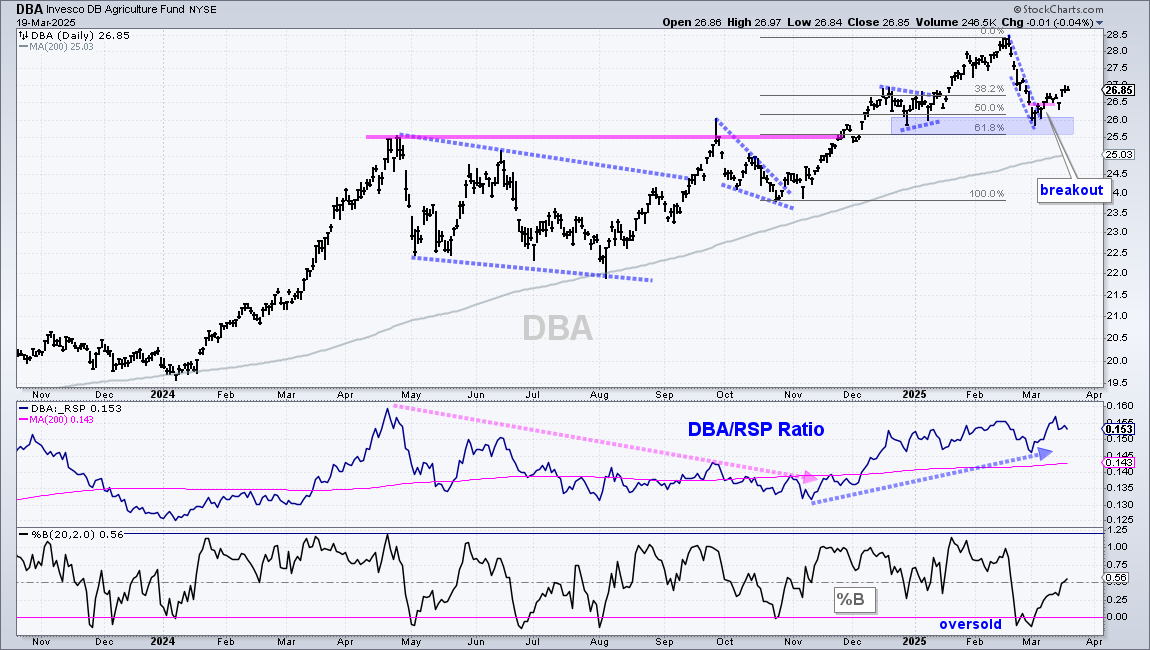
The DB Agriculture ETF (DBA) is in a long-term uptrend and leading the stock market since December. Overall, DBA broke to new highs in November and extended higher into February. The ETF then retraced 50-61.8% of its October-February advance with a decline to the 25.5-26 area (blue shading). This area also marks support from the late December and early January lows. A steep falling flag formed with short-term resistance at 26.50 (pink line). DBA broke out with a pop in early March and this breakout is holding. A close below 26 would negate the short-term breakout.
TLT and IEF Go for Short-term Breakouts
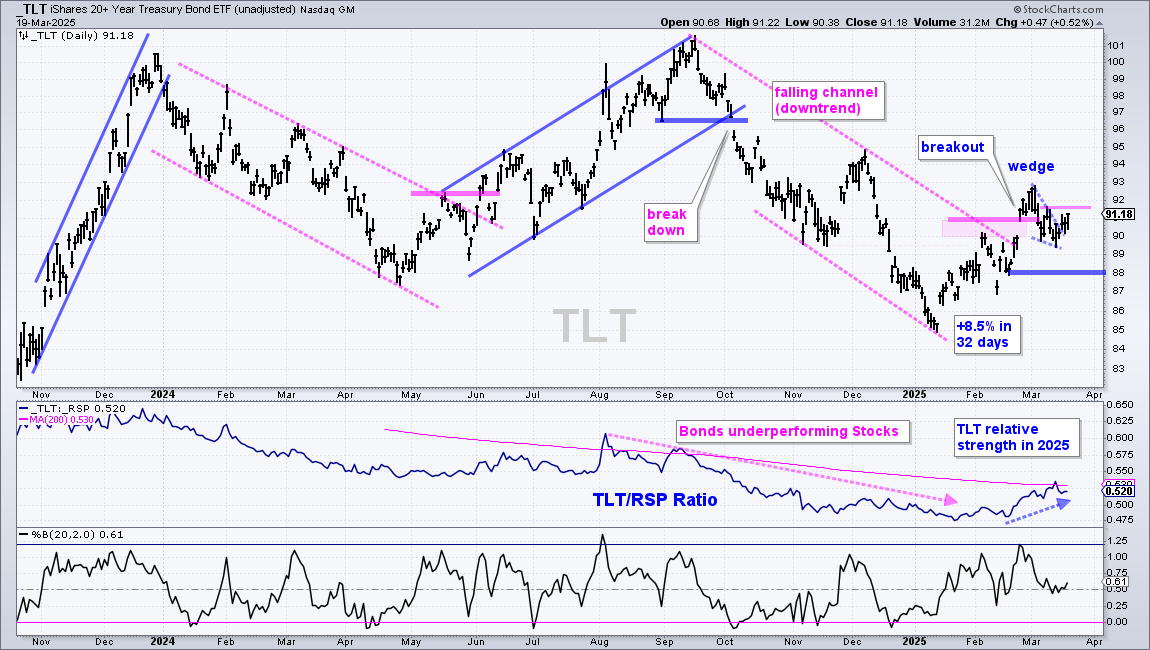
The 20+ Yr Treasury Bond ETF (TLT) reversed its downtrend with a surge from early January to late February. This surge broke the upper line of a falling channel and exceeded the early February high (resistance zone). TLT was short-term overbought after a sharp move from 85 to 93 (+8.5% in 32 days). The ETF alleviated this overbought condition with a small wedge. This is a consolidation or small pullback within a bigger uptrend, which makes it a bullish continuation pattern. TLT is breaking out of this wedge and looking to continue on the bigger breakout in February. The middle window shows the TLT/RSP ratio turning up in February as TLT starts to outperform the S&P 500 EW ETF (RSP). Relative strength in bonds means traders prefer relative safe-havens over riskier assets (stocks).
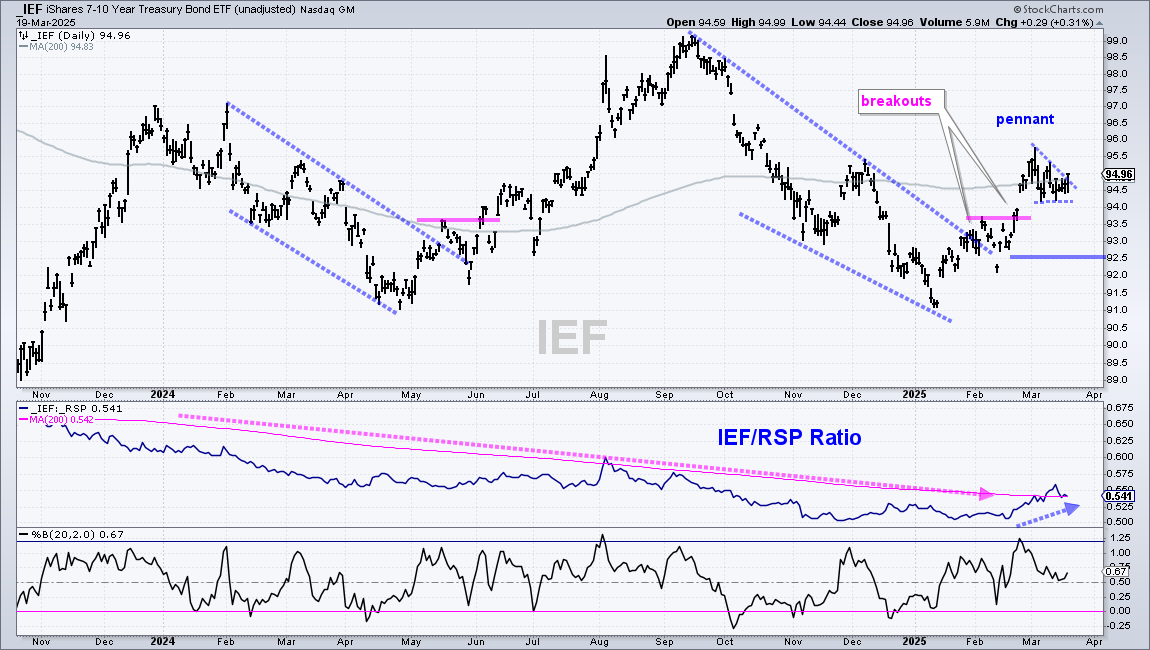
The next chart shows the 7-10 Yr Treasury Bond ETF (IEF) with a breakout surge and a pennant consolidation. IEF is also going for a short-term breakout that would signal a continuation higher.
Bitcoin Remains with Double Top and Downtrend
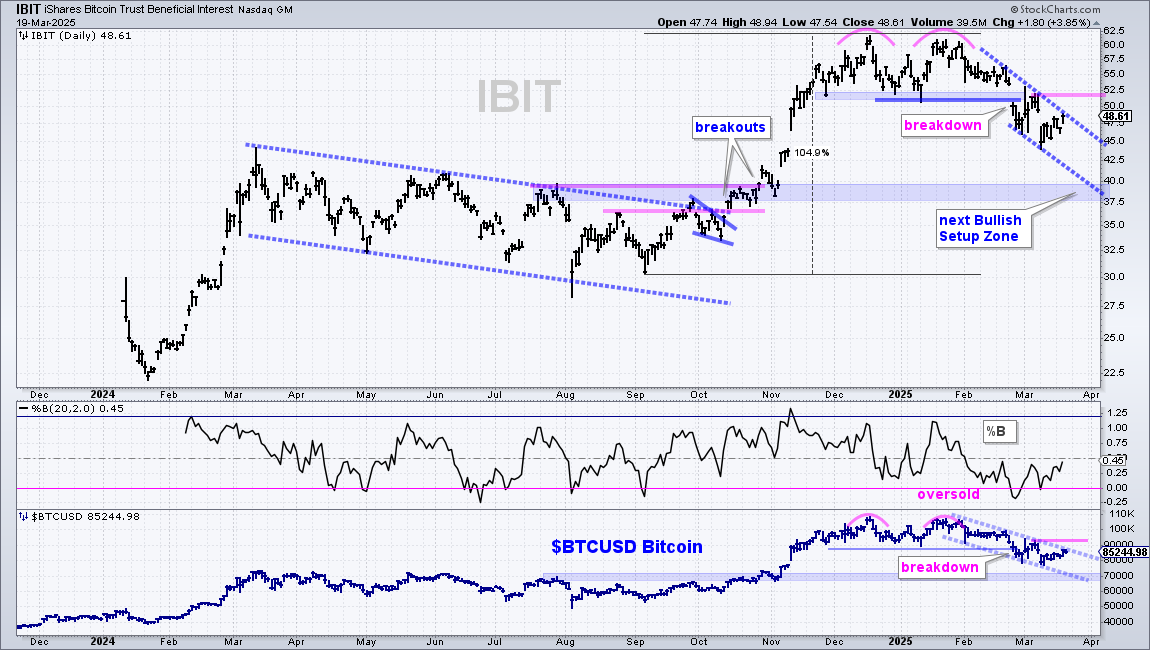
The Bitcoin ETF (IBIT) remains in a downtrend with a confirmed Double Top. The ETF formed two highs in the 62 area (pink arcs) and broke the intermittent low with a sharp decline in late January. There was a short bounce back to the breakout zone (blue shading), but this area turned into resistance as IBIT fell to the 45 area. The blue dashed lines define the downtrend with resistance marked at 52 (93,000 $BTCUSD). A breakout here would reverse the current downtrend and also negate the Double Top break.
Send feedback to support(at)trendinvestorpro.com or use the contact form.