")
The next report will be posted on Thursday morning, December 12th.
Report Headlines
- The Market is in Pullback Mode
- AD% Indicators Reflect Internal Performance
- Watch S&P 500 EW ETF for Next Market Move
- Housing and Home Construction ETFs Pull Back
- Six Tech Leaders with 20+ Percent Gains
- Cybersecurity ETF in Ongoing Uptrend
- Zoetis Hits Firms in Bullish Setup Zone
- INTU Corrects after Breakout
I will post a comprehensive video on Wednesday morning.
The Market is in Pullback Mode
SPY and QQQ led the market with advances last week and new highs on Friday. Under the surface, however, the market has been in pullback mode the last eight trading days. A pullback within an uptrend is normal. Today’s report starts with the S&P 500 EW ETF to define the pullback and then shows bull flags forming in two housing related ETFs (ITB, XHB). We then turn to some overextended tech groups (IGV,CLOU) and analyze the chart for the Cybersecurity ETF. This report finishes with two stocks trading in Bullish Setup Zones (ZTS, INTU)
AD% Indicators Reflect Internal Pullback
The chart below shows the Advance-Decline Percent indicators for the S&P 500, S&P MidCap 400, S&P SmallCap 600 and Nasdaq 100. Advance-Decline Percent is the percentage of advancing stocks less the percentage of declining stocks. This indicator measure daily participation within their respective indexes. In the first indicator window, we can see that S&P 500 Advance-Decline Percent was negative the last six days. This means there were more declines than advances within the index.
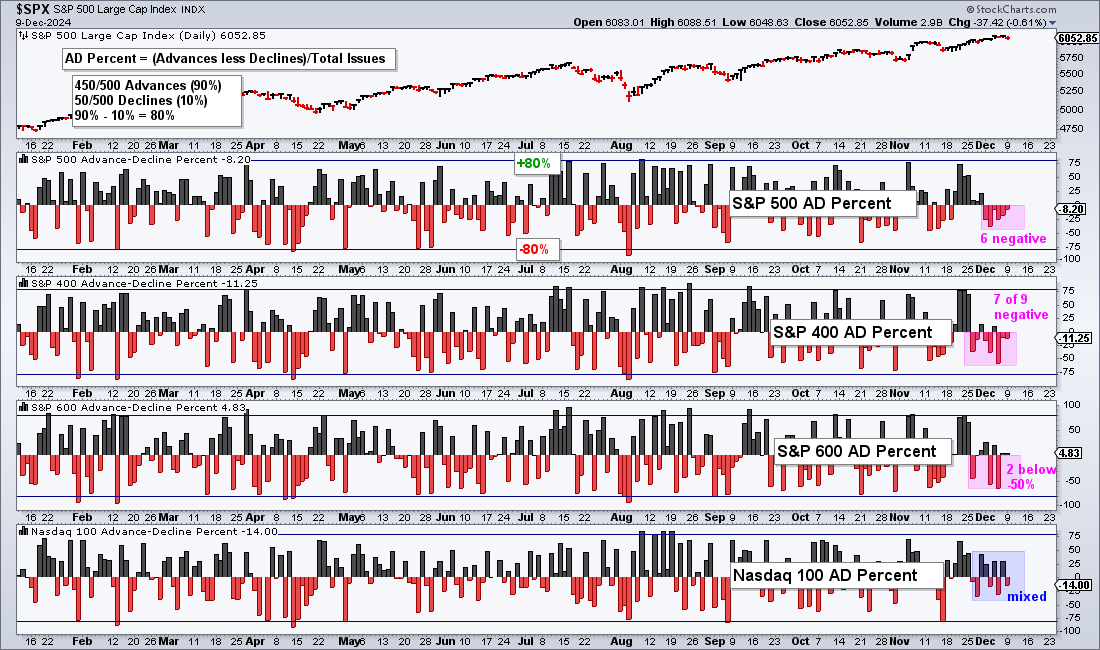
The middle windows show declines outpacing advances in seven of the last nine days for the S&P MidCap 400. SML Advance-Decline Percent dipped below -50% twice in the last two weeks and has not registered a strong day since late November. Nasdaq 100 Advance-Decline Percent (bottom window) is mixed the last two weeks. Overall, these numbers reflect the pullback we are seeing in the broader market.
Watch S&P 500 EW ETF for Next Market Move
The S&P 500 EW ETF (RSP) represents the average stock in the S&P 500. Based on RSP, the average stock is in pullback mode. Pullbacks are normal after sharp advances and within uptrends. A breakout in RSP would be positive for the broader market and suggest that the rally is resuming.
The chart below shows RSP falling 1.7% in five of the last six days. This pullback follows a 3.7% surge and new high in late November. Overall, RSP is in a long-term uptrend and these pullbacks are part of the normal ebb and flow. Note that RSP advanced from 161 in early August to 188 in late November (+16.65%). There were four pullbacks along the way. Each retraced around 50% of the prior advance and formed a falling flag. The fourth pullback is underway right now with short-term resistance marked at 186.50. A breakout here would reverse the short-term slide and open the door to new highs. Such a move would also be positive for mid-caps and small-caps, which were covered on Tuesday (here).
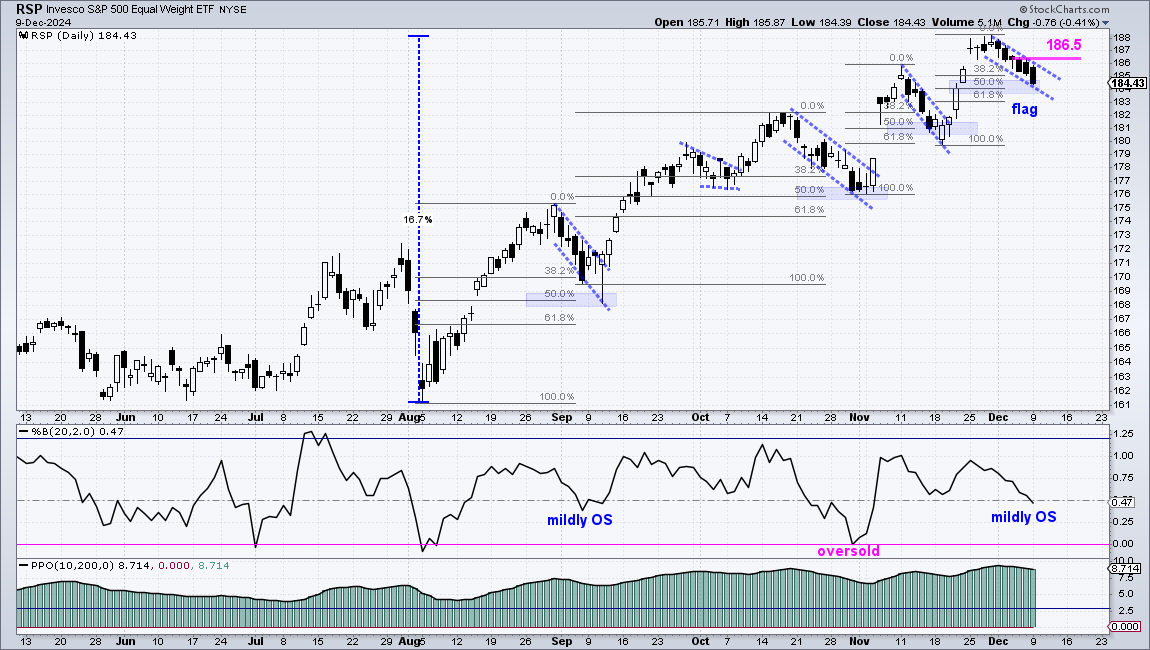
The bottom window shows the PPO(10,200,0) at 8.71%. This means the 10-day EMA is 8.71% above the 200-day EMA and the long-term trend is up. The middle window shows %B dipping below .50, which means RSP closed below the 20-day SMA. This is a mild oversold condition similar to early September. Sometimes we do not get a true oversold reading with a move below 0 (close below the lower Bollinger Band). The pullbacks are similar, but duration and depth vary.
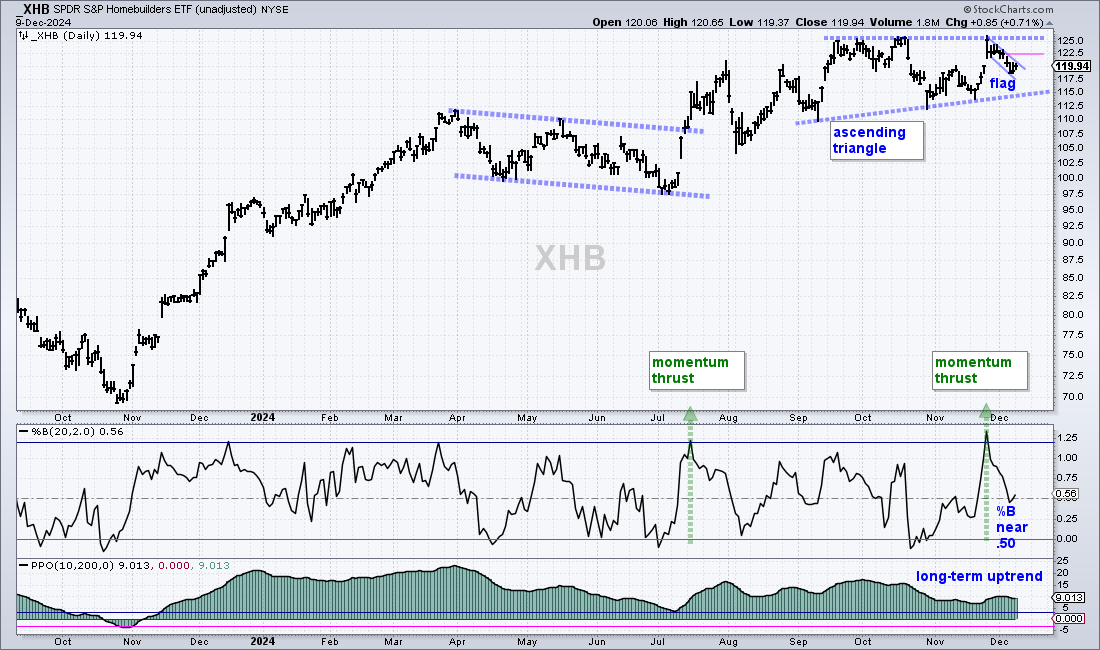
Housing and Home Construction ETFs Pull Back
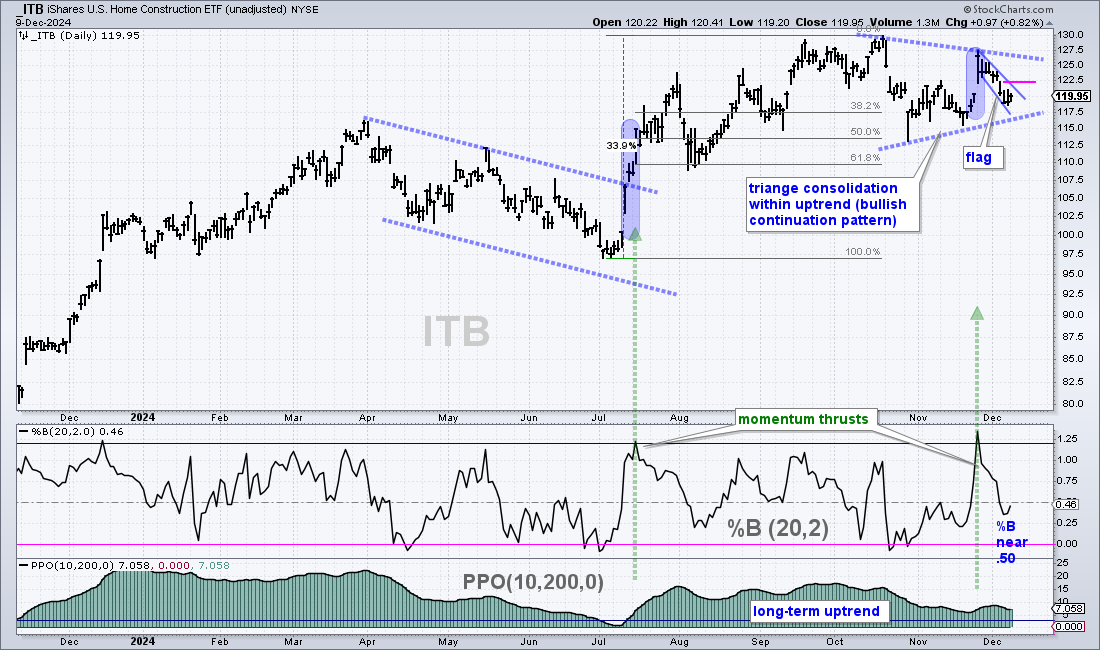
The Home Construction ETF (ITB) and the Homebuilders ETF (XHB) were featured in late October as they surged with strong momentum. %B surged above 1.20 to quantify this momentum thrust. Readings above 1.2 are also considered short-term overbought. ITB and XHB alleviated these overbought conditions with a pullback the last two weeks. %B fell towards the .50 area as falling flags formed on the charts. These patterns are similar to what we are seeing in RSP (above).
The first chart shows XHB with an Ascending Triangle forming since September. These are medium-term bullish continuation patterns and a breakout above the October-November highs would confirm the pattern. Within the pattern, XHB surged to 125 and fell back the last two weeks with a falling flag. This is a short-term bullish continuation pattern and a breakout at 122.5 would confirm the pattern. A short-term breakout would also increase the odds for a medium-term breakout.
The next chart shows ITB with a triangle consolidation taking shape the last two months. A breakout at 127.5 would signal a continuation higher. Within the triangle, ITB surged and fell back with a falling flag. A breakout at 122.5 would provide the early clue for a bigger breakout.
Six Tech Leaders with 20+ Percent Gains
Most often, we do not have setups on the price charts. Price is simply in an ongoing uptrend or downtrend. During an ongoing uptrend, chart traders need to exercise some discretion and wait for a tradable setup or pattern to emerge. It could take two weeks, two months or two years. We simply do not know how long it will take.
The Cybersecurity ETF (CIBR) and many tech-related ETFs are in this situation. They are in ongoing uptrends without a trading setup or tradable pattern. Trading setups include short-term oversold conditions. The CandleGlance charts below show nine tech-related ETFs. Six of the nine are up over 20% since September (69 trading days). The indicator in each chart shows ROC(69). The leaders include MAGS, IGV, FINX, SKYY, CLOU and BLOK. These leaders, however, are quite extended after big gains in a relatively short period of time.
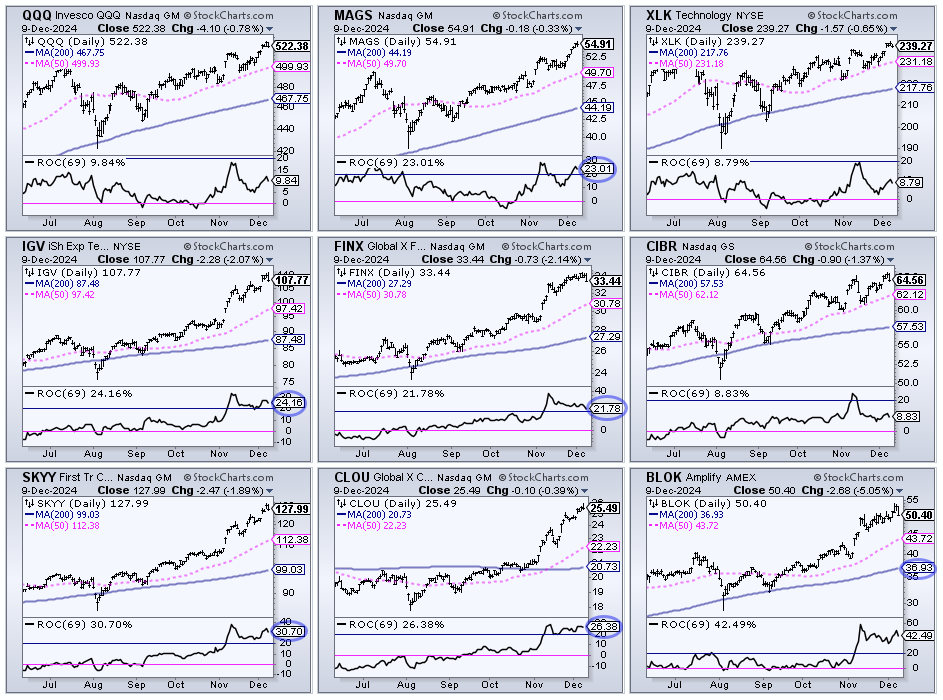
QQQ, the Technology SPDR (XLK) and Cybersecurity ETF (CIBR) are up between 8 and 10 percent the last 69 days. CIBR was up over 20% in mid November. All chart are in ongoing uptrends, but I do not see any setups. These ETFs remain on my watchlist for tradable setups because they are leaders.
Cybersecurity ETF in Ongoing Uptrend
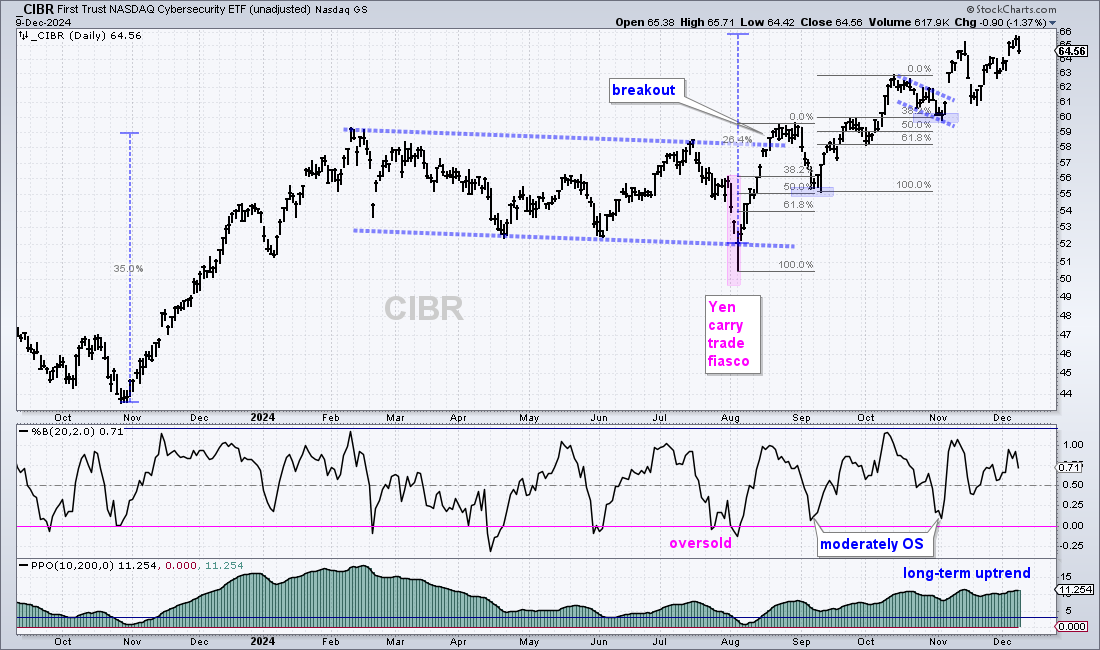
The next chart shows CIBR with a breakout in mid August and a choppy advance since this breakout. CIBR fell back in early September with a 50% retracement and then surged to new highs in October. It fell back in the lead up to the election with another 50% retracement and broke out the day after the election. Most recently, it hit a new high on Friday and fell 1.37% on Monday. CIBR remains in an ongoing uptrend without a setup. Perhaps a pullback to the 62 area will lead to a setup.
Zoetis Hits Firms in Bullish Setup Zone
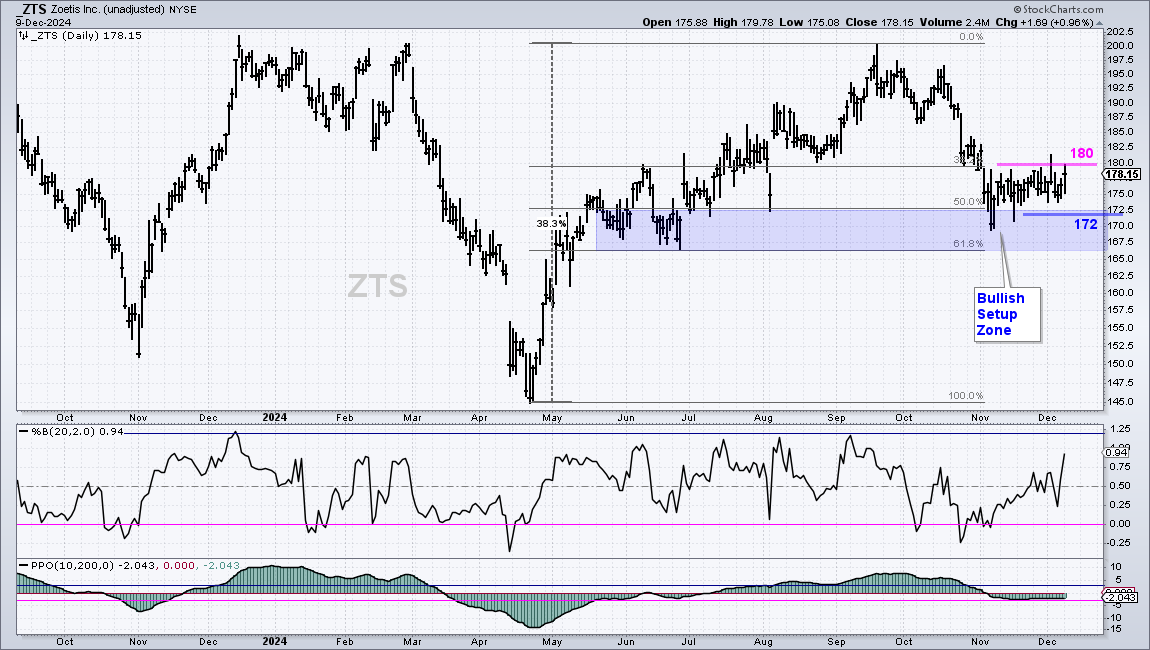
The next chart shows Zoetis (ZTS) develops and manufactures healthcare products for animals. ZTS is not in an uptrend, but also not in a downtrend. It is in a large trading range and currently trading in the middle of this range. The stock caught my eye because it is firming in a Bullish Setup Zone and it is up over the last six trading days (short-term relative strength). ZTS advanced some 38% and then retraced around 50% with a decline to the low 170s. There is also support in the 166-172 area from the May-August lows (blue shading). Together, these form the Bullish Setup Zone that could give way to a short-term reversal. I am marking resistance at 180 and a breakout here would be bullish. Upon a breakout, I would set a re-evaluation at 172.
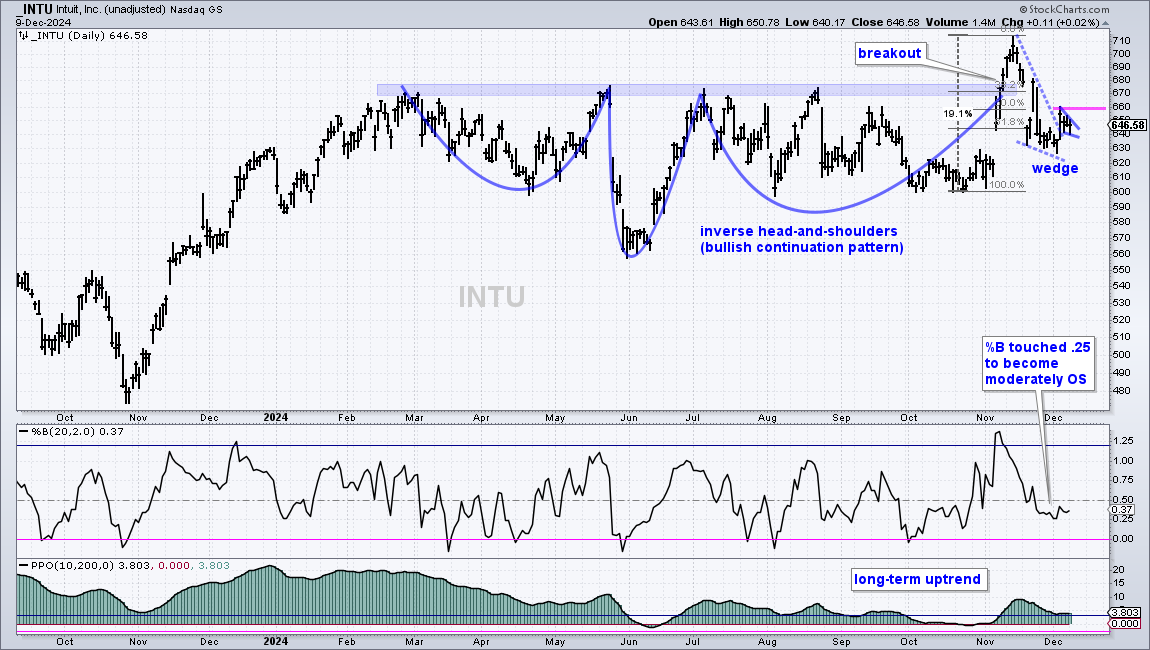
INTU Corrects after Breakout
The next chart shows Intuit (INTU), which provides finance-related software and services for businesses. The stock advanced with the market from late October to February and then consolidated into mid November. A large inverse head-and-shoulders pattern formed and the stock broke neckline resistance with a strong move above 700. INTU then fell back rather sharply, but this decline is finding support near the 61.8% retracement level and in the gap zone. I would consider this area as a Bullish Setup Zone that could give way to a reversal. INTU broke the wedge line with a surge last week and then consolidated the last three days. Another breakout at 660 would be bullish and argue for a run to new highs.