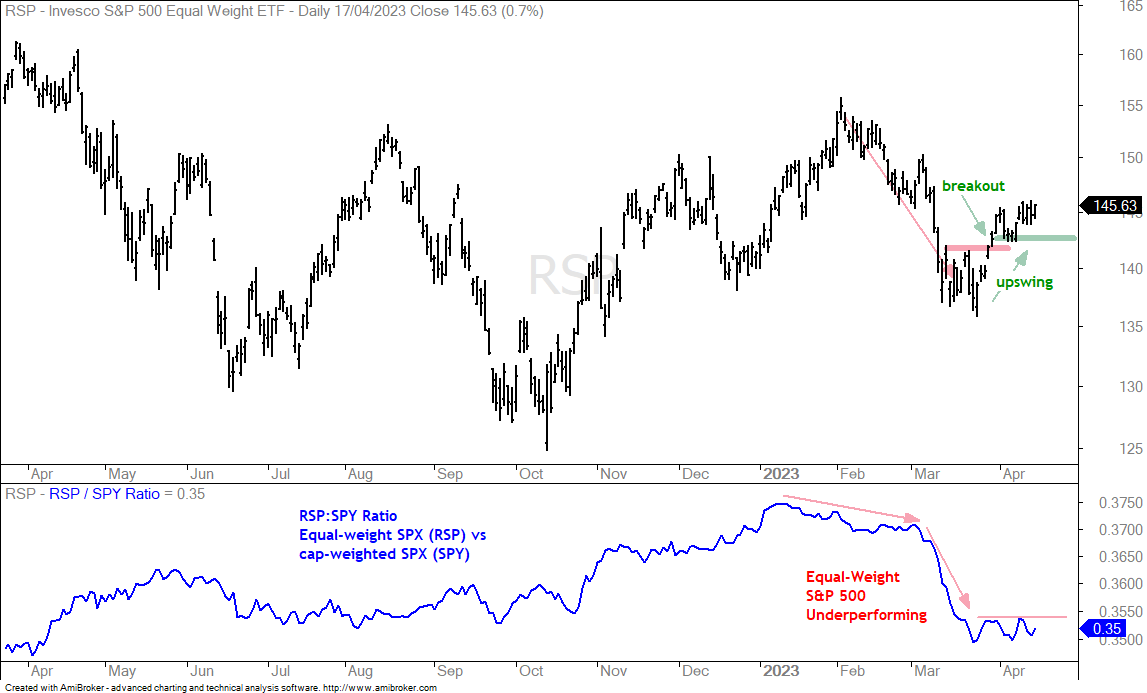
The weight of the evidence remains bullish for stocks. Large-caps are leading with the S&P 500 SPDR nearing its early February high. Small-caps are still lagging because the Russell 2000 ETF remains well below this high. Despite relative weakness in small-caps, the upswings that began with the late March breakouts are holding for several ETFs (IWM, SPHB, RCD, XRT). It is still a market of swings and the current swing is up for most ETFs. The chart below shows the S&P 500 EW ETF (RSP) with a downswing from early February to mid March and a breakout in late March. The current swing is up with the early April low marking key support. As you will see below, I am watching the early April lows on several charts.
About the ETF Trends, Patterns and Setups Report
This report contains discretionary chart analysis based on my interpretation of the price charts. This is different from the fully systematic approach in the Trend Composite strategy series. In this ETF Trends, Patterns and Setups report, I am looking for leading uptrends and tradable setups within these uptrends. While I use indicators to help define the trend and identify oversold conditions within uptrends, the assessments are mostly based on price action and the price chart (higher highs, higher lows, patterns in play). Sometimes the chart assessment can be at odds with the indicators.
Report Schedule
Tuesday – 18-Apr: Market/ETF Report
Wednesday –19-Apr: Market/ETF Video
Thursday – 20-Apr: Strategy Update or Article
Systematic Strategies and Tables
Here are the three active strategies and their respective tables.
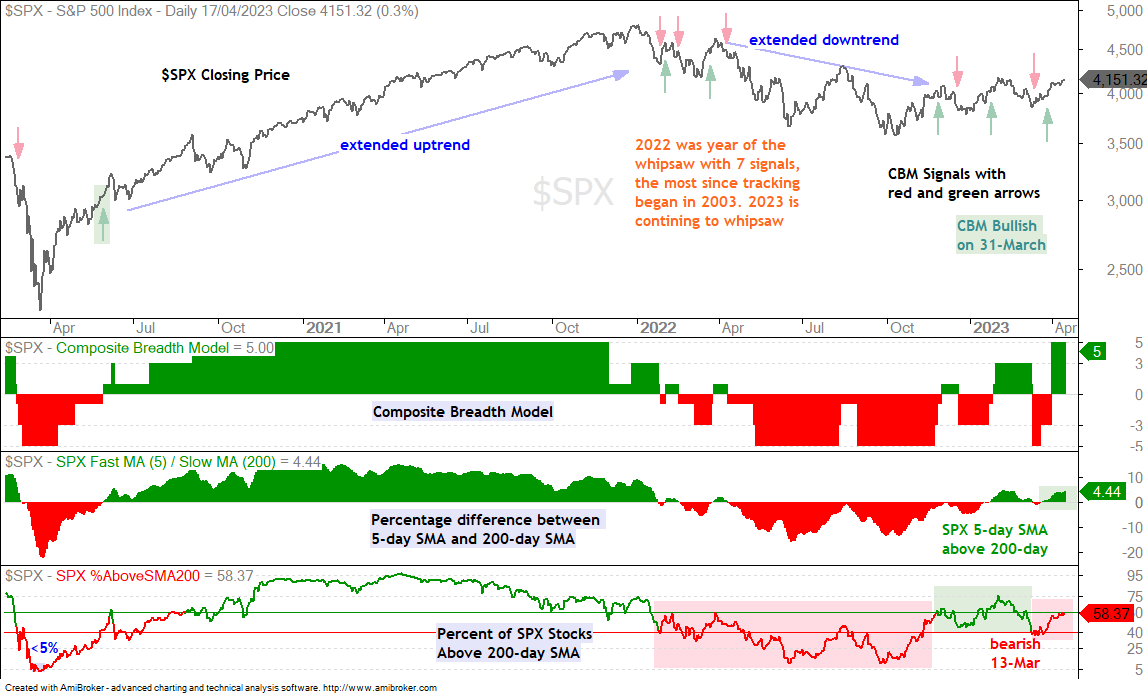
The Composite Breadth Model remains at +5 and net bullish. The 5-day SMA for the S&P 500 is above the 200-day SMA and some 58% of S&P 500 stocks are above their 200-day SMAs. Even though the CBM is at +5, which is its max, this is not a broad bull market that is lifting all boats. Small-caps continue to lag with just 42.5% of S&P SmallCap 600 stocks above their 200-day SMAs.
SPY Remains in Long-term Uptrend
Long-term and short-term time horizons are relative. In my book, long-term is usually three months or more and short-term is two weeks or more. We could further dissect the timeframes by adding a medium-term timeframe, but I try to keep it simple with just two timeframes: one long and one short. Adding more timeframes usually overcomplicates analysis.
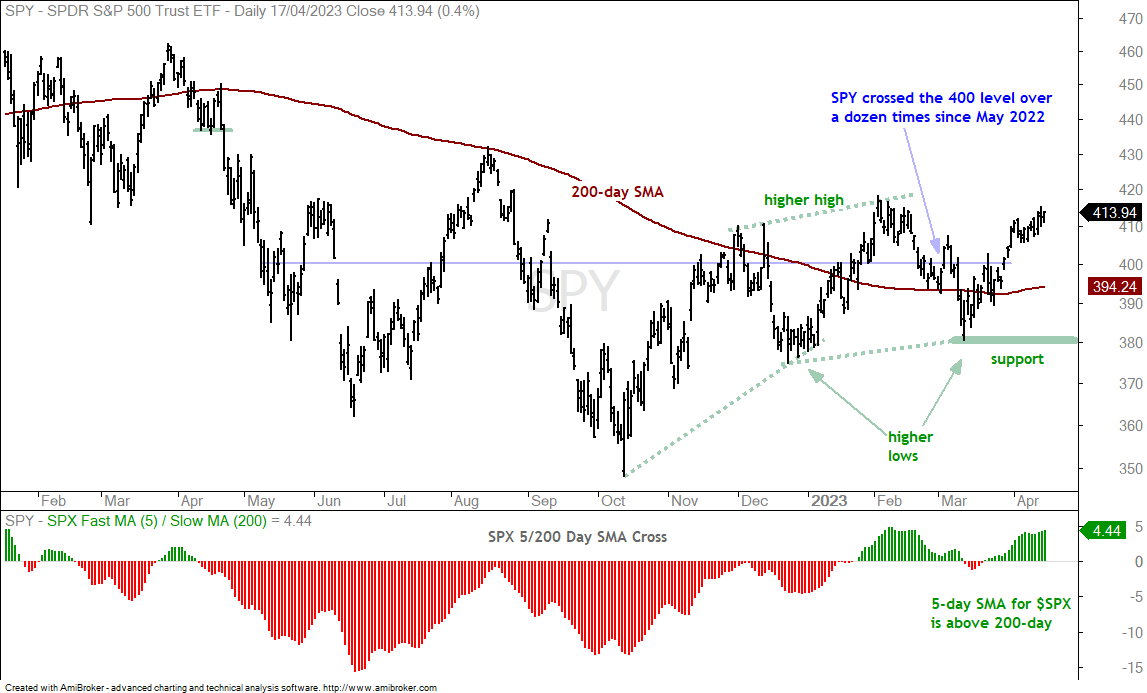
The chart below shows SPY in a long-term uptrend with a higher low from October to December and a higher high from December to February. The ETF is above the 200-day SMA and the 200-day SMA turned up over the last few weeks. The March low is the last important trough and it marks key support. A break here would forge a lower low and reverse the uptrend.
SPY Extends on Short-term Uptrend
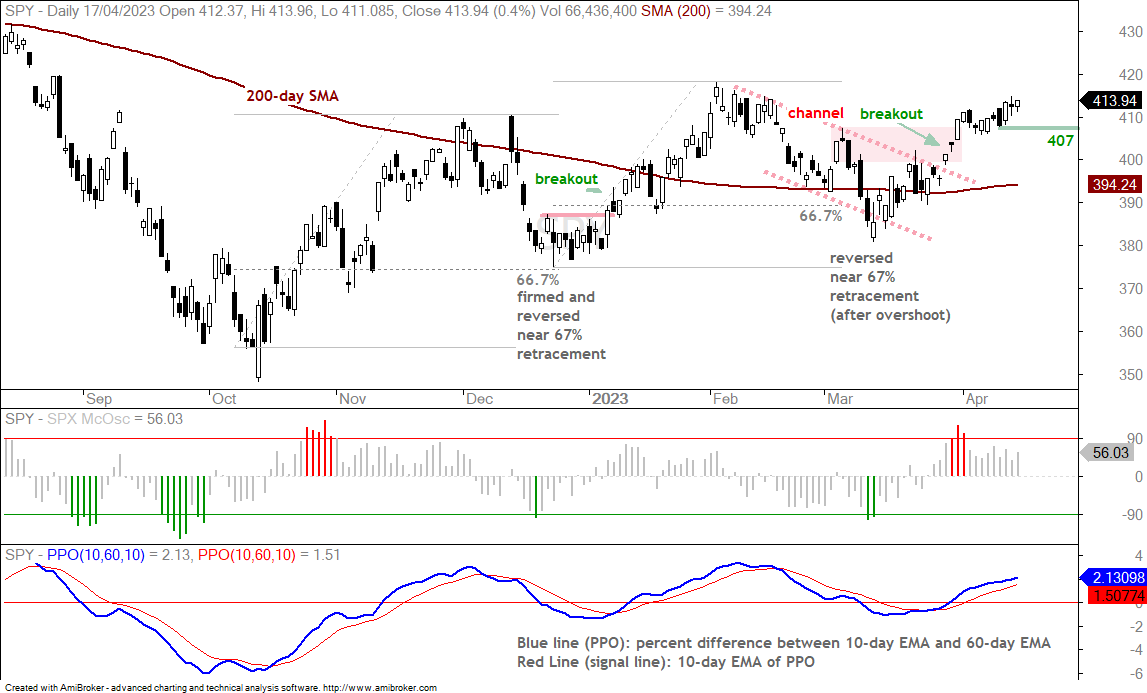
The next chart shows SPY breaking out of a falling channel and moving above 410. The breakout held and price extended. The McClellan Oscillator exceeded +90 to become overbought in late March and early April (red lines), but price has yet to reverse as the PPO(10,60,10) remains above its signal line. This is a classic case of becoming overbought and remaining overbought. A PPO cross below the signal line would reverse the short-term uptrend in SPY. Chartist can also watch short-term support at 407.
QQQ Consolidates after Big Advance
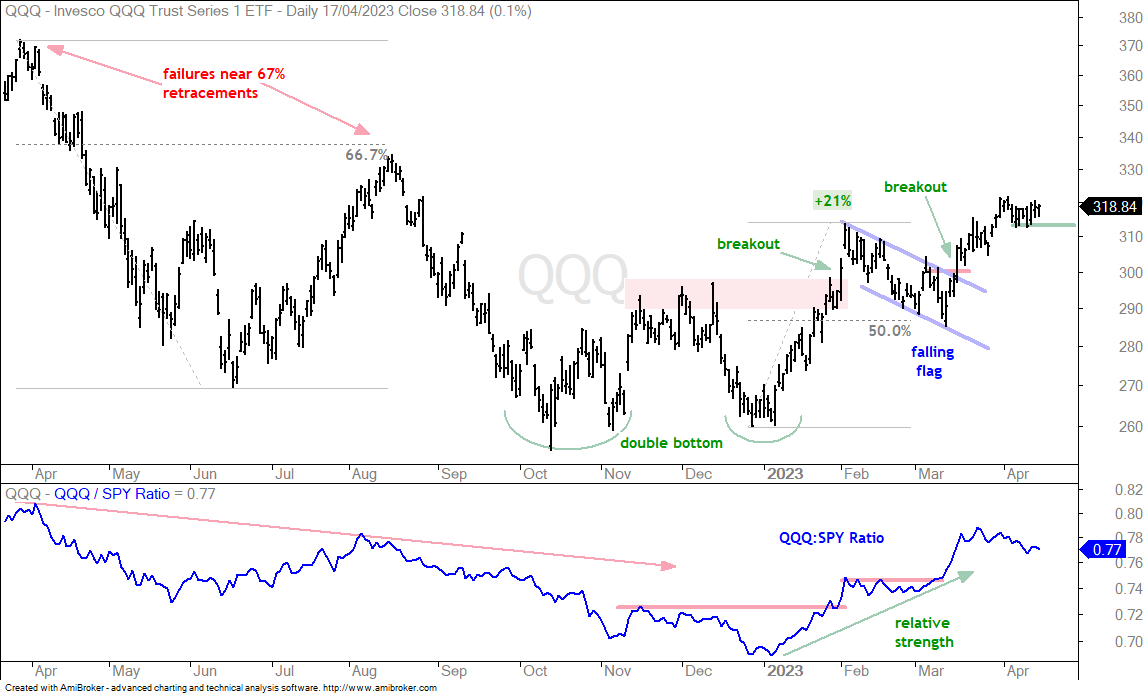
QQQ broke out of a falling flag in mid March and exceeded 320 in late March. The ETF then consolidated and underperformed SPY the last few weeks. Note that SPY is above its late March high and QQQ remains below this high. Despite short-term relative weakness, QQQ is holding up on the price chart and remains in a short-term uptrend. The early April lows mark key support at 313. A close below this level would reverse the short-term uptrend and call for a pullback.
High-Beta ETF Holds Upswing (SPHB)
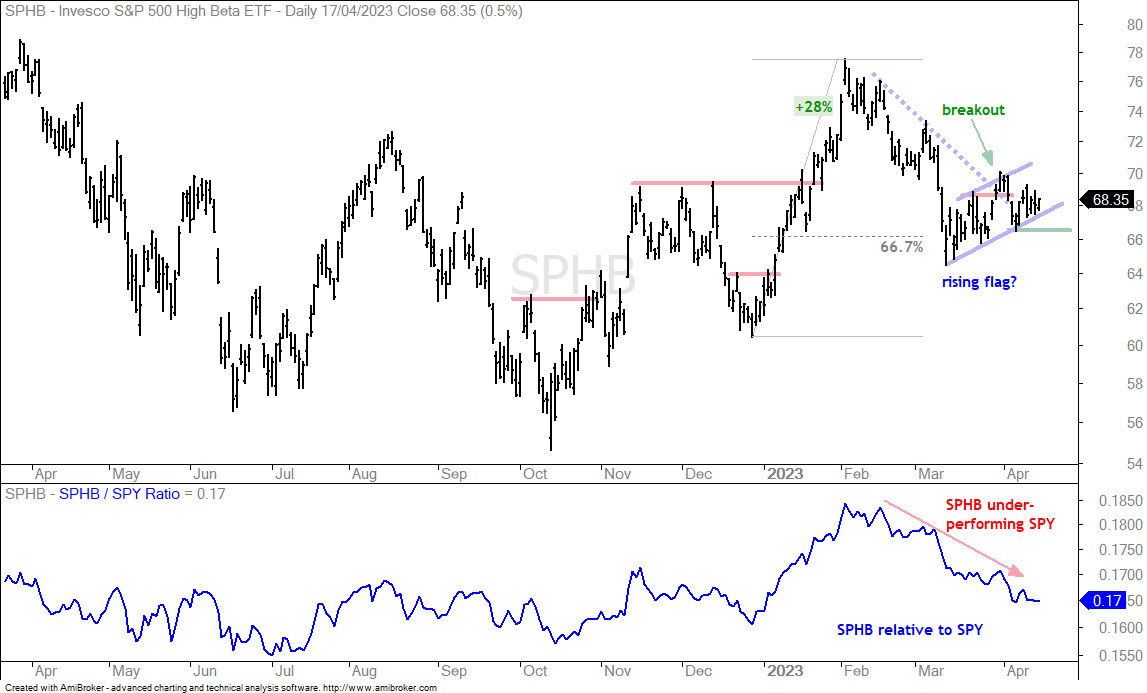
The next few ETFs relate to the high-beta trade, which represents the risk appetite in the stock market. Risk appetite is strong when high-beta issues outperform. Risk aversion is present when high-beta issues underperform. The S&P 500 High Beta ETF (SPHB) started underperforming SPY in February and continues to lag. Even so, the ETF remains in an upswing since mid March and has yet to break down. The bounce since mid March looks like a rising flag, which is a bearish continuation pattern. The immediate trend, however, is up as long as the flag rises. A break below the early April low would reverse this upswing and be bearish for SPHB.
Cloud Computing ETF Holds Breakout (SKYY)
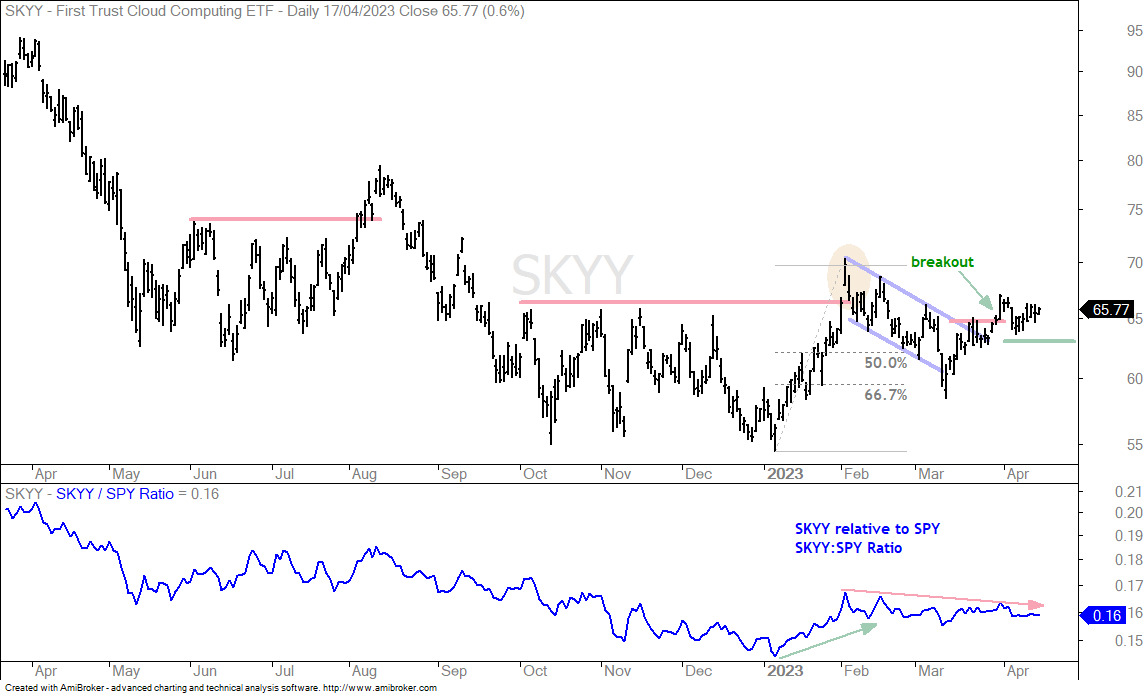
The next chart shows the Cloud Computing ETF (SKYY) leading the market higher from early January to early February and then underperforming the last two months. See the SKYY:SPY ratio in the lower window. On the price chart, SKYY broke out of a falling flag in late March and then stalled around the breakout zone. The breakout is holding for the most part and I am marking my re-evaluation level at 63. A close below this level would negate the breakout and signal some risk aversion in the market.
Fintech and Mobile Payments Break Out (FINX, IPAY)
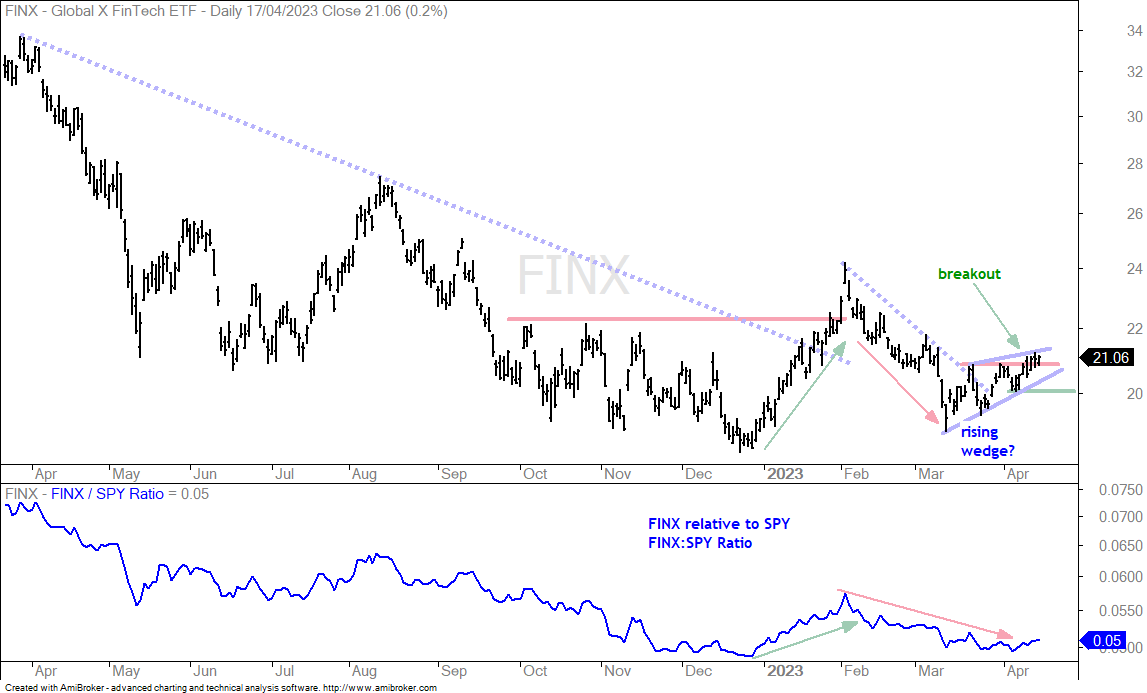
The next chart shows the FinTech ETF (FINX) with a breakout over the last few days and an alternative pattern to watch for a reversal. First, FINX surged from late December to early February (green arrow) and then gave most of these gains back with a decline into mid March (red arrow). FINX reversed its downswing with higher lows the last few weeks and a break above the mid March high. FINX is now bullish until proven otherwise. As far as otherwise, the ETF has a rising wedge working since mid March with support at 20. A break here would reverse the short-term uptrend and signal a continuation lower (risk-off).
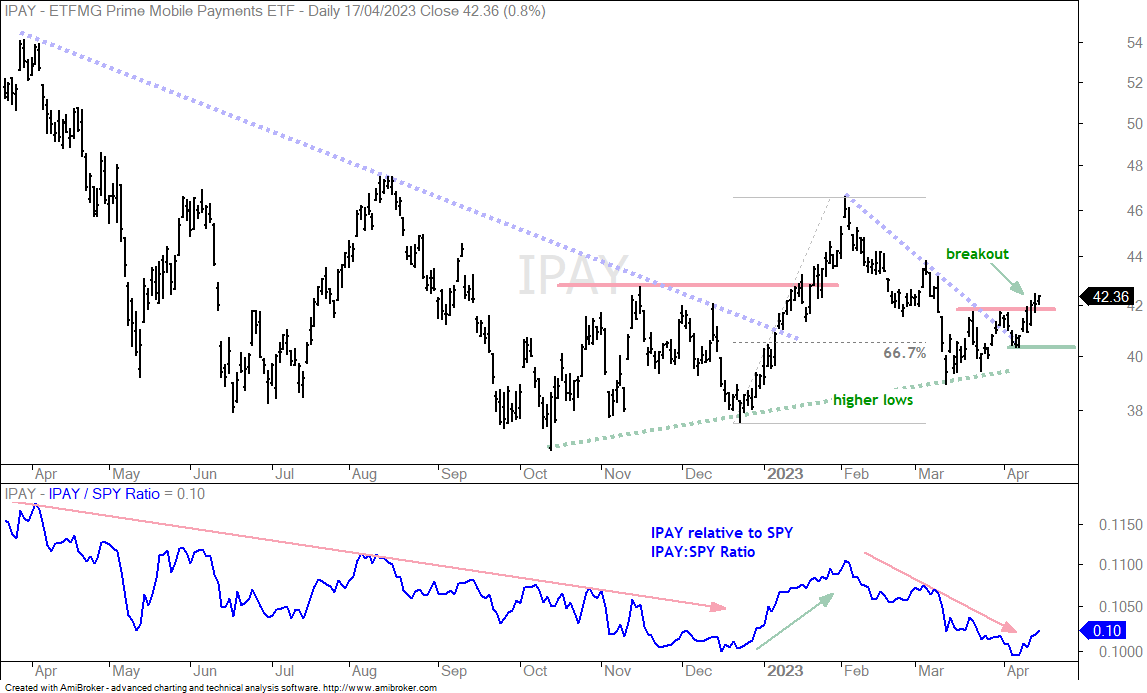
The next chart shows the Mobile Payments ETF (IPAY) with a breakout over the last few days. This breakout follows higher lows in December and March, which suggests an uptrend working. The early April low marks first support and a close below this level would negate the breakout.
Semis Stall as Software Extends (SOXX, IGV)
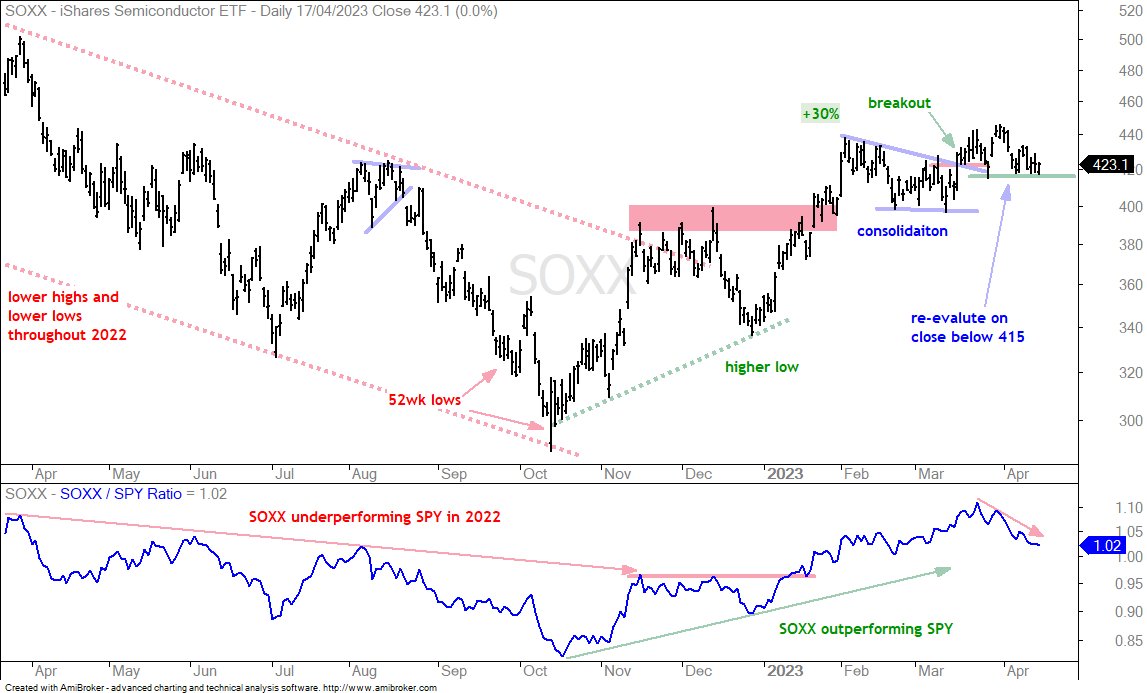
The next chart shows the Semiconductor ETF (SOXX) breaking out in mid March, but failing to extend higher and falling back to the breakout zone. The overall trend is up and the breakout is holding for the most part. The breakout zone turns first support and my re-evaluation level remains at 415. A close below this level would negate the breakout and call for a re-evaluation.
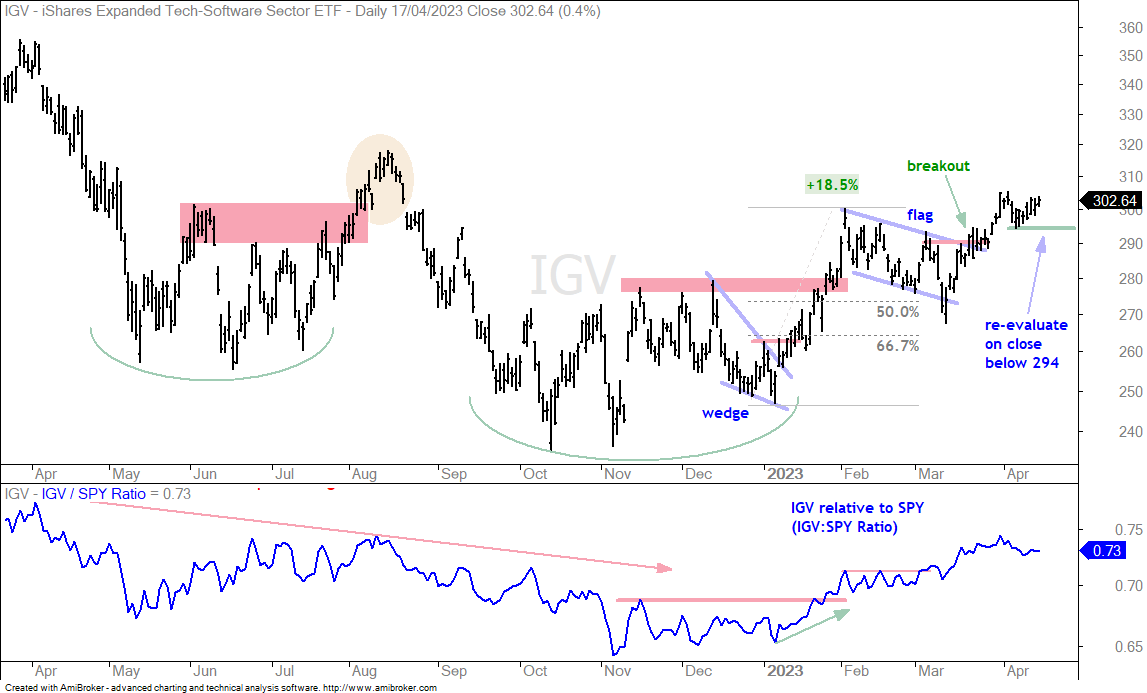
The next chart shows the Software ETF (IGV) with flag breakout in late March and extension higher. The ETF fell back in early April and bounced the last six days to establish support at 294. A close below this level would reverse the short-term uptrend.
Defensive Groups Extend on Breakouts with Big Moves
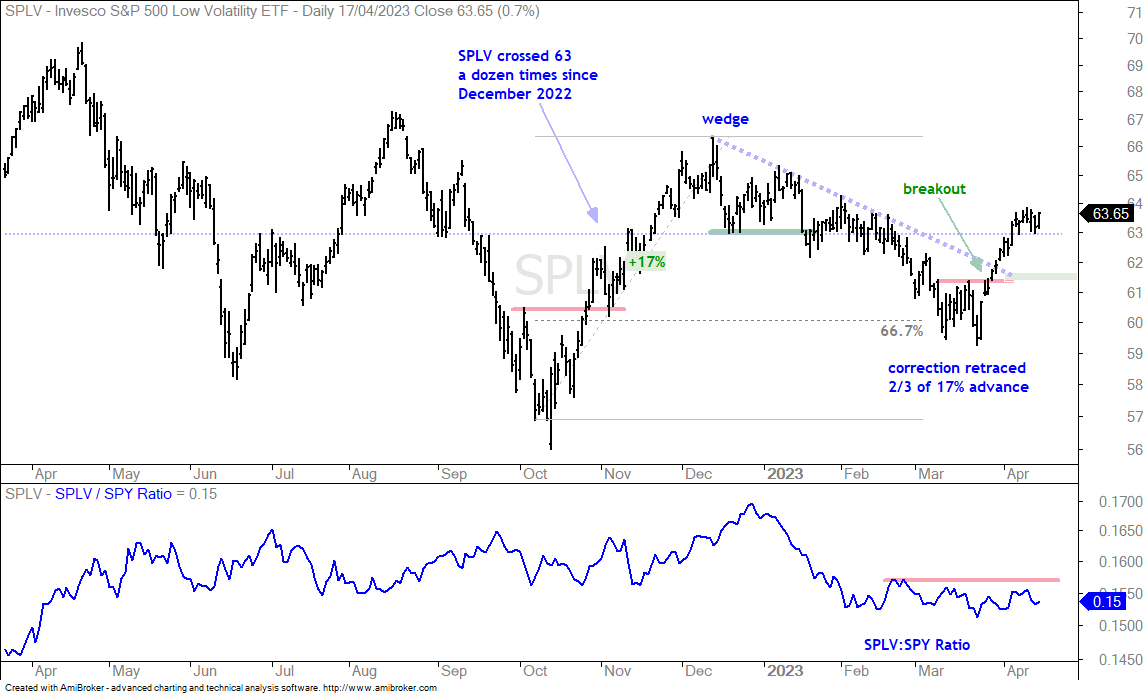
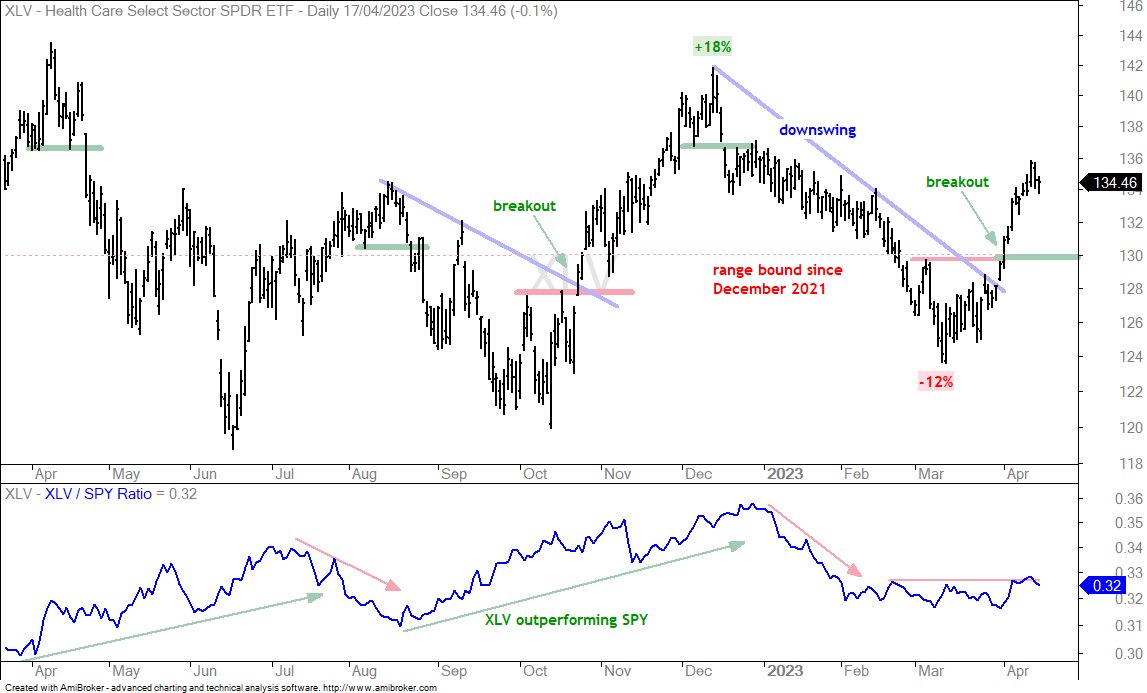
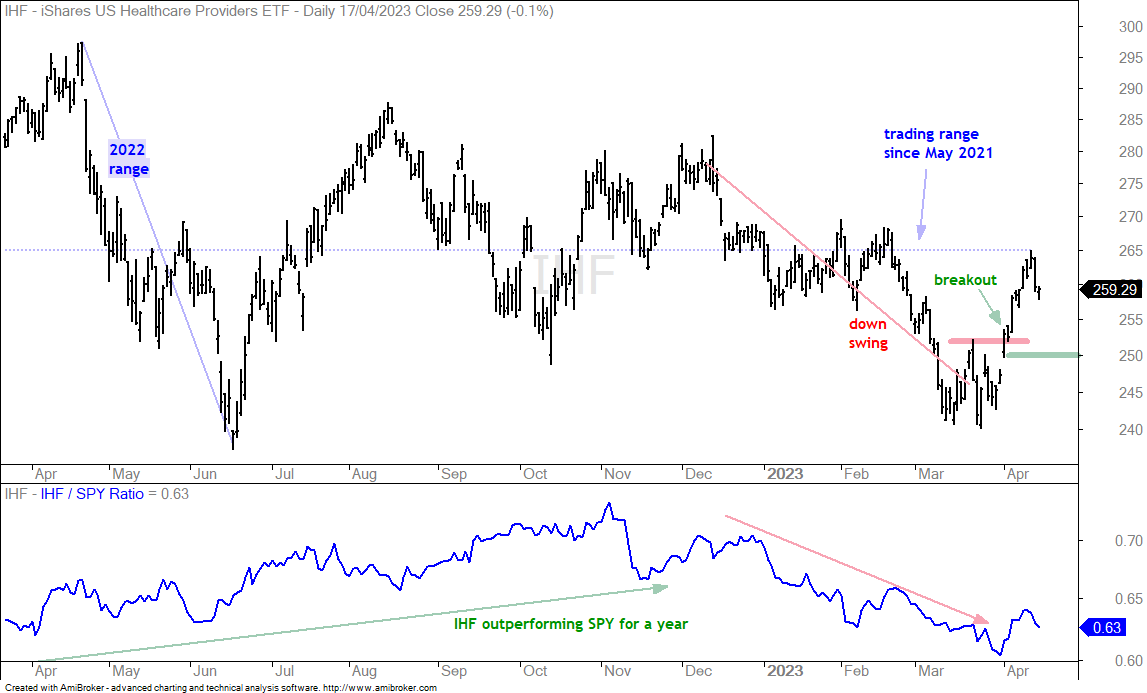
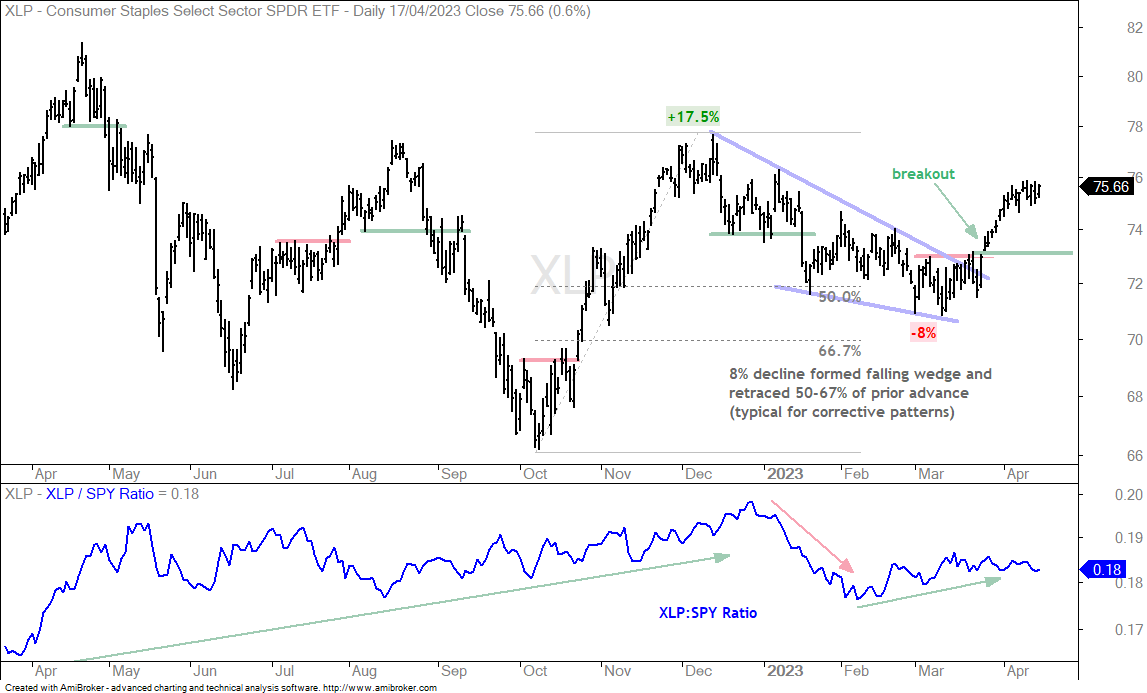
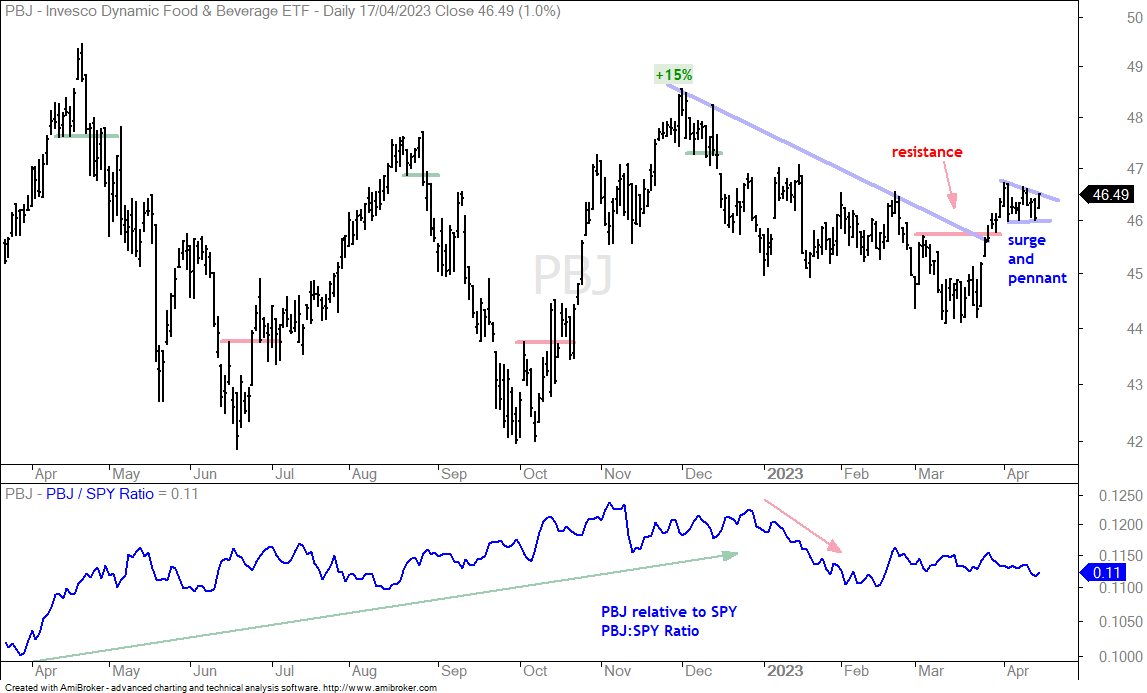
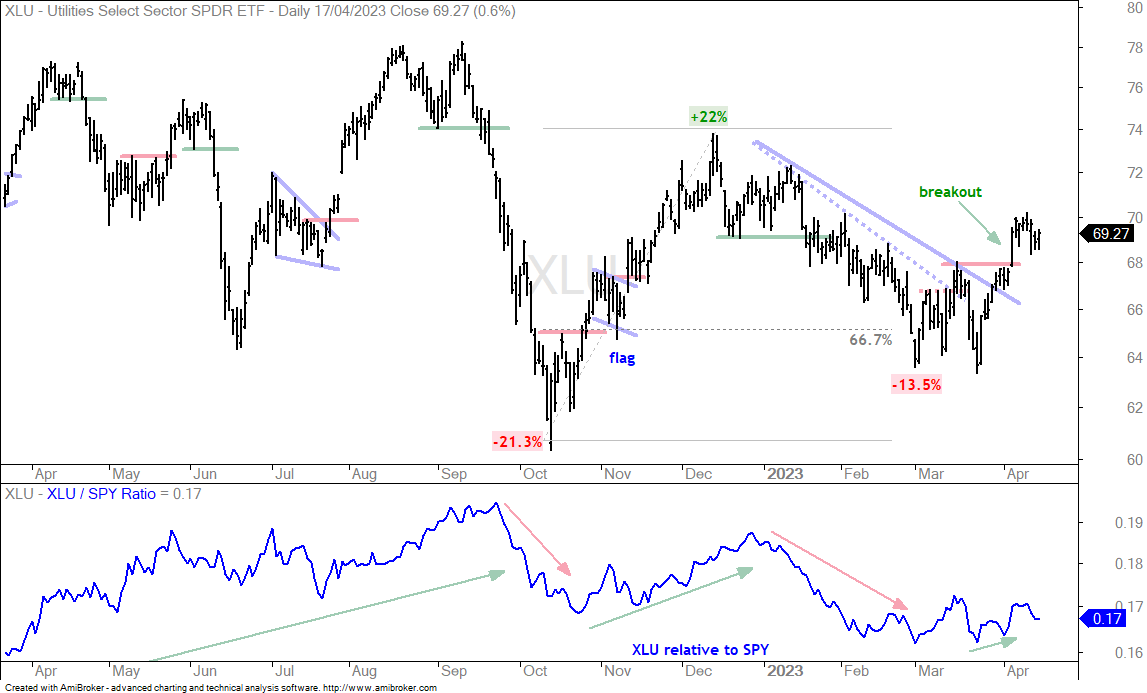
ETFs related to low-volatility, healthcare, consumer staples and utilities surged the last few weeks and reversed their downswings. These ETFs are in long-term trading ranges (12+ months) so I was watching the swings within these ranges for reversals. They broke out with big moves and followed through on these breakouts. There are no setups on the charts right now. The only thing to do now it sit tight, perhaps raise our re-evaluation levels and wait for the next setup or signal.
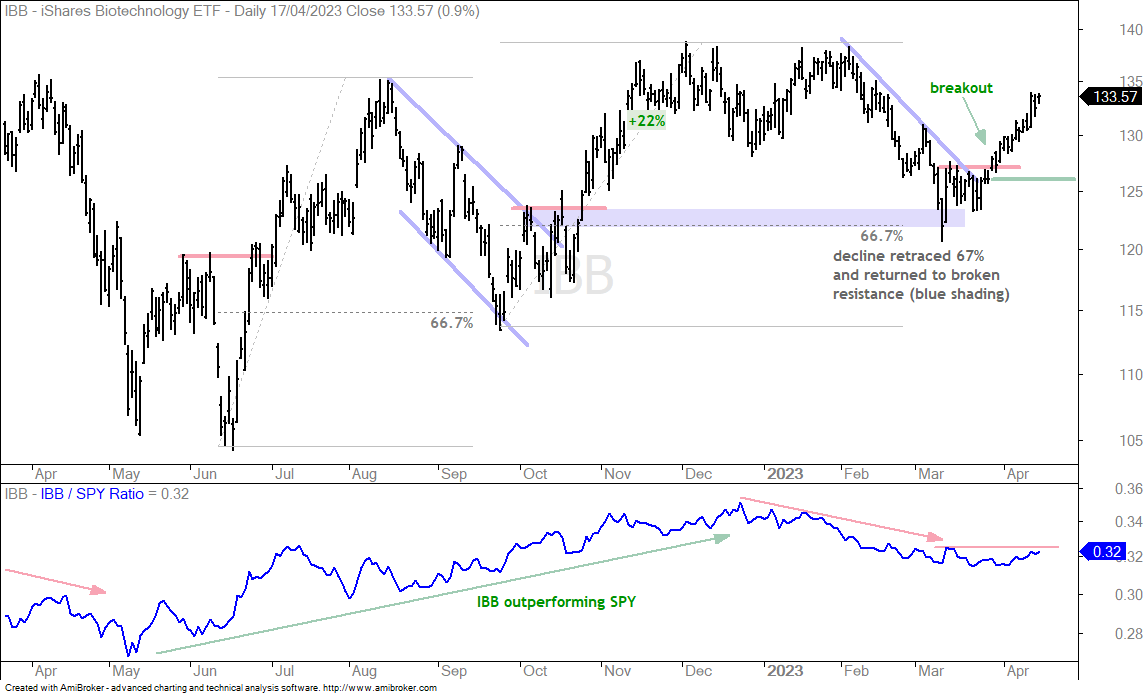
Biotech iShares Extends as Biotech SPDR Breaks Out (IBB, XBI)
The Biotech ETF (IBB) extended on its breakout with further gains the last five days. As with the ETFs above, there is no setup on this chart now. The breakout zone turns first support to watch should we see a throwback. I am raising my re-evaluation to 126, a break of which would negate the breakout.
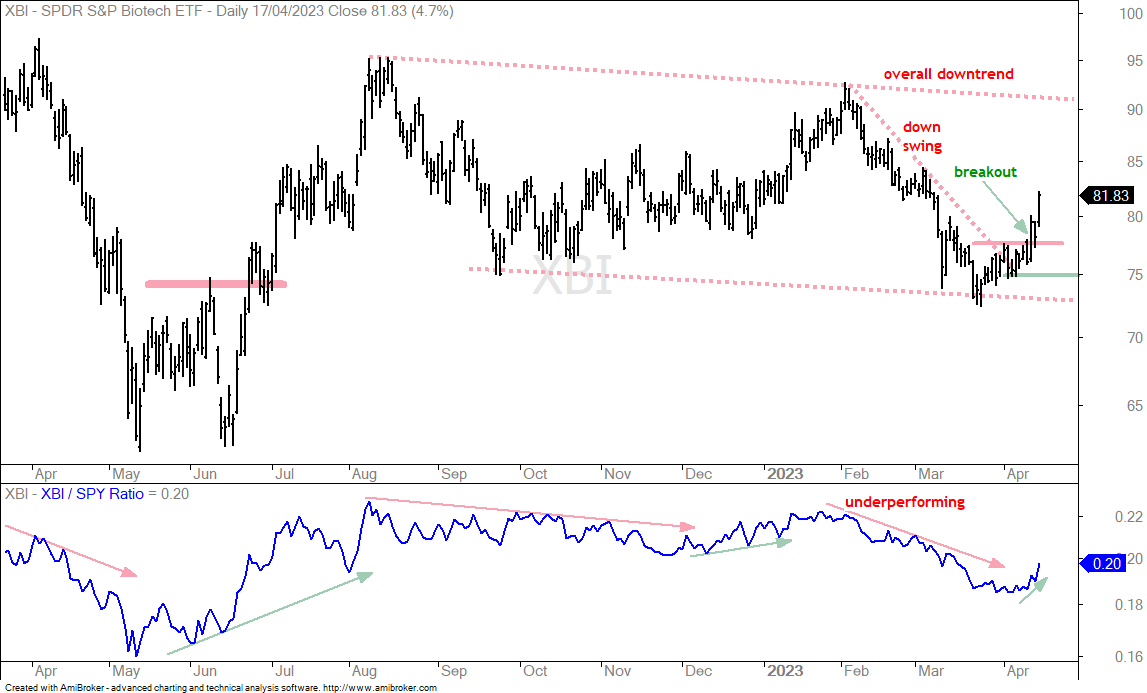
IBB is a cap-weighted biotech ETF with the top ten stocks accounting for 54%. The Biotech SPDR (XBI), in contrast, is an equal weight ETF with the top ten stocks accounting for 12.44%. This means IBB favors large-caps and XBI favors small-caps. Small-caps are currently lagging large-caps and this was also the case with these two ETFs. This dynamic could be changing as XBI surged the last three days and broke short-term resistance. The chart shows XBI in a downtrend since August with lower lows and lower highs. It is not a steep downtrend though. Within the downtrend, the swing was down from February to mid March. XBI reversed this downswing with a breakout and I am setting my initial re-evaluation level at 75.
Can Small-caps Hold their Break outs? (IWM, IJR)
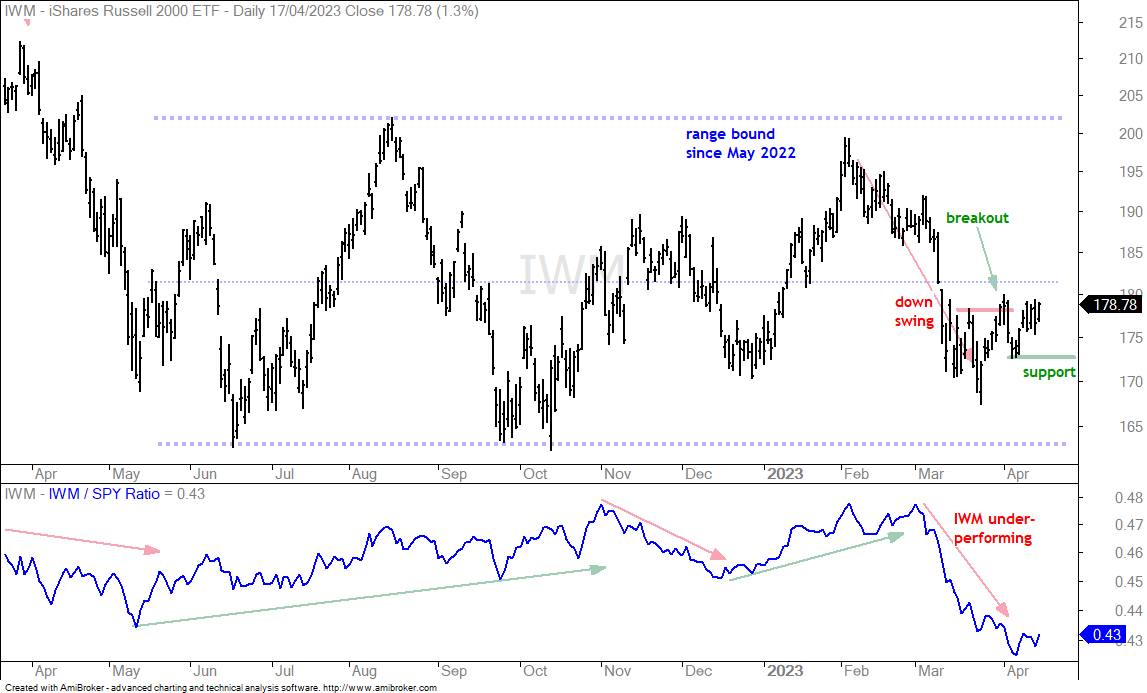
Speaking of small-caps, the Russell 2000 ETF (IWM) is attempting to reverse its downswing with a breakout in late March and higher low in early April. First, note that IWM has been largely range bound since May 2022. There is no trend on this chart and this means I will focus on the swings within the trading range. The swing was down from early February to mid March. IWM reversed this downswing with a breakout in late March. There was a hard throwback in early April, but IWM held above the mid March low and bounced back above 175. The swing is up with the early April low marking support. A break here would be bearish.
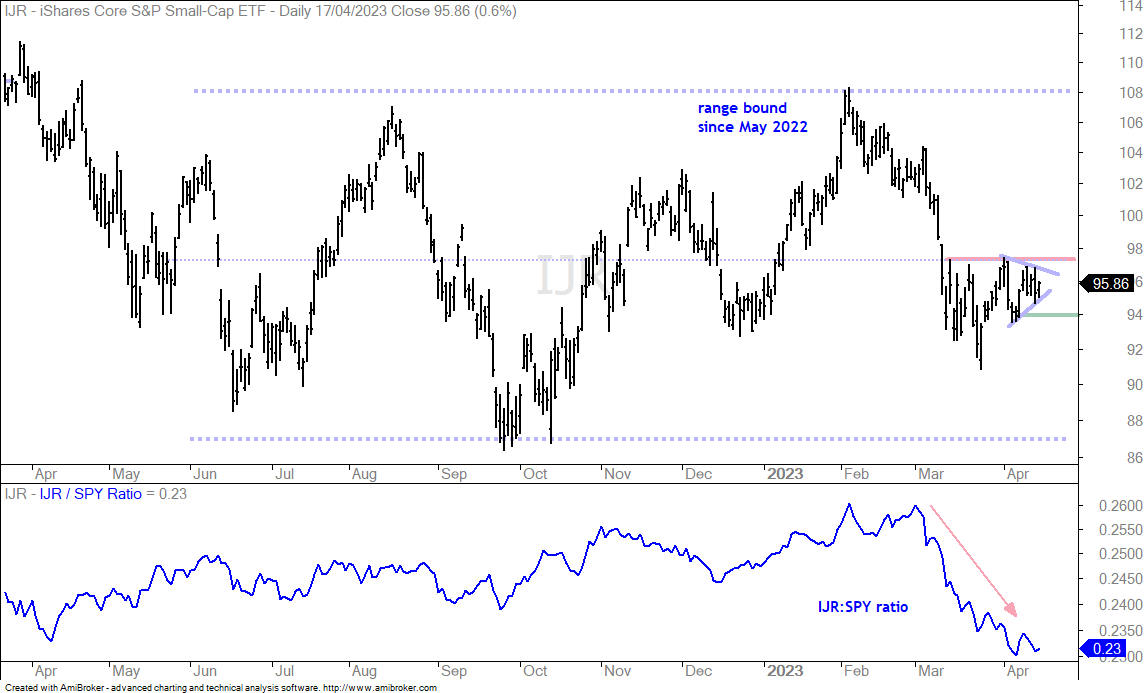
The next chart shows the S&P SmallCap 600 SPDR (IJR) in a downswing since early February because the ETF did not break resistance in late March (red line). Short-term, IJR surged and then consolidated with a pennant in the mid 90s. A break above the red resistance line would reverse the downswing and show strength in small-caps. The early April low still marks support and a break below 94 would be bearish.
RCD, Retail and Housing Maintain Upswings (RCD, XRT, ITB)
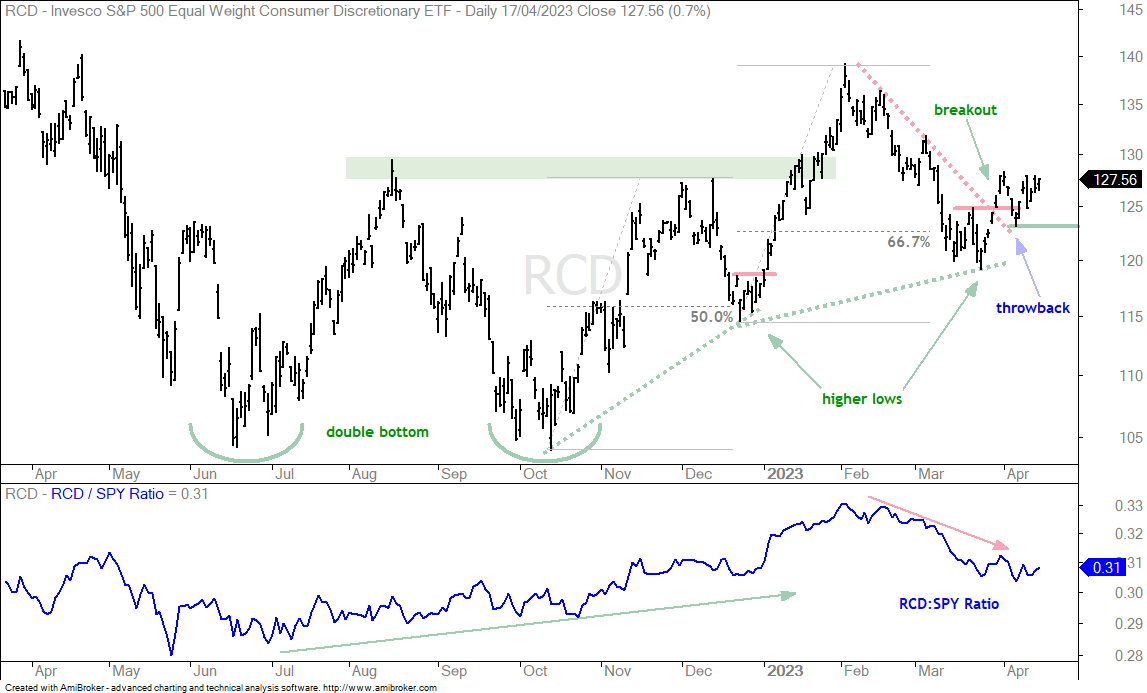
The EW Consumer Discretionary ETF (RCD) represents the most economically sensitive sector, which includes retailers, restaurants, auto manufacturers, hotels and housing. This ETF is in a long-term uptrend and recently reversed its downswing with a breakout in late March. This breakout bodes well for the broad market – as long as it holds. As with many a March breakout, there was a hard throwback in early April and then a bounce the last six days. The short-term trend is up with the early April low marking support.
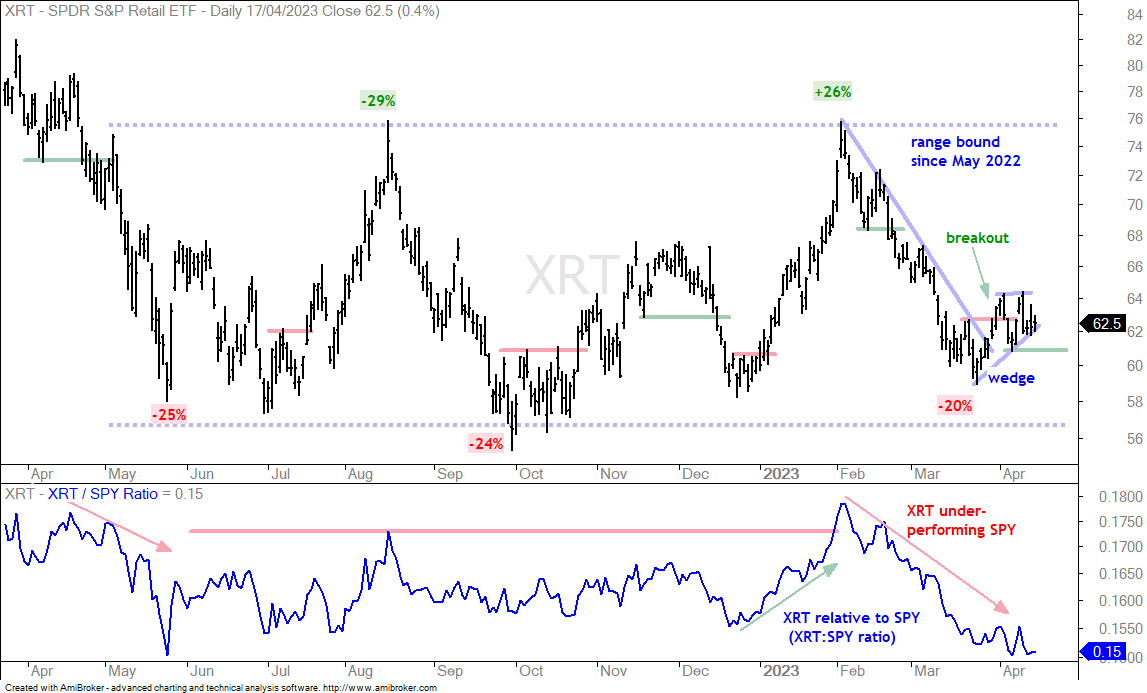
The next chart shows the Retail SPDR (XRT) within a trading range since May. The swing within this range was down from early February to mid March. XRT broke short-term resistance with a surge in late March and there was also a hard pullback after the breakout. XRT also bounced the last six days and the short-term trend is up. The bearish alternative here is a small rising wedge the last few weeks. A break below support at 61 would reverse this short-term uptrend and be bearish.
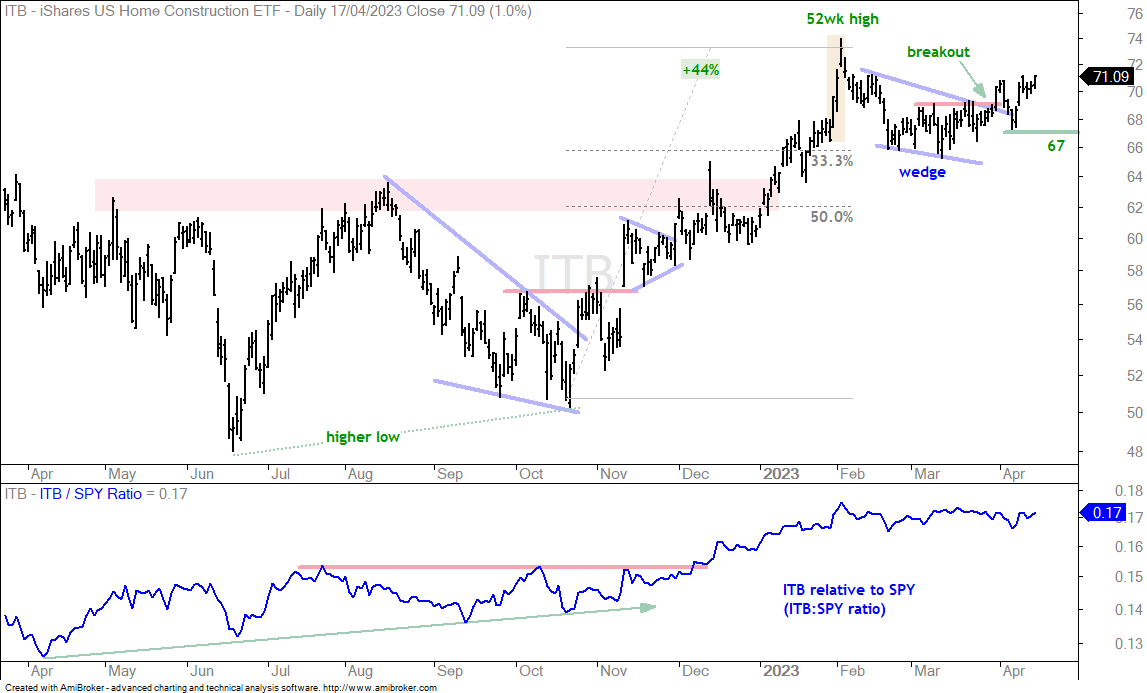
The Home Construction ETF (ITB) is one of the strongest ETFs right now because it is very close to a 52-week high. The chart below shows ITB hitting a 52-week high in February, correcting into March with a falling wedge of sorts and breaking out in late March. ITB fell back with the rest of the market in early April, and then bounced the last six days. Support is set at 67 and this chart is bullish as long as support holds.
Palladium and Copper Get Break Outs (PALL, CPER)
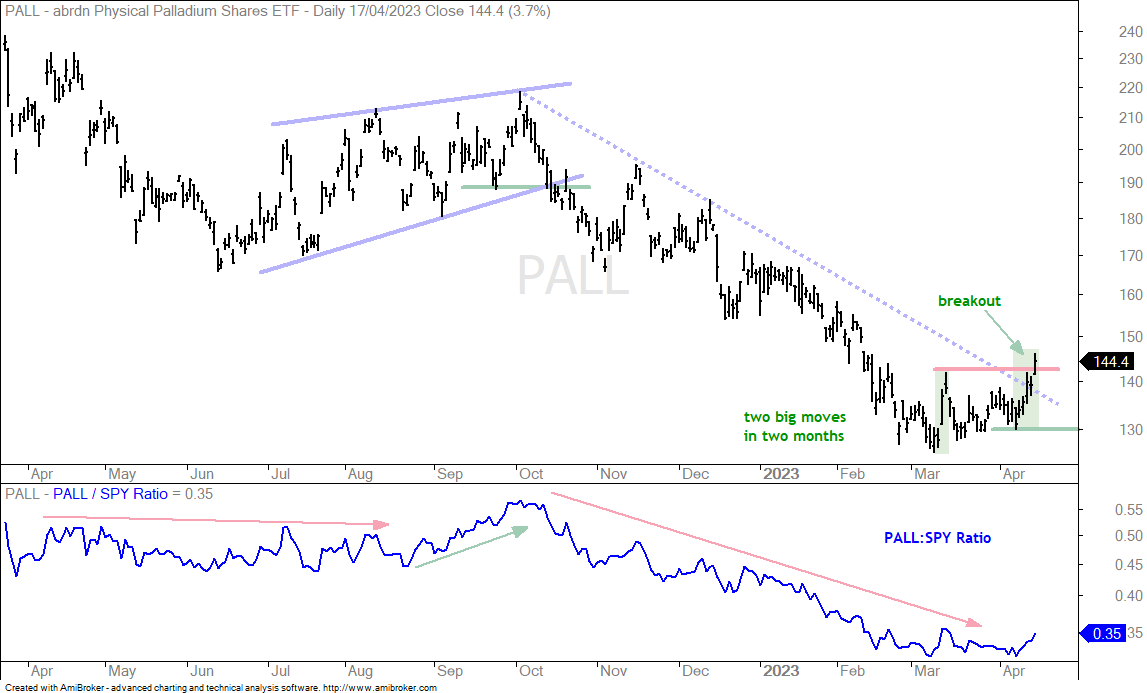
The Palladium ETF (PALL) has been one of the weakest ETFs over the last six months (-22%). In contrast, SPY is up 15.75%, while the Gold SPDR (GLD) and Copper ETF (CPER) are up over 20%. PALL could be turning the corner because price broke above the March high with a 6.57% surge the last six days. This is the second big surge in as many months because PALL surged 7.26% in early March. PALL also broke the October trendline and the mid March high this week. This is a trend reversal as far as I am concerned and I will mark initial support at 130.
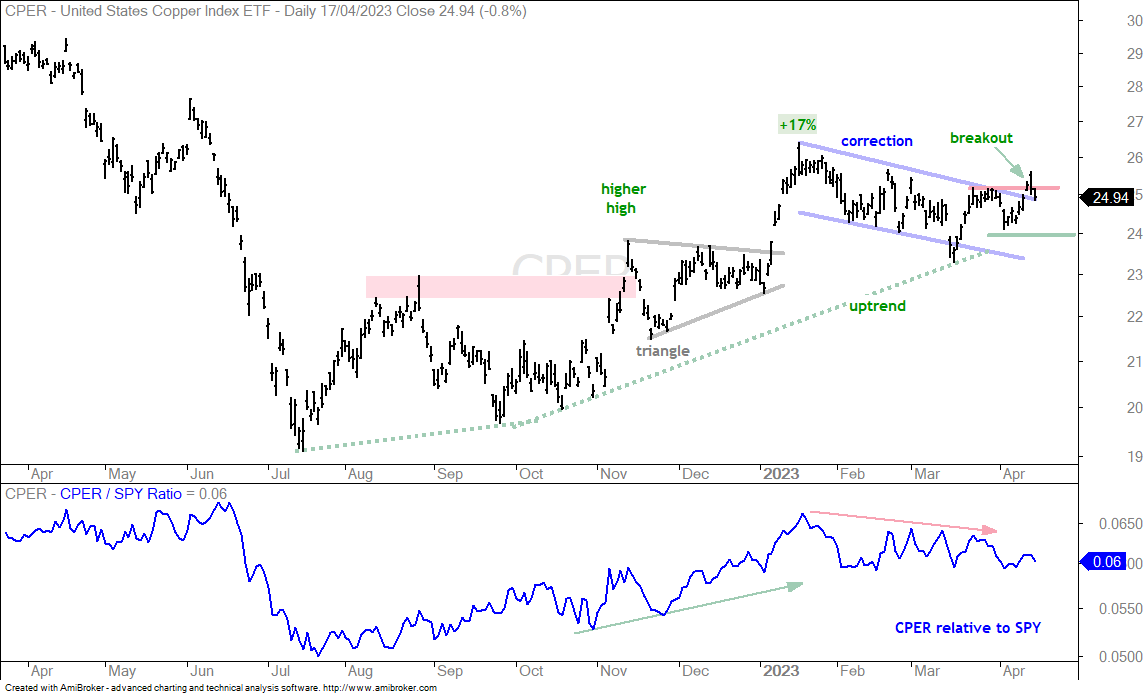
The next chart shows CPER breaking above the late March high with a surge last week. The ETF fell back after this surge, but a breakout is still in the making here. Overall, CPER is in a long-term uptrend (green dashed lines) and the decline since January is considered a correction within that uptrend. The breakout signals an end to this correction and a resumption of the bigger uptrend. The early April low marks first support at 24.
Gold SPDR Tests First Support (GLD – plus PLTM)
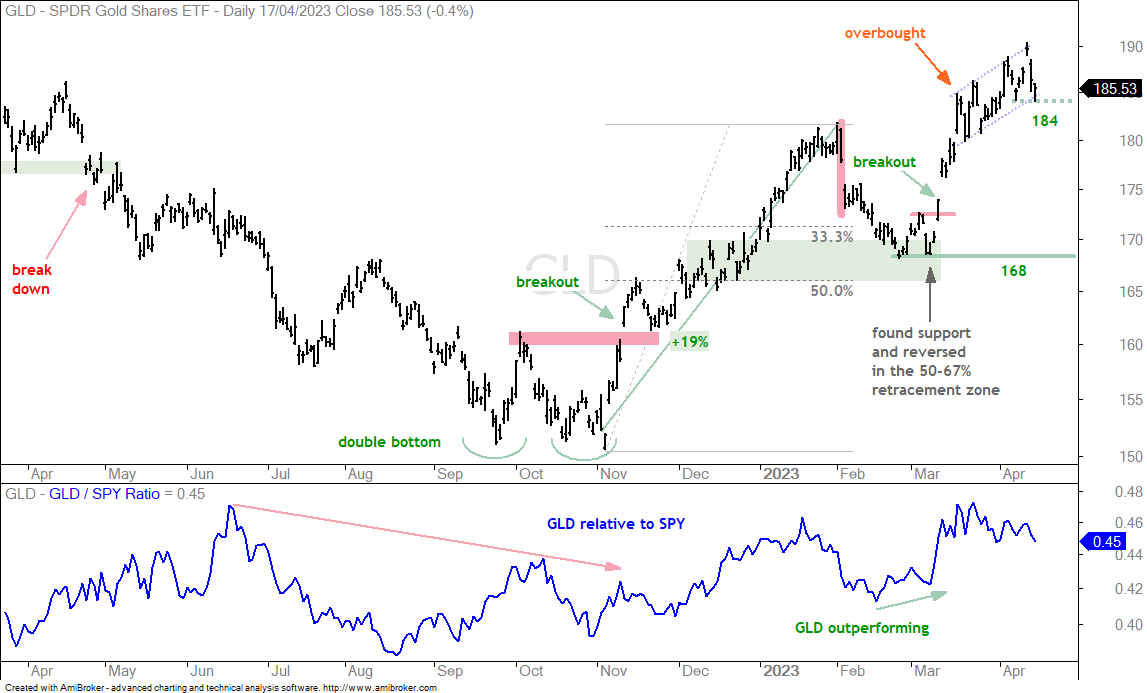
The Gold SPDR (GLD) is in a long-term uptrend and a short-term uptrend. Short-term, the ETF surged above 185 in mid March, became overbought and then worked its way higher the last few weeks. The blue dashed lines show a rising channel with support marked at 184. A close below this level would reverse this short-term uptrend and argue for a correction within the bigger uptrend. Note that the Silver ETF (SLV), Gold Miners ETF (GDX), and Silver Miners ETF (SIL) will likely follow GLD.
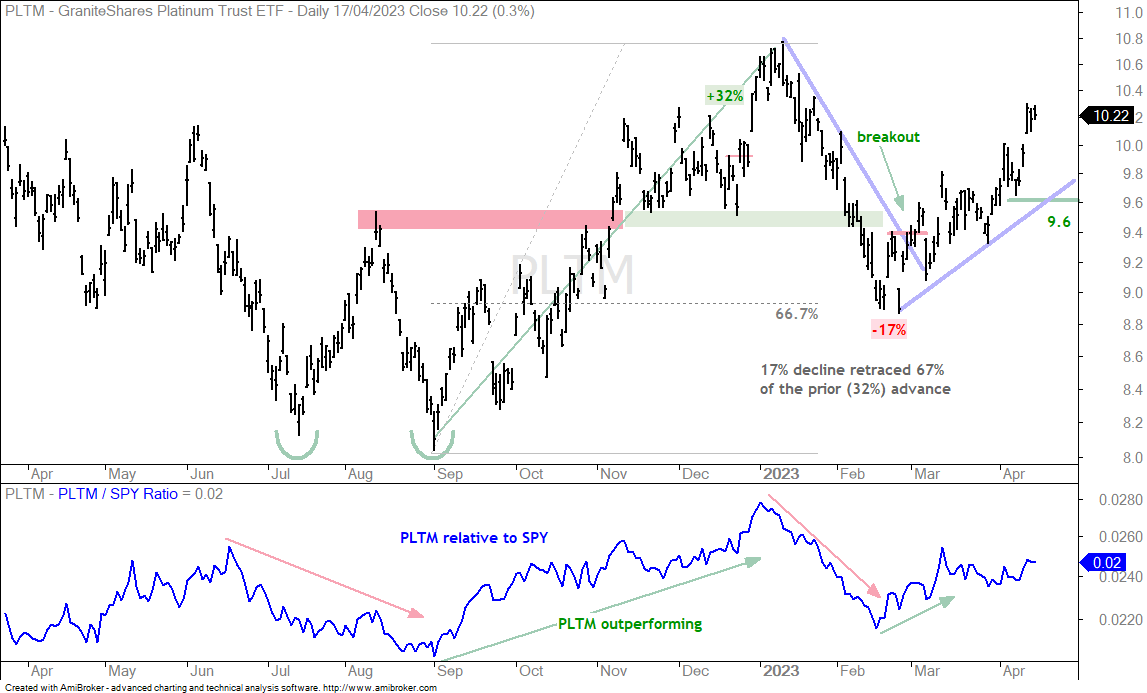
The next chart shows the Platinum ETF (PLTM) extending its uptrend as it surged 5% the last five days. With this move, I will raise my re-evaluation level to 9.6, which is marked by the early April low.