")
ETFDB.com and ETF.com Ratings
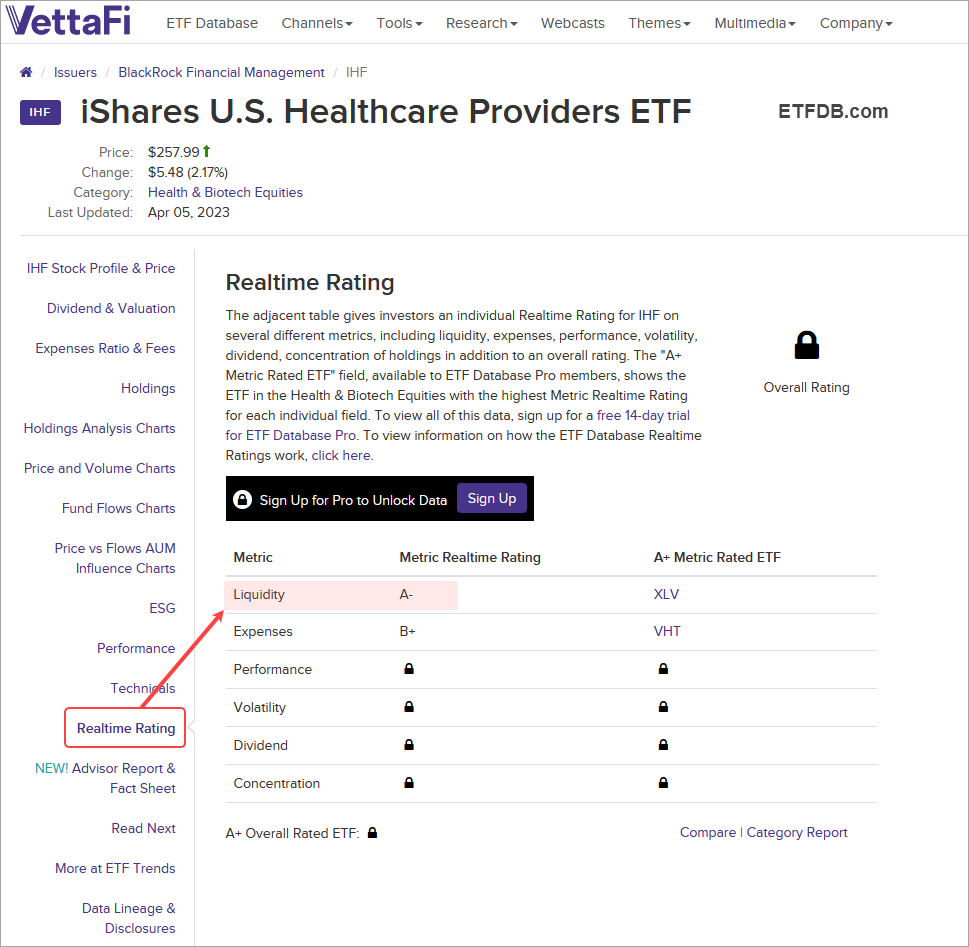
You can find liquidity scores at ETF.com (here) and ETFDB.com (here). ETF.com rates liquidity on a scale of 1 to 5 with 5 being the most liquid. This is based on the ability to move a $1,000,000 block. ETFDB.com grades liquidity from A to F with A+ being the best.
The Healthcare Providers ETF (IHF) trades on average 55,000 shares per day (250-day SMA of volume), but has a liquidity rating of A- on ETFDB.com. This is because the bid-ask spread is relatively small and the holdings are very liquid. IHF has a liquidity score of 5 on ETF.com.
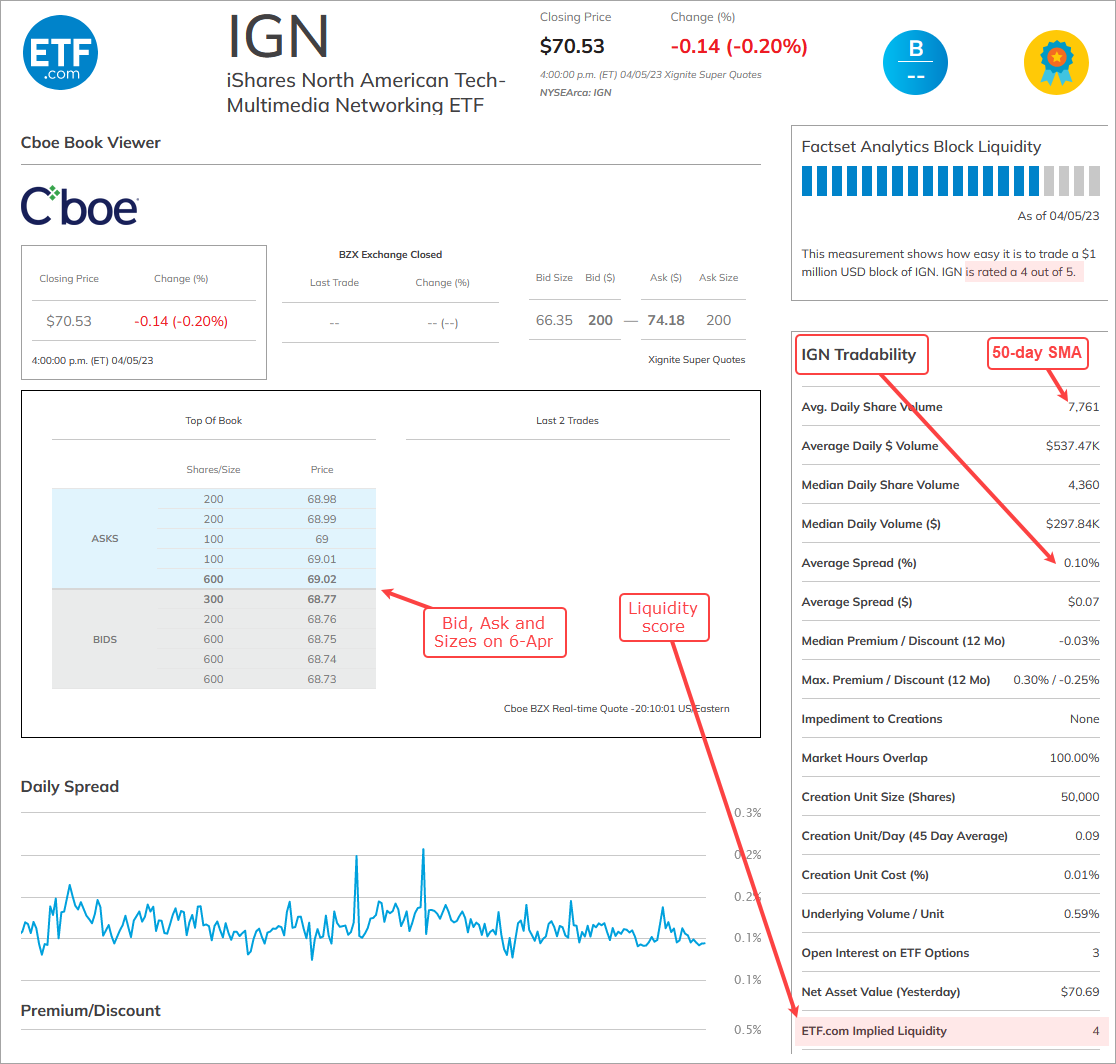
The Networking ETF (IGN) trades 7,761 shares per day (50-day SMA), Despite such low volume, the image below shows that the ETF.com liquidity rating is 4 (out of 5). This measures the ease of trading a $1 million share block. The average bid-ask spread is .10%, which is .001 in decimals. The blue/gray shading shows the current bid, ask and size on April 6th.
Bid-Ask Spread Matters
The bid-ask spread matters because a market sell order would be filled at the ask, or perhaps even lower. Traders can consider placing a limit order at the asking price or a few cents below the ask to control slippage. Liquidity is not an issue for SPY, QQQ, TLT and GLD. These ETFs also have very tight bid-ask spreads and market orders are fine. ETFs with lower trading volume tend to have higher bid-ask spreads.
Here are some average bid-ask spreads from ETF.com:
- Healthcare Providers ETF (IHF): .08%
- Equal-weight Materials ETF (RTM): .08%
- Equal-weight Healthcare ETF (RYH): .13%
- Networking ETF (IGN): .10%
- Food & Beverage ETF (PBJ): .10%
- Small-Cap Utilities Sector (PSCU): .25%
- Coffee ETF (JO): .27%
I am aware of slippage and the bid-ask spread when testing trading strategies. As such, I include .25% slippage on the entry and the exit. This is one quarter of one percent (.25% is .0025). This slippage component is designed to cover any liquidity issues.
In general, I would note that the equal-weight sector ETFs have liquidity grades of B at ETFDB.com. This is probably because of the low average volume and the modest bid-ask spreads. Note that these ETFs trade stocks in the S&P 500, which are very liquid and this positive for the liquidity score. These ETFs include: EWCO, RCD, RHS, RYE, RYF, RYH, RGI, RTM, EWRE, RYT, RYU.
Dollar-Volume Also Matters
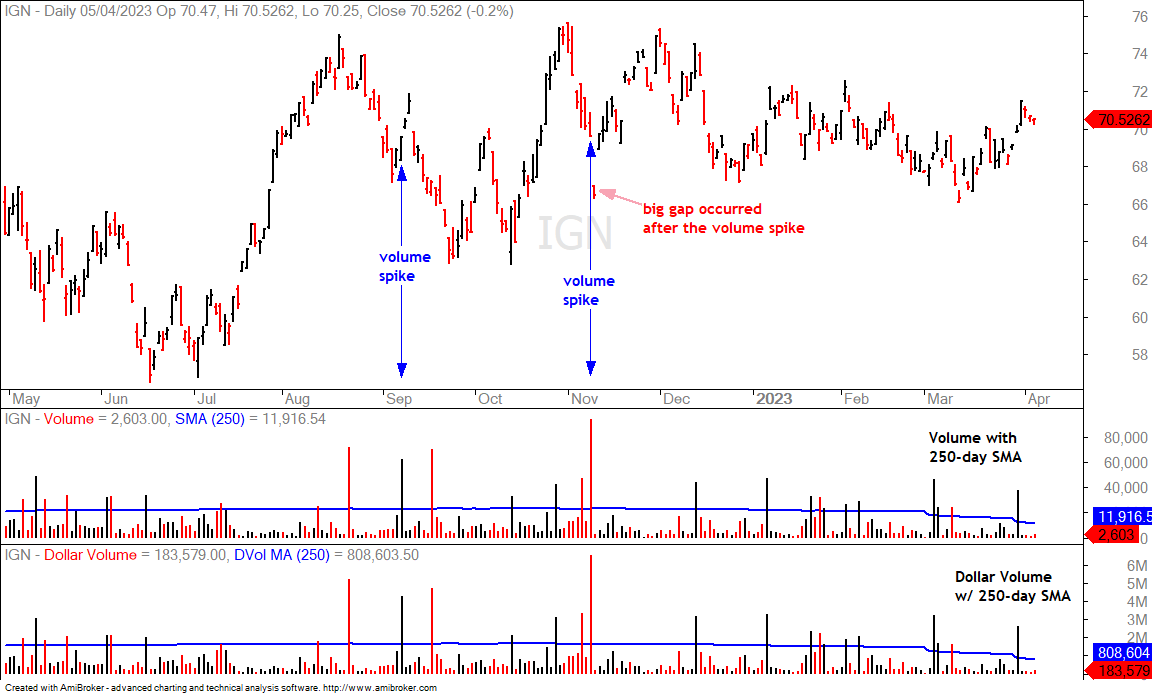
I also consider Dollar-Volume for liquidity. This is price multiplied by volume. The equal-weight sector ETFs and IGN are part of the Trend and ROC-Momentum Rank Strategy, which trades 74 stock-based ETFs. IGN has the lowest Dollar-Volume of this group: the 250-day average is $808,604. The chart below shows Dollar-Volume in the lower window and volume in the middle window. There are volume spikes and the ETF can handle these spikes because its holdings are liquid.
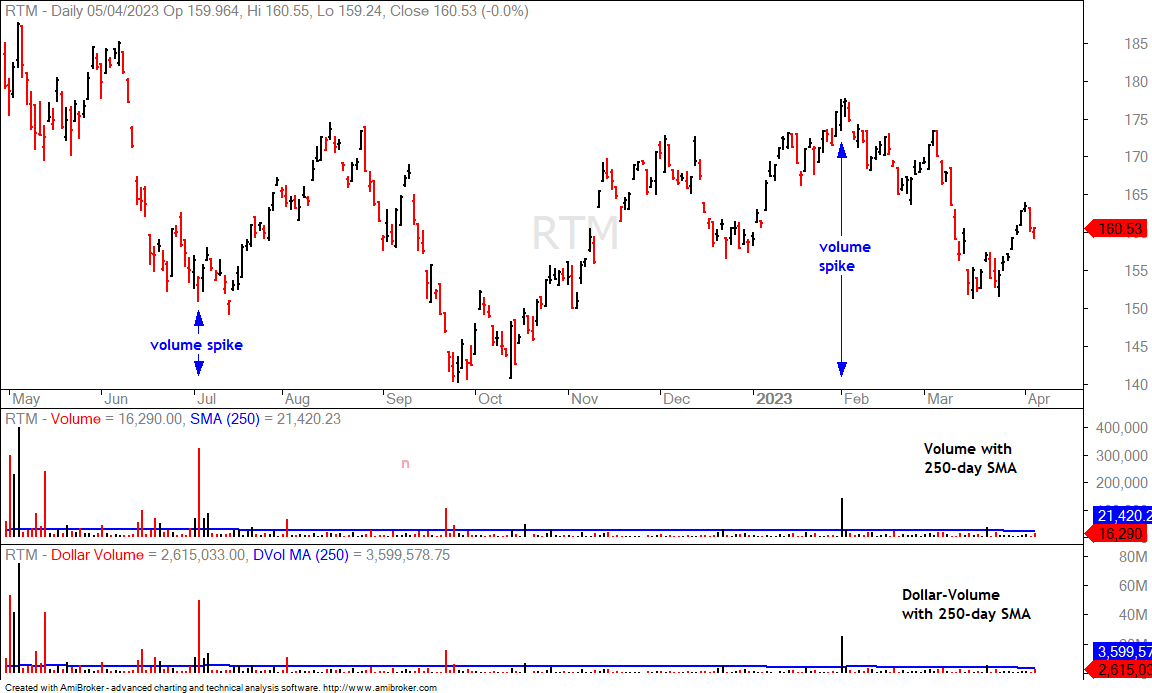
The next chart shows the EW Materials ETF (RTM), which averages just 21,420 shares per day. Note that I am showing a 250-day average to get the average for an entire year. RTM volume is less “spikey” than IGN volume, but there are still some spikes and the ETF can absorb these because its holdings are liquid. Note that the 250-day average for Dollar-Volume is $3,599,578. This is more than four times the Dollar volume of IGN. A $10,000 position in RTM would require 62 shares, while a $10,000 position in IGN would require 142 shares.
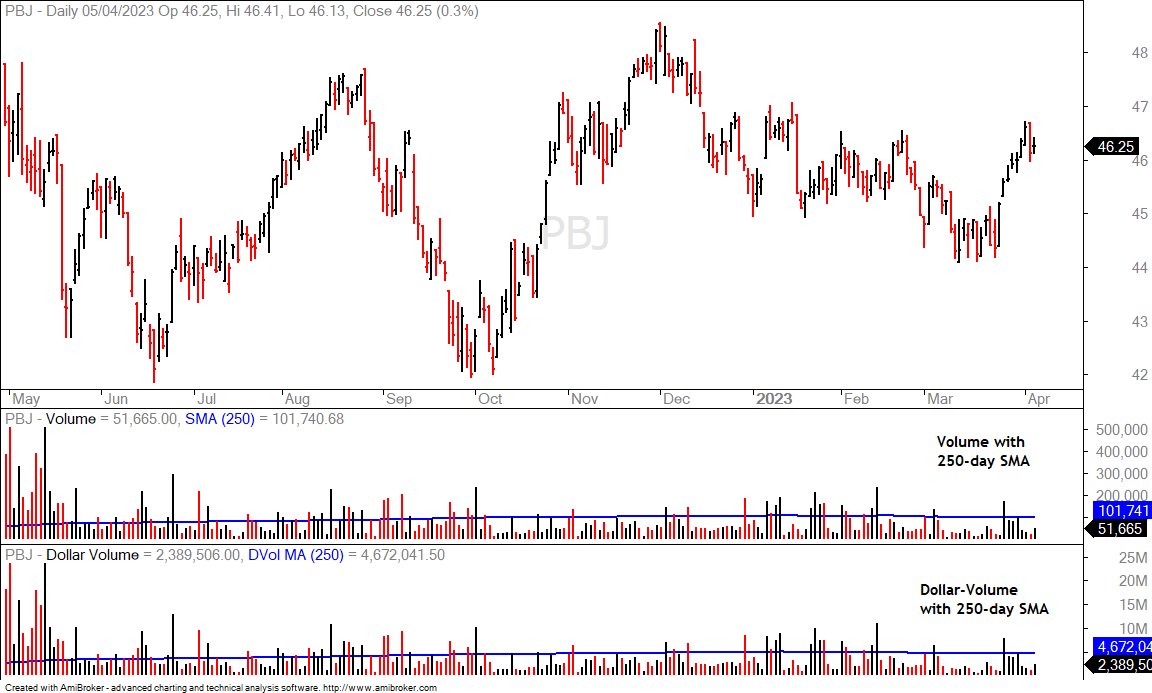
The next chart shows the Food & Beverage ETF (PBJ). This ETF averages just 101,741 shares volume per day, but Dollar-Volume averages $4,672,041 per day. This is enough to facilitate a position between $10,000 and $20,000, but a trade in the $1,000,000 range may move the bid-ask spread. Even so, this ETF holds liquid stocks and this is why it can absorb a relatively big order.
Trading Universe for ETF Strategies
Choosing the trading universe is one of the first steps for a trading strategy. Frankly speaking, choosing an ETF universe is a big pain in the buttocks. Stock strategies have it relatively easy because we can simply select the constituents for an index, such as the S&P 500, Russell 2000 or Nasdaq 100. ETFs are basically like mutual funds and they come in many different forms. For a trading strategy, I am looking for passively managed ETFs with price data back to at least 2007. I am also trying to limit duplication because we do not need five tech sector ETFs.
The All-Weather ETF Strategy trades 50 ETFs with minimal overlap and price data to at least 2007. The Trend and ROC-Momentum Rank Strategy trades 74 stock-based ETFs with price data to at least 2007. The vast majority of ETFs in these two groups have liquidity grades of 5 on ETF.com, but some are on the second tier with 4s. The Mean-Reversion Strategy Trades a broad basket of ETFs (138) with trading history to at least 2007. Some of the ETFs in this universe also have lower liquidity scores. These include EWK (3), PDB (4), CUT (4) and PSP (4).
The bid-ask spread is probably the most important metric for traders. Slippage should be contained as long as the spread remains narrow (.01% to .15%). This amount is more than covered by the backtests for the trading strategies. Slippage may become an issue should the spread exceed .25%. You can check the average slippage at ETF.com.
Systematic Strategies and Tables
Here are the three active strategies and their respective tables.