About the ETF Trends, Patterns and Setups Report
This report contains discretionary chart analysis based on my interpretation of the price charts. This is different from the fully systematic approach in the Trend Composite strategy series. In this ETF Trends, Patterns and Setups report, I am looking for leading uptrends and tradable setups within these uptrends. While I use indicators to help define the trend and identify oversold conditions within uptrends, the assessments are mostly based on price action and the price chart (higher highs, higher lows, patterns in play). Sometimes the chart assessment can be at odds with the indicators.
Report Schedule
- Tuesday – 10 Jan: Market and ETF Report
- Wednesday – 11 Jan: Market Regime and ETF Video
- Thursday – 12-Jan: Mean-Reversion Strategy for Trading ETFs
- Friday – 13-Jan: Seasonality Report
Going More Systematic
As the schedule above shows, I will publish a mean-reversion strategy for trading ETFs on Thursday and a seasonality report on Friday. This starts the move towards a more systematic approach to trading and investing. Chart analysis is quite subjective and I am not sure if a subjective approach can consistently outperform a rules-based systematic approach.
Market Regime is Bearish for Stocks
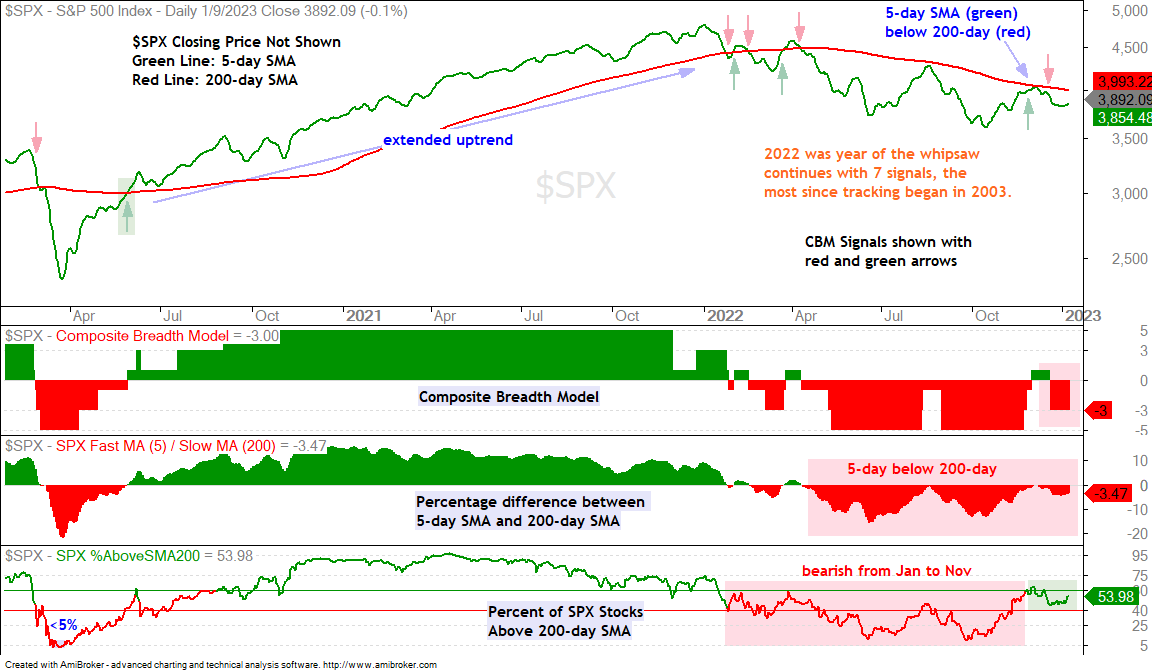
The Composite Breadth Model turned negative on December 19th and remains at -3, which means four inputs are bearish (-4) and one is bullish (+1). The 5-day SMA for the S&P 500 is below the falling 200-day SMA and this bearish cross has been active since April 11th. Despite a bearish CBM and 5/200 cross, 54% of S&P 500 stocks are above their 200-day SMAs. This internal measure suggests a split market with more than half of S&P 500 stocks in uptrends.
The Composite Breadth Model sets the tone for stocks and stock-based ETFs. A negative CBM means we are in a bear market environment and risk is above average for stocks and stock-based ETFs. Some stocks might buck the bear market, but it is difficult to pick winners and the risk of loss is above average. This is a time to preserve capital and wait for the next bull market.
SPY Stalls after Short-term Reversal (SPY)
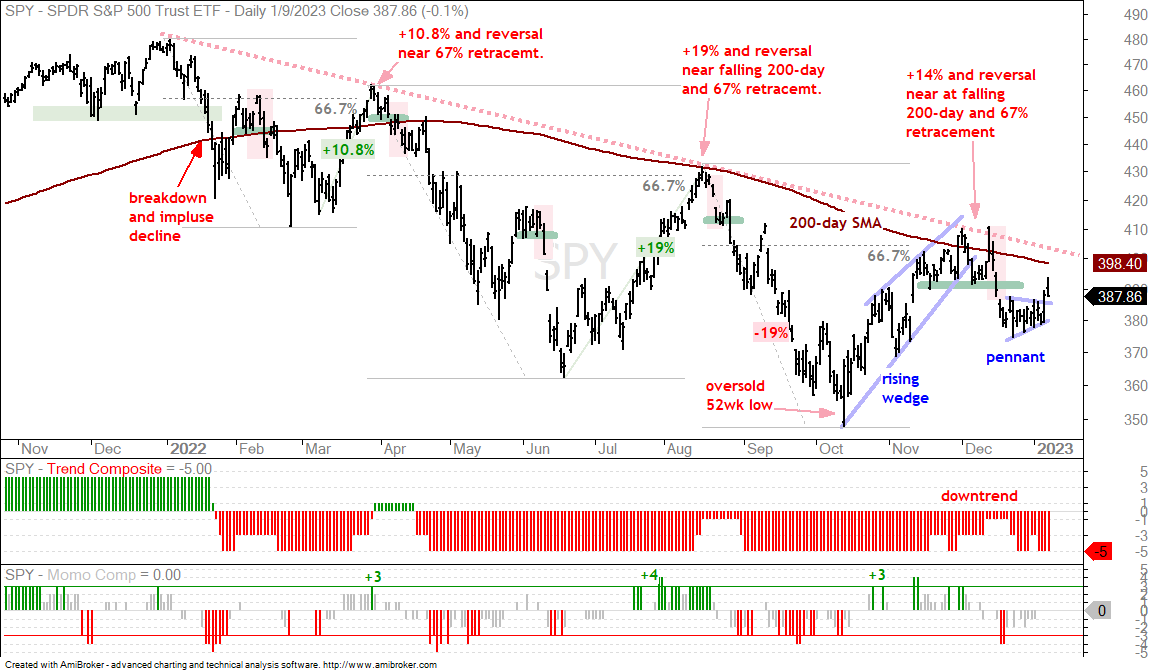
The S&P 500 SPDR (SPY) remains in a long-term downtrend with the red dashed line marking the lower highs throughout 2022. There were three double-digit counter-trend advances and these failed near the 67% retracement lines (red arrows). Most recently, SPY advanced some 14% from mid October to early December and reversed the counter-trend advance with a break below 390 on January 15th. The retracement amount (2/3) and pattern (rising wedge) are typical for bear market bounces. This breakdown signals a continuation of the bigger downtrend and I expect a test of the October lows.
Short-term, SPY broke down in mid December and then stalled with a pennant. SPY did not break pennant support and did not continue lower. Instead, SPY broke to the upside with a 2.3% advance on Friday. While this seems short-term bullish, the long-term downtrend remains the dominant force. Upside breakouts have a greater chance of failing in such conditions.
Chart Analysis versus a Systematic Approach
Pennants, flags, rising wedges and patterns are for chart analysis and do NOT play a part in systematic strategies because they are hard to quantify. With the long-term trend down, a systematic strategy would likely wait for a bounce and sell into strength. Systematic approaches also have subjective elements because we must choose an indicator, set the parameters and define an overbought level (e.g. RSI(5) above 70). We can then test these subjective inputs and quantify results to see if the strategy actually works. I cannot accurately test pennants, flags, wedges and other patterns.
Even though chart analysis is subjective, we can still apply rules and increase objectivity. Here are some rules to consider:
- Trade in the direction of the bigger trend.
- The broad market environment is the most important factor for stocks.
- Play defense in bear markets and offense in bull markets.
- Focus on bullish setups when the bigger trend is up.
- Ignore bullish setups when the bigger trend is down.
Bonds Surge and Rates Fall in January (TLT, $TNX)
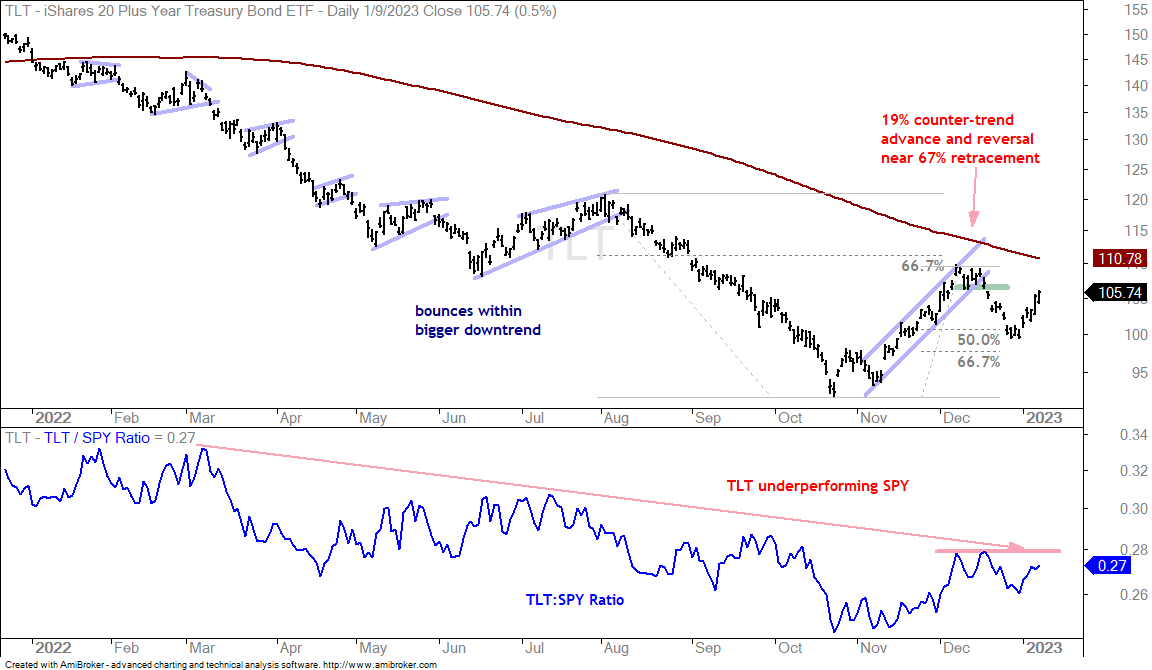
The 20+ Yr Treasury Bond ETF (TLT) is off to the races here in 2023 with a 6.2% surge the first five trading days of the year. The long-term trend is still down because TLT is below the falling 200-day SMA, the ETF recorded a 52-week low in October and the ETF has yet to forge a higher high. Short-term, TLT reversed in the 50-67% retracement zone and this is the start for a higher low. A move above the December high would forge a higher high and reverse the long-term downtrend. The TLT:SPY ratio remains in a downtrend and TLT is still largely underperforming SPY. TLT would start outperforming with a break above the December highs.
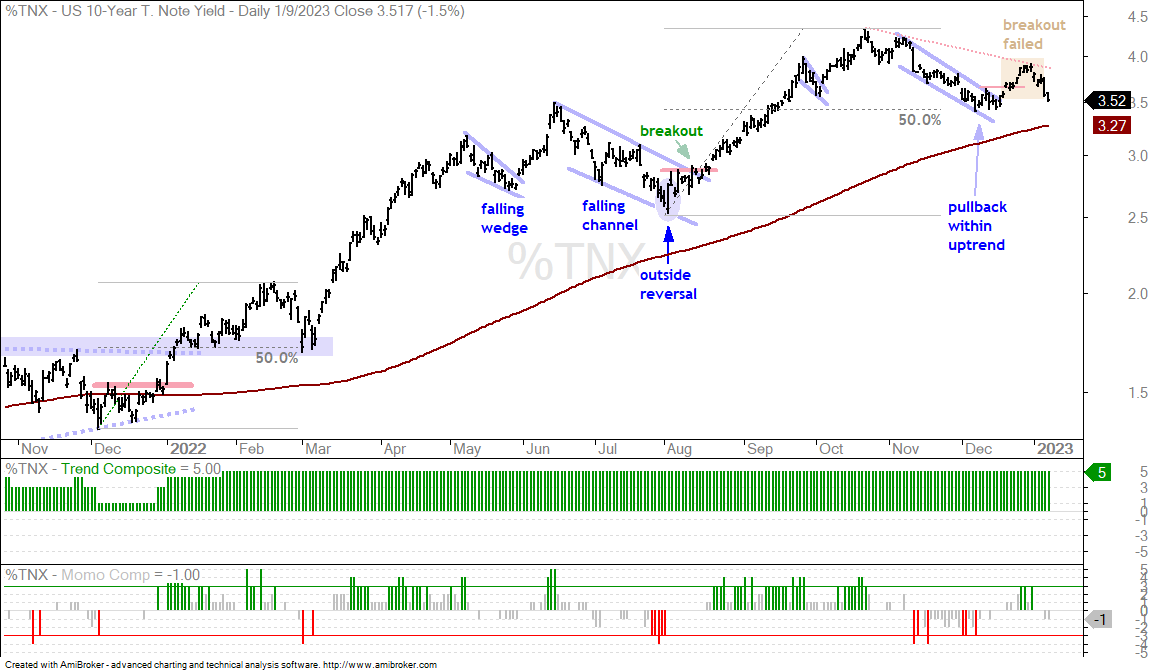
The next chart shows the 10-yr Treasury Yield with a normal pullback and a wedge breakout in late December. This breakout failed to hold as the yield fell sharply the last five days. Overall, the bigger trend is up because the yield is above the rising 200-day SMA. It is possible, however, that a lower high formed from October to December (red dashed line). The Fed may talk tough, but the bond market suggests a more dovish tone.
Dollar Sinks along with the 10-yr Yield (UUP)
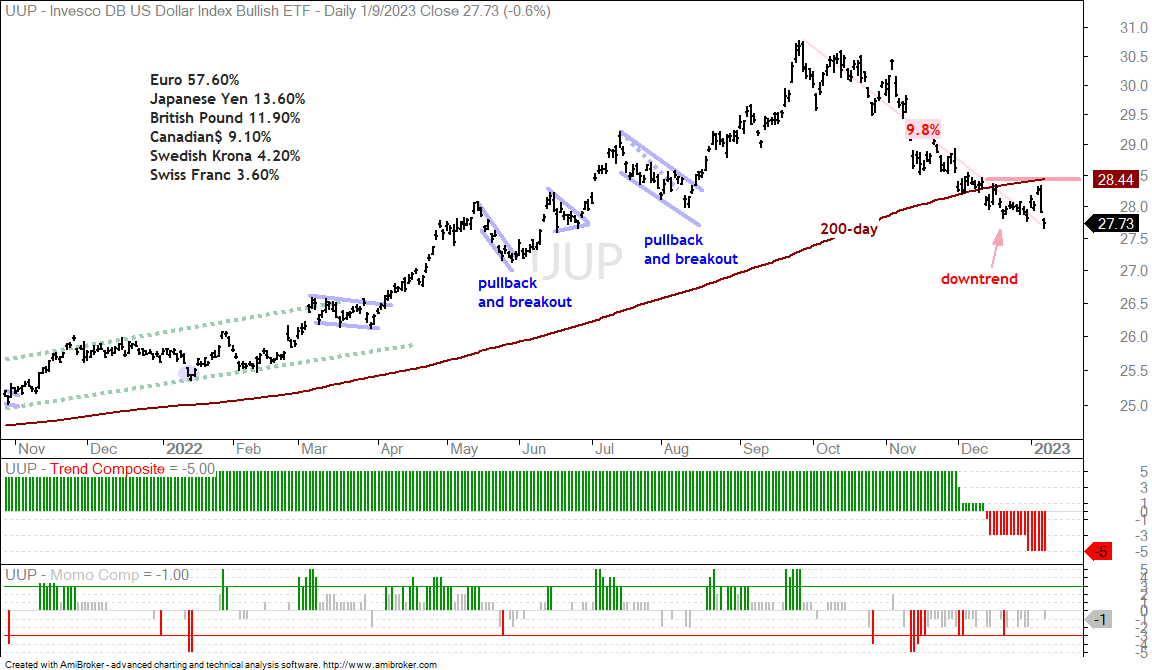
The positive correlation between the Dollar and the 10-yr yield remains in force. After a massive 21 percent advance from January to September, but Dollar is in the midst of a historic slide as it fell almost 10% the last three months. Resistance is set at the 200-day SMA and a break above 28.50 would reverse this downtrend.
The Trend Composite aggregates signals in five trend indicators: Bollinger Bands (125,1), Keltner Channels (125,2), 5-day Rate-of-Change of 125-day SMA, StochClose (125,5) and CCI-Close (125). The Trend Composite and ten other indicators are part of the TIP Indicator Edge Plugin for StockCharts ACP
Gold Continues to Outperform (GLD)
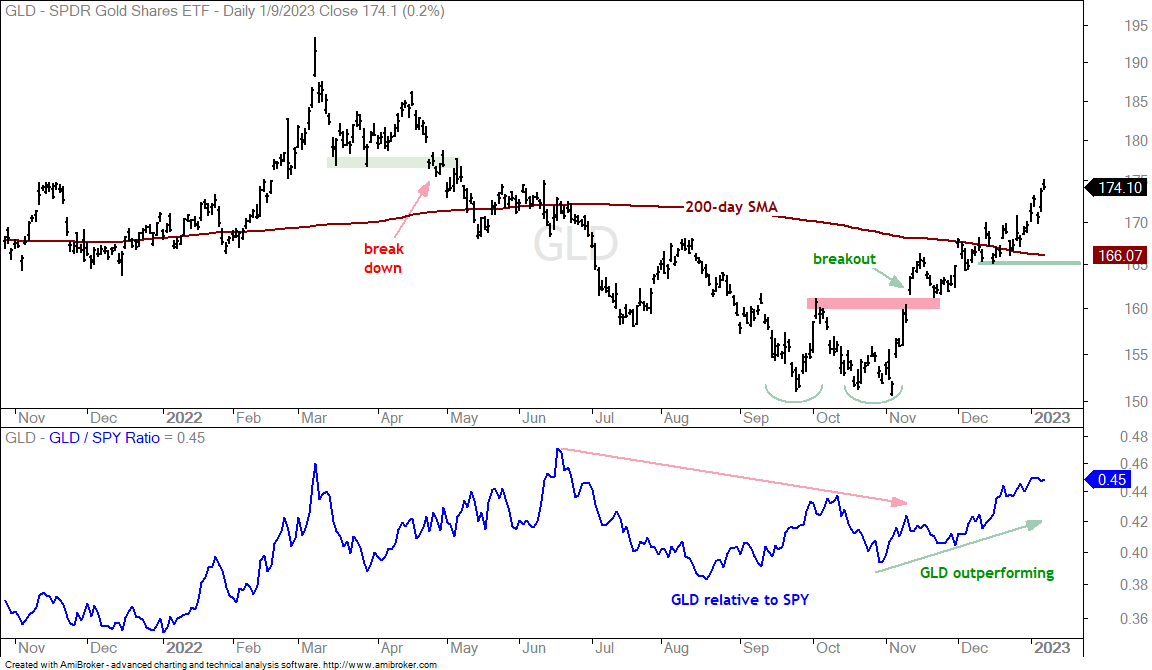
Precious metals are rising on the heels of Dollar weakness and falling Treasury yields. The first chart shows GLD with a double bottom in September-October, a breakout in mid November and continued strength the last two months. GLD is above its 200-day SMA and outperforming SPY as the price-relative rises (bottom window). There is no setup on this chart – just a post-breakout extension. The December lows and 200-day mark first support to watch should we see a pullback.
Silver and Platinum Follow Gold (SLV, PLTM)
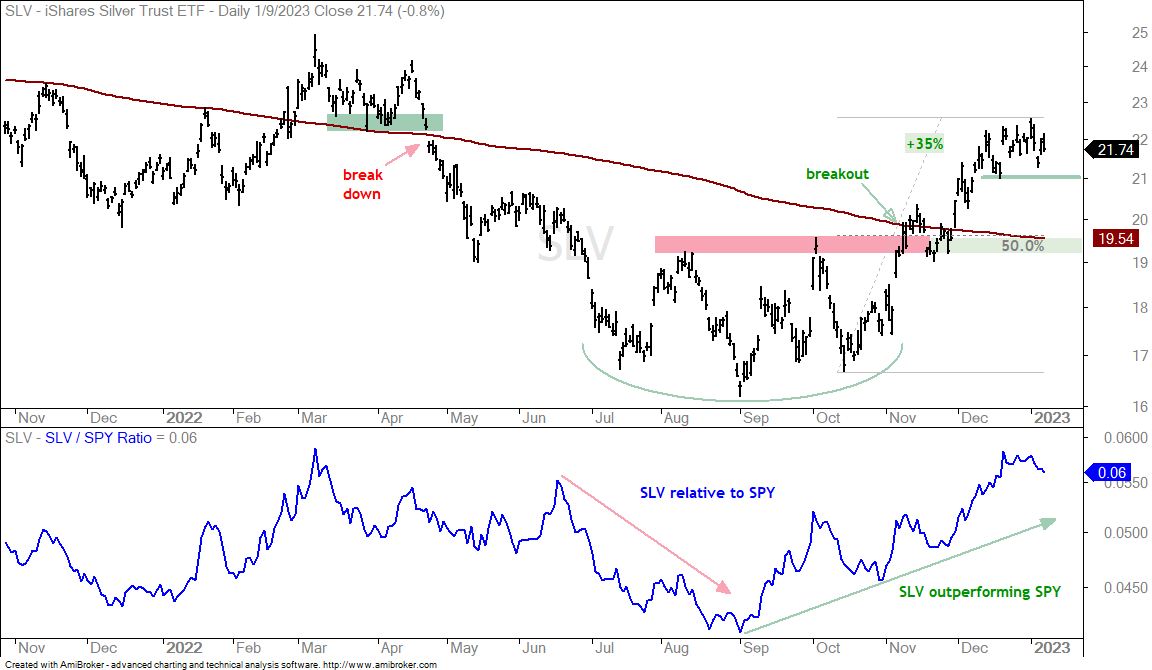
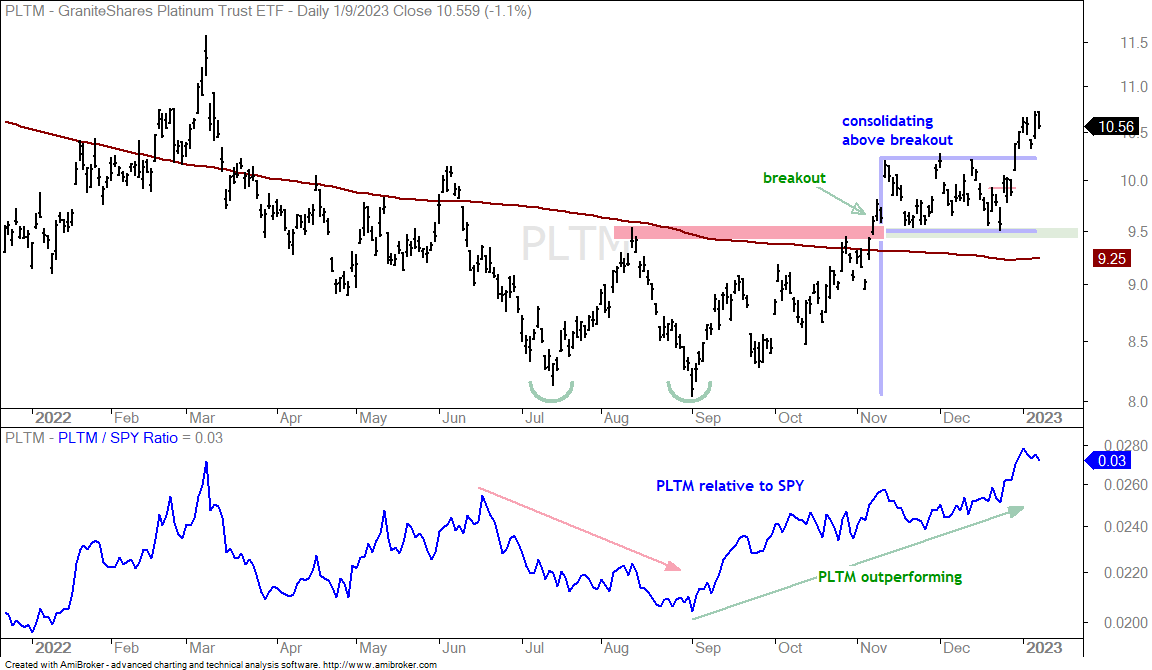
The Silver ETF (SLV) and the Platinum ETF (PLTM) are moving in lockstep with GLD. The first chart shows SLV breaking out in November when GLD broke out and continuing higher along with the yellow metal. SLV became extended after a 35% advance and stalled the last few weeks. A break below support at 21 would argue for a pullback and I am setting support in the 19-20 area (broken resistance, the 200-day and the 50% retracement).
Base Metals and Copper Surge (DBB, CPER)
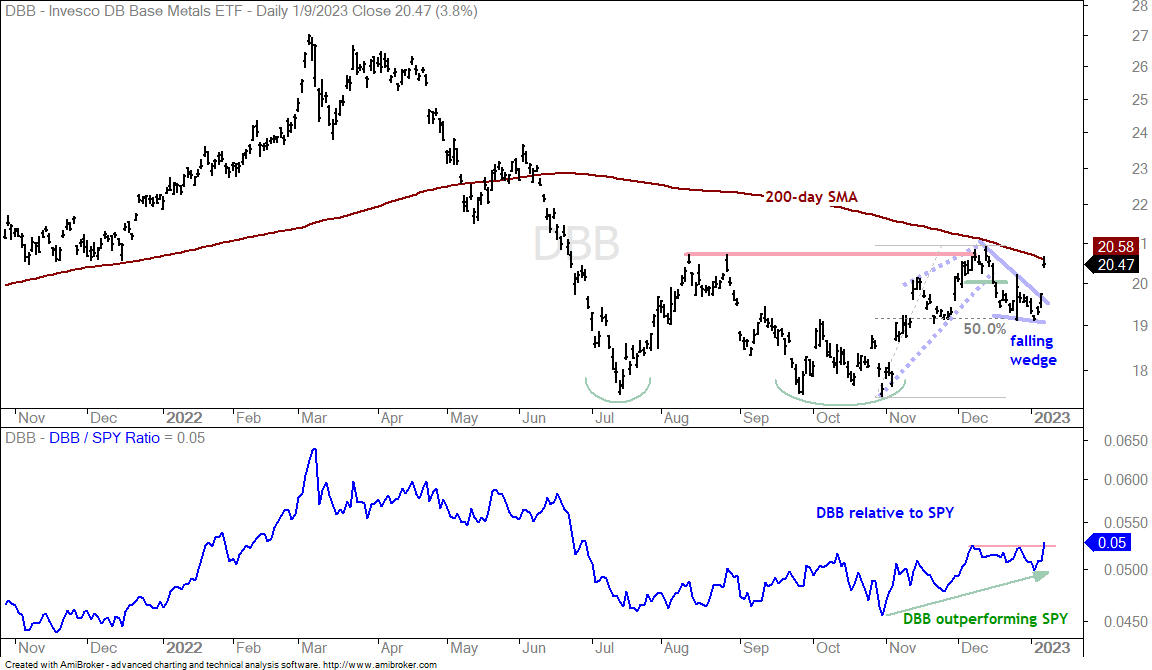
Chartists can miss a setup when leaning the wrong way. I was leaning bearish on the DB Base Metals ETF (DBB) because it failed at the falling 200-day SMA and broke rising wedge support in mid December (blue dashed lines). Hindsight analysis suggests that a double bottom formed with the lows in summer and fall. DBB exceeded the August highs (red line) and then fell back with a falling wedge that retraced around half of the prior advance (solid blue lines). DBB then broke out with a surge the last three days and is challenging the 200-day. Furter strength above 21 would confirm the double bottom and reverse the overall downtrend.
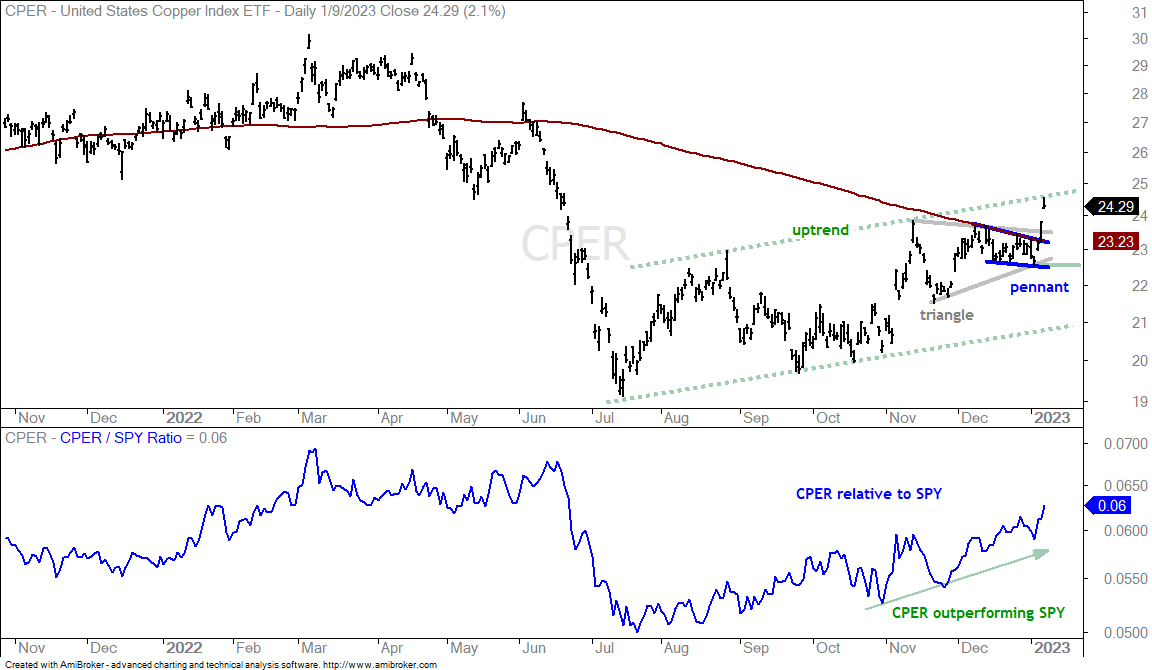
The next chart shows the Copper ETF (CPER) with two short-term bullish patterns and a breakout. First, the ETF surged from mid October to mid November and formed a triangle (gray lines). Second, the ETF formed a small pennant with a pullback into early January. CPER surged the last four days and broke out of both patterns, and above the 200-day SMA. Copper is also outperforming SPY as the price-relative extended its uptrend (CPER:SPY ratio).
Oil Remains in Long and Short Term Downtrends (USO, DBE)
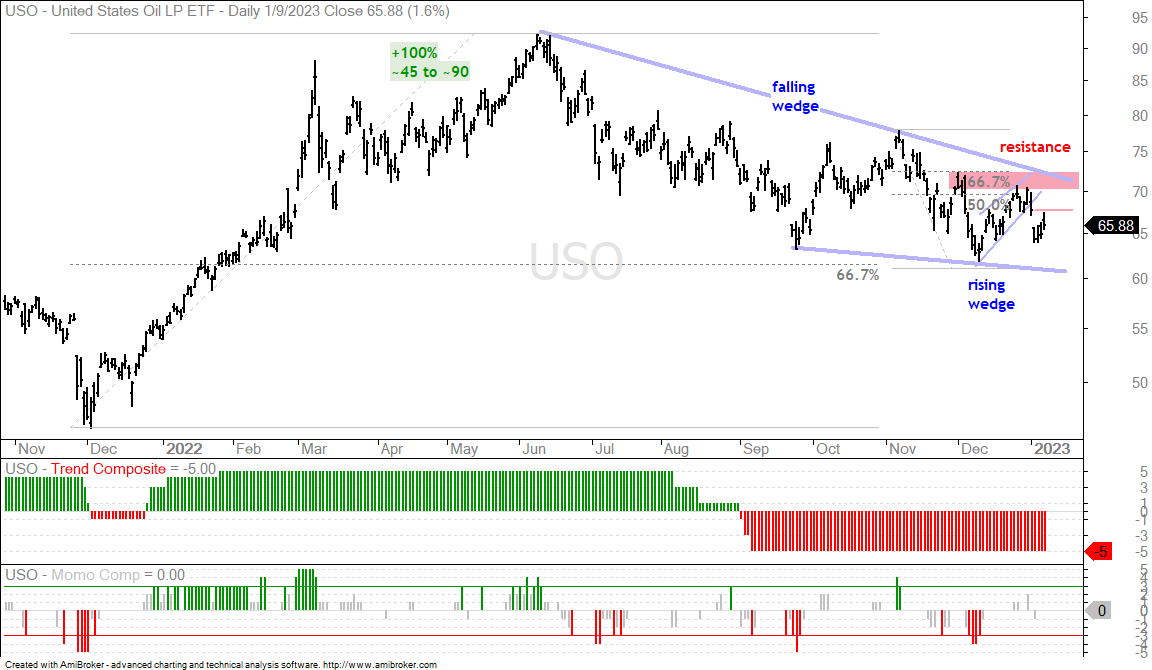
The US Oil Fund (USO) is in a long-term downtrend with a falling wedge taking shape since summer. This wedge retraced around 2/3 of the prior 100% advance. Even though the pattern and the retracement are typical for corrections within larger uptrends, USO remains short of a breakout and in a downtrend. The November-December highs and upper trendline mark a resistance zone in the 70-73 area and a breakout here would reverse the downtrend.
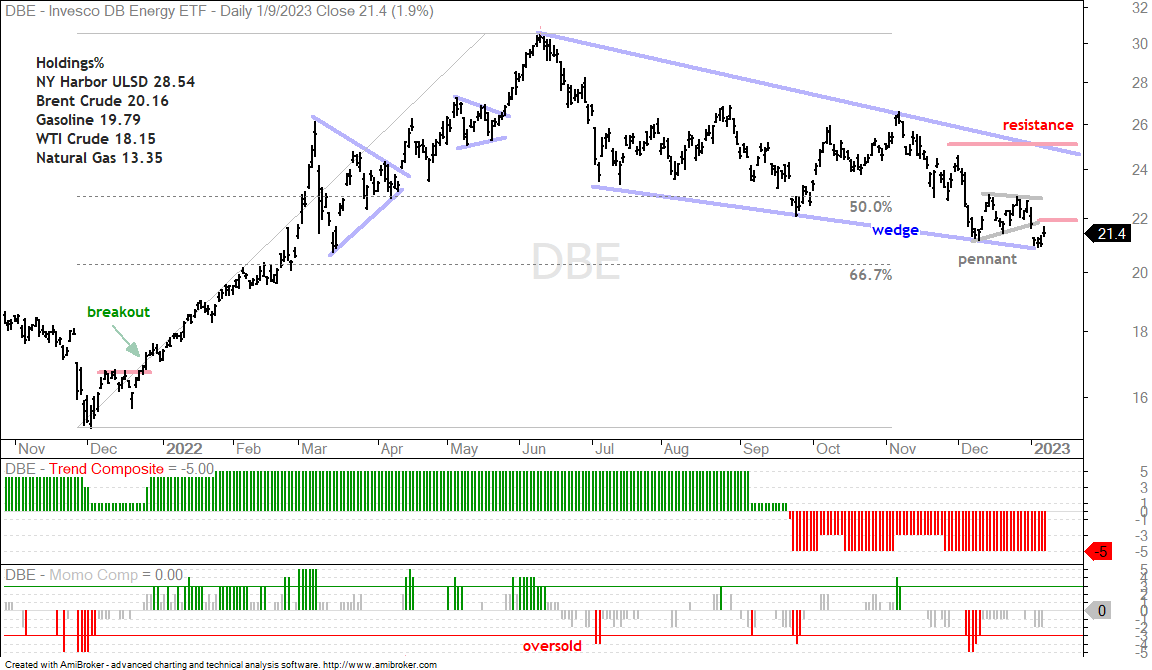
Short-term, USO fell from mid November to mid December, bounced with a rising wedge that retraced 50-67% and broke support with a sharp decline last week. Oil rebounded the last three days, but the wedge break is still valid. A close above 67.65 would argue for a re-evaluation. The next chart shows the DB Energy ETF (DBE) in a downtrend and with a pennant break last week. A close above 22 would negate the pennant break.
XLE, XES and AMLP Lead the Energy Group
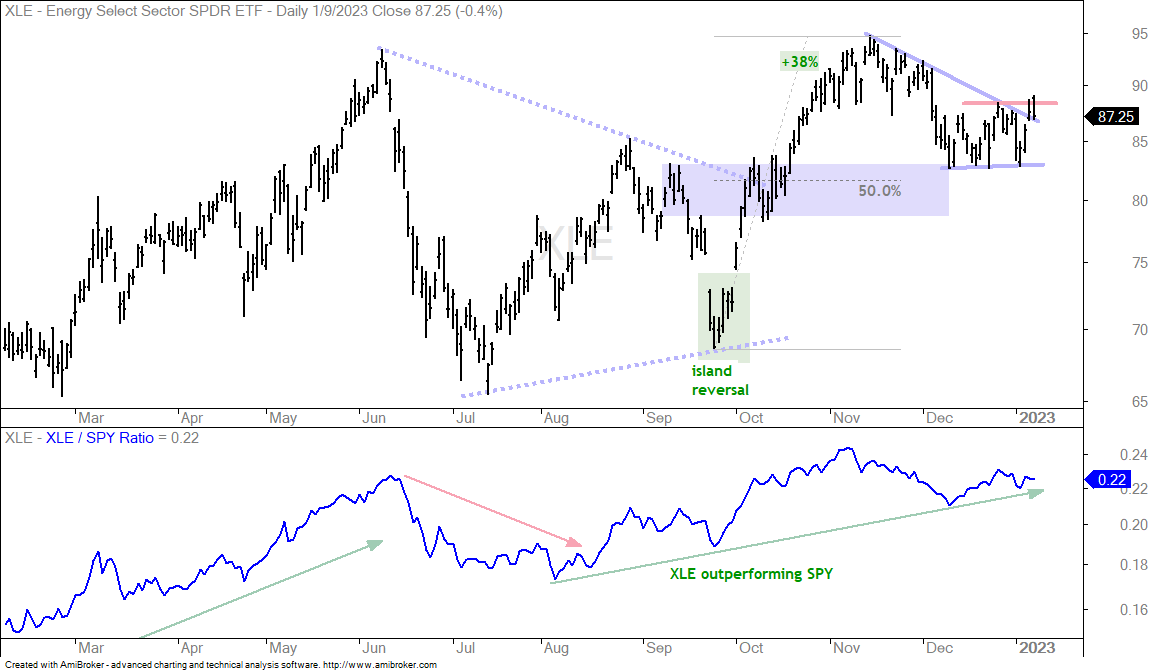
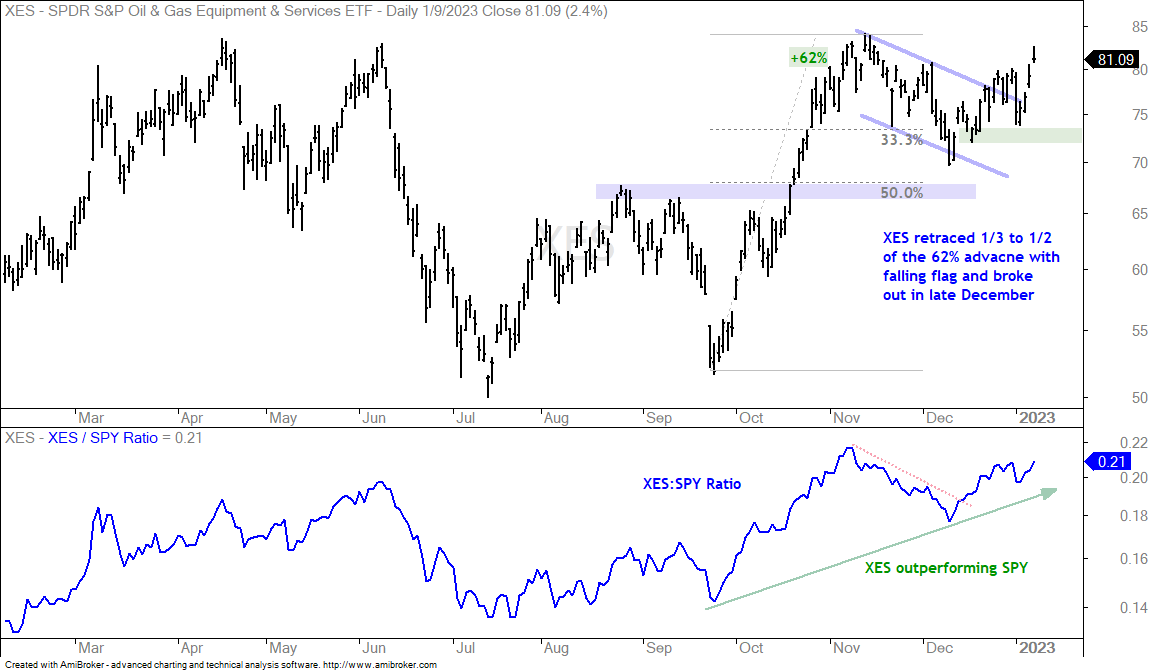
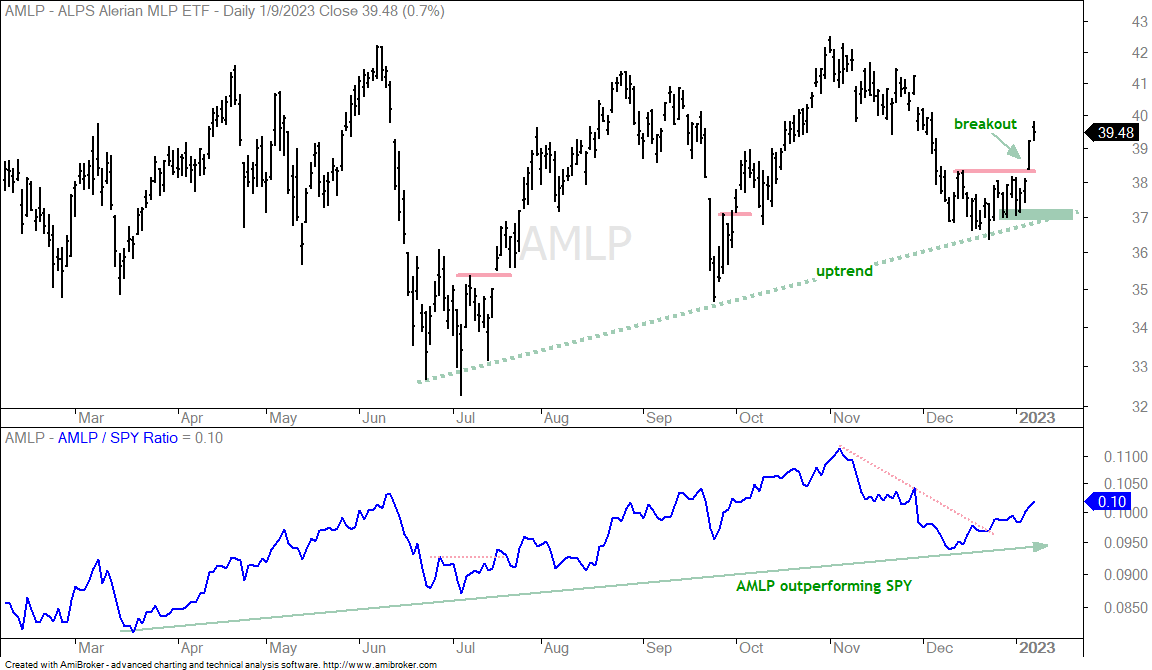
The Energy SPDR (XLE), Oil & Gas Equipment & Services ETF (XES) and MLP ETF (AMLP) are leading the energy group with short-term breakouts. The Oil & Gas Exploration & Production ETF (XOP) and Natural Gas ETF (FCG) are lagging as they forged lower lows from December to early January. The first chart shows XLE with a 38% surge, a return to the breakout zone, a 33-50 percent retracement and a triangle breakout over the last two days. This breakout is still a work in progress because XLE has yet to close above the mid December high (red line).
You can learn more about my chart strategy in this article covering the different timeframes, chart settings, StochClose, RSI and StochRSI.
Leading Uptrends in Select ETFs (KIE, PPA, ITB, PHO)
As noted at the beginning of this report, I remain on the defensive because the Composite Breadth Model is negative, the S&P 500 is in a downtrend and QQQ shows relative weakness. This is not a good environment for stocks. The following ETFs show relative strength because their price-relative are rising. They are also in uptrends after big moves since late September. Some are in the process of correcting (XLV, IBB), some are breaking out (KIE, PPA) and some are still working their way higher (ITB, PHO). Even though these ETFs are holding up better than SPY, they are not immune to broad market moves and the bear market could still weigh.
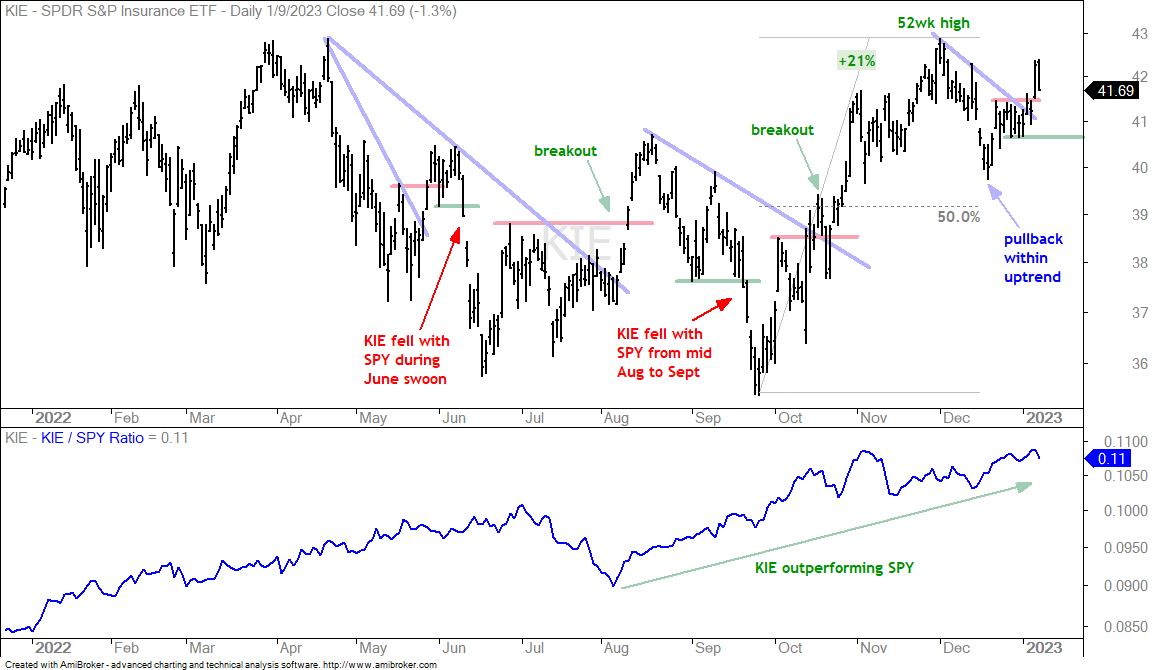
The first chart shows the Insurance ETF (KIE) with a 21% advance, a correction that retraced 33-50% and a breakout last week. KIE fell 1.3% on Monday, but this breakout is holding so far.
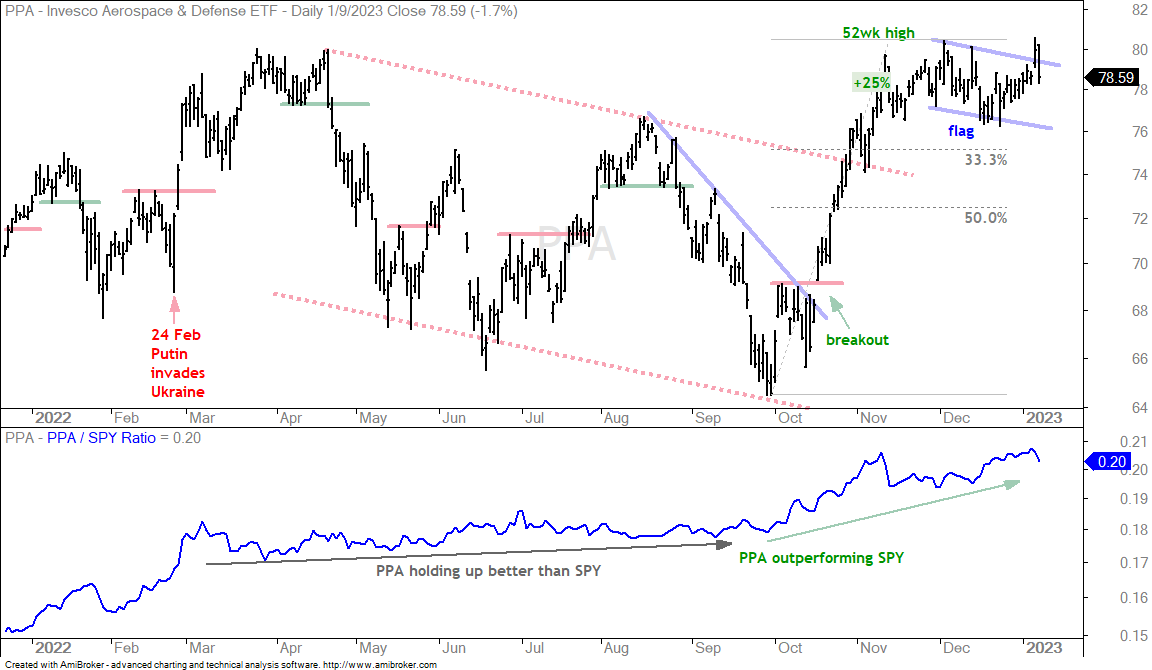
The next chart shows the Aerospace & Defense ETF (PPA) with a 25% surge and a falling flag in December. The ETF broke out of the flag with a surge on Friday, but fell back into the flag on Monday. The bulls are getting cold feet short-term, but PPA is still a leader overall. We can expect some volatility in general because bear market environments are more volatile.
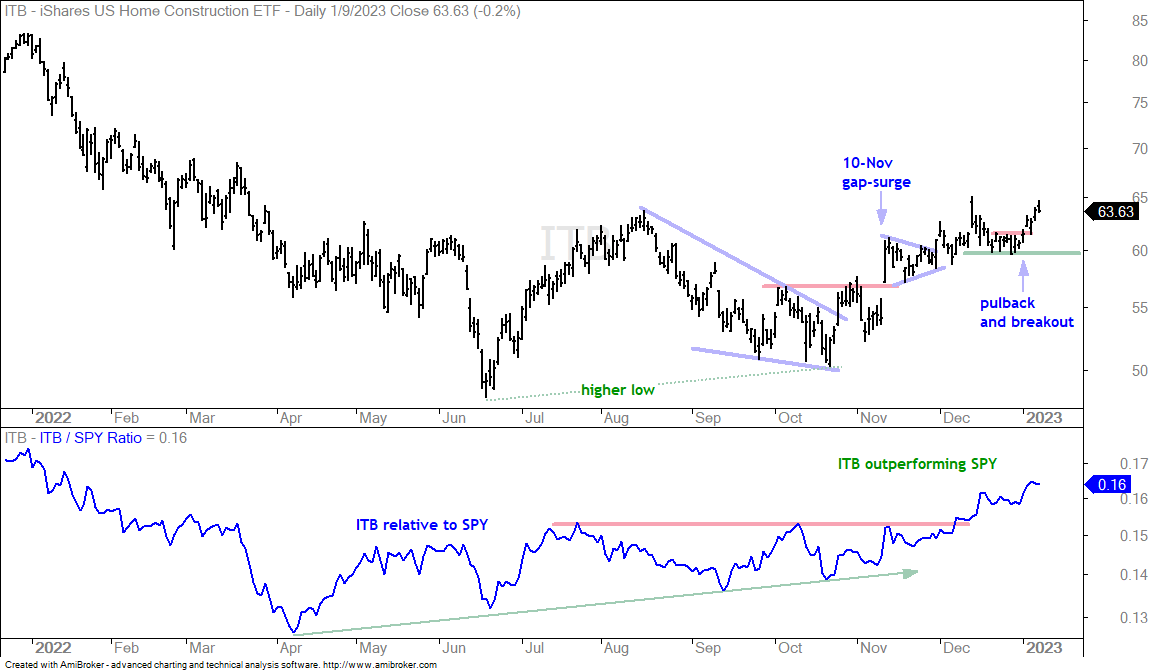
The Home Construction ETF (ITB) continues to hold up well and outperform SPY. Perhaps the downtrend in the 10-yr Treasury Yield is helping. ITB surged on November 10th and then worked its way higher the last two months. Most recently, the ETF firmed near 60 and broke short-term resistance last week. Support is set at 59.50.
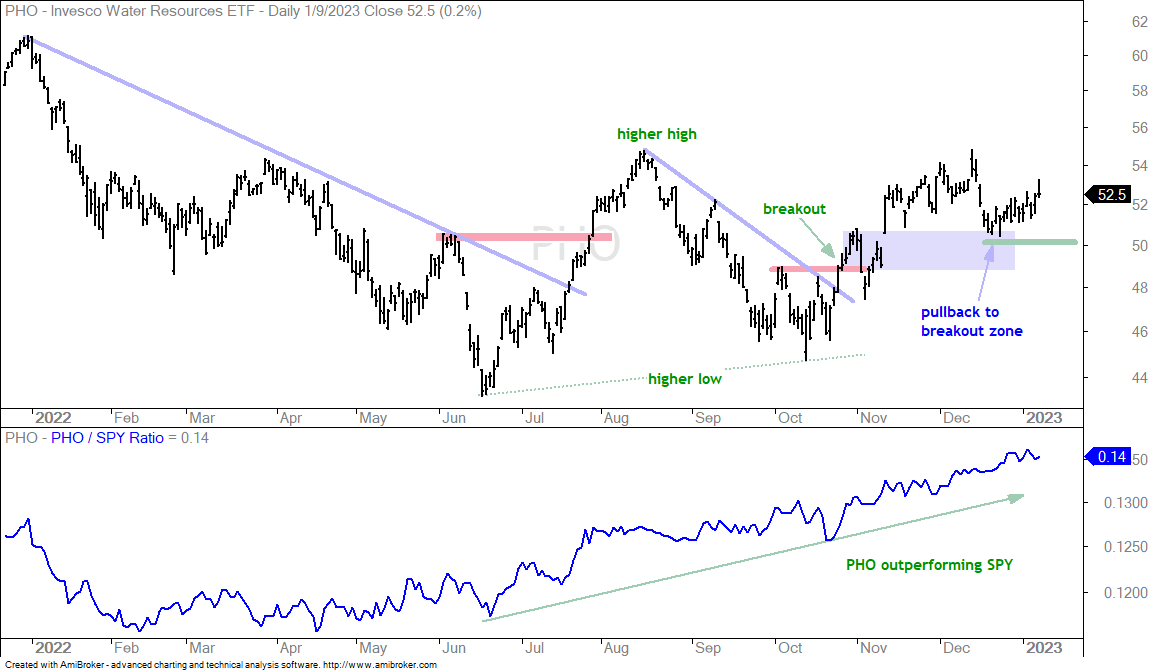
The next chart shows the Water Resources ETF (PHO) with a breakout in late October and uptrend over the last few months. It is not the strongest uptrend, but PHO is clearly outperforming SPY as the price-relative hit a new high in early January. I am focused on the immediate uptrend and am marking support at 50. A break here would argue for a re-evaluation.
Healthcare-related ETFs Under Pressure (XLV, IBB, IHF)
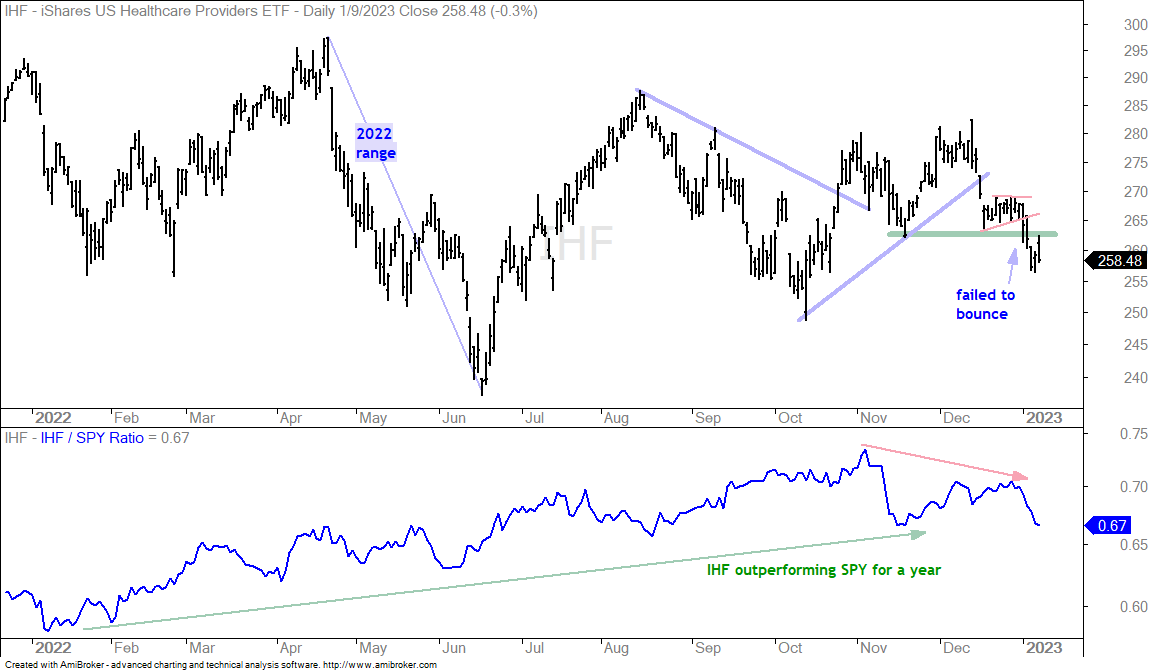
Healthcare-related ETFs are still leading over the last several months, but they came under pressure here in January and are underperforming. SPY is up 1.42% the last five trading days and eight of the ten sector SPDRs are up. XLE is down .25% and XLV is down 1.80% year-to-date. This could be related to the changes in the House of Representatives.
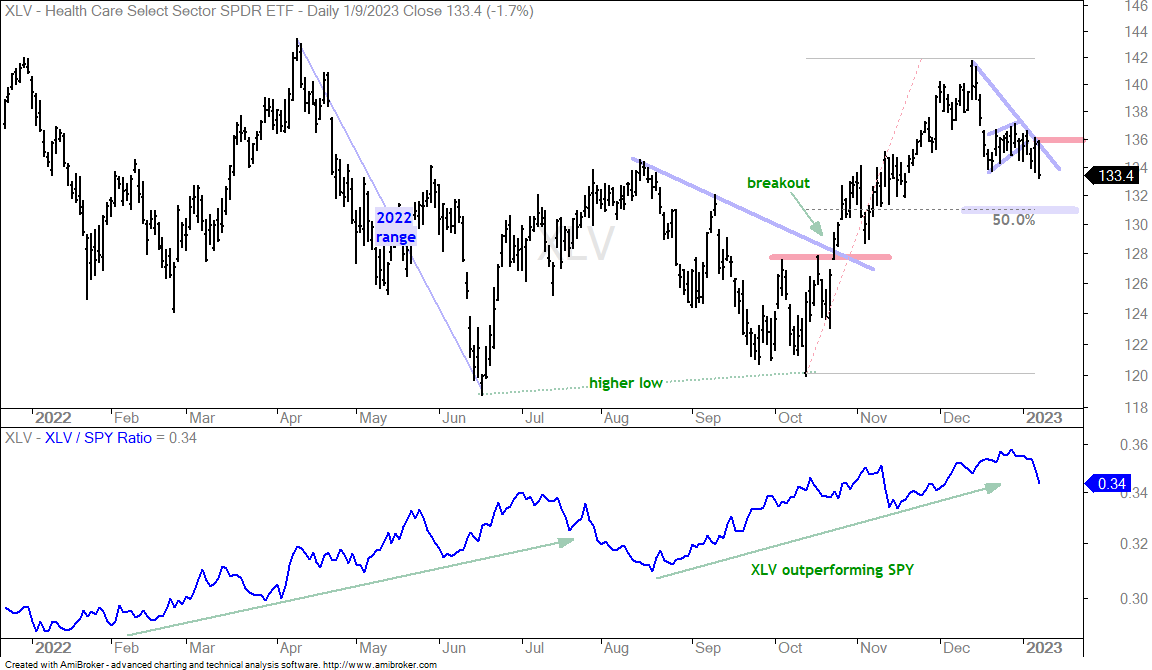
The chart below shows the Healthcare SPDR (XLV) falling sharply in mid December with the rest of the market. The ETF firmed for a week or so and then fell again the last five days. This puts XLV in corrective mode with resistance marked at 136. A breakout here would end the correction and signal a continuation of the bigger uptrend. For now, this correction could extend to the 131 area.
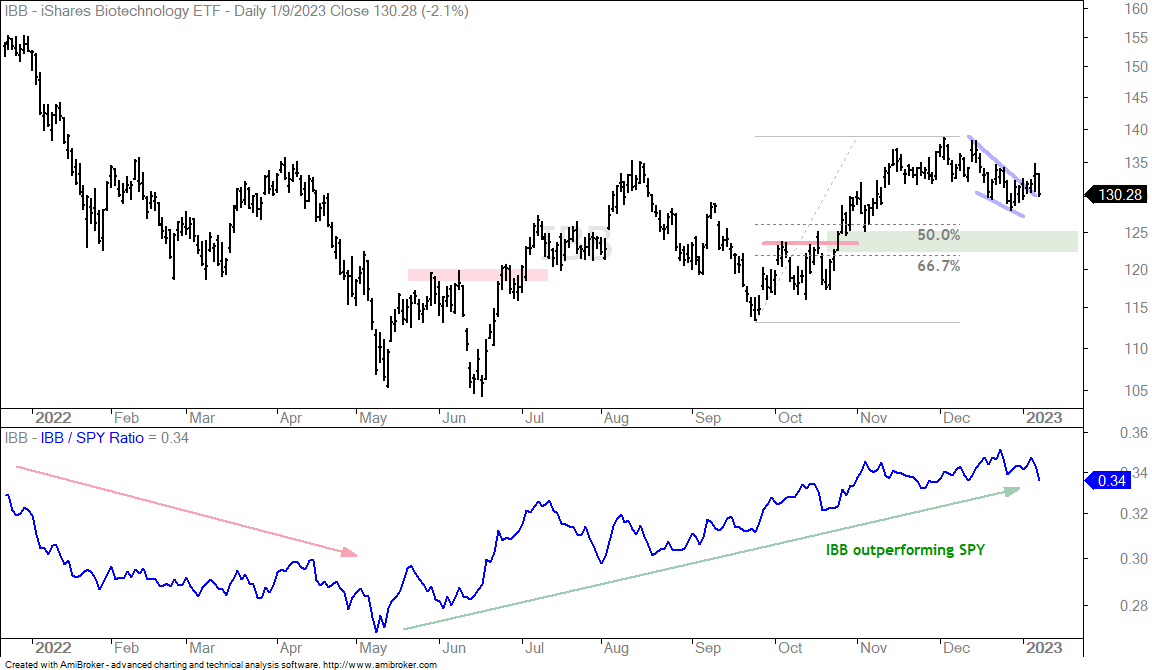
The next chart shows the Biotech ETF (IBB) with a wedge breakout last week and sharp decline (-2.1%) on Monday. IBB is down .77% year-to-date and lagging the broader market. The overall trend since summer is up, but the failed wedge breakout and sector weakness could weigh. Support is set in the 123-125 area.
QQQ, Networking, Semis and Software (QQQ, IGN, SOXX, IGV)
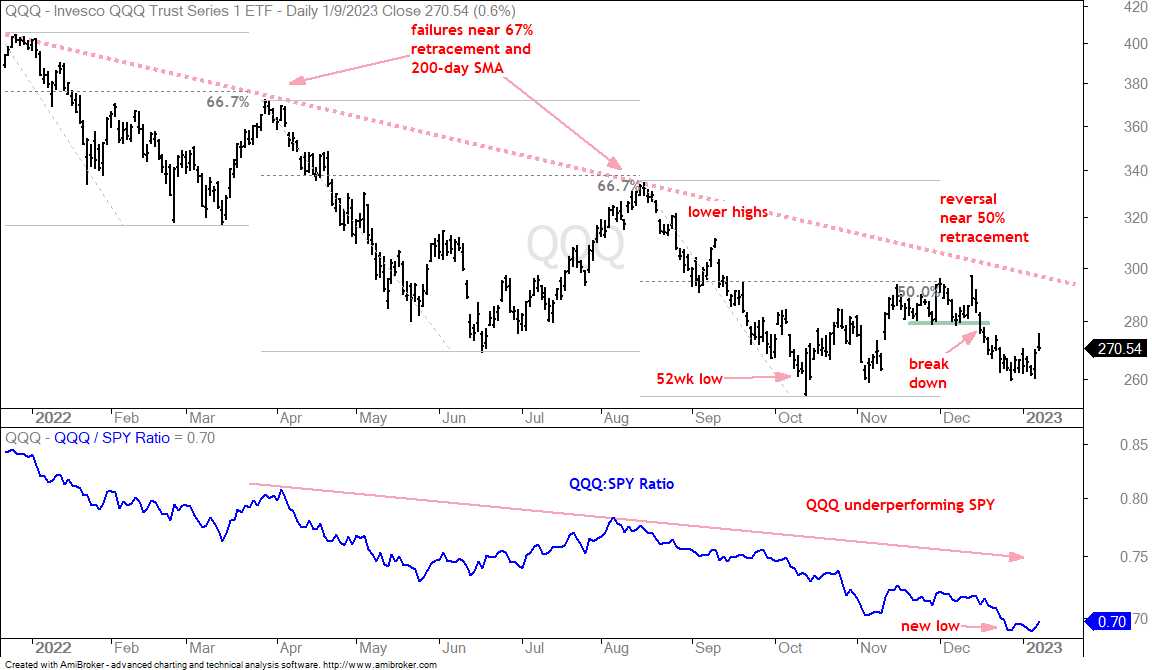
The Nasdaq 100 ETF (QQQ) sets the tone for the technology sector and influences SPY because Nasdaq 100 stocks account for 35% of the S&P 500. QQQ hit a 52-week low in October and then retraced around half of the August-October decline with a bounce into early December. The ETF broke down in mid December and this breakdown is holding. This signals a continuation of the bigger downtrend and new lows are expected. The price-relative hit a new low in late December and this shows continued relative weakness in QQQ.
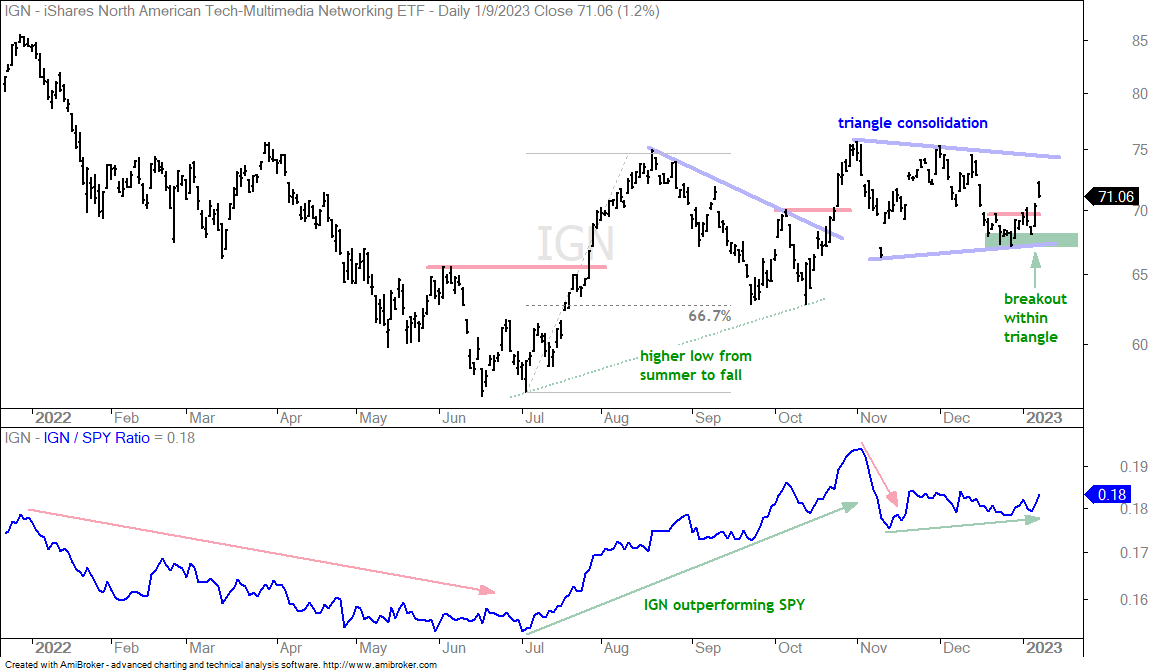
The Networking ETF (IGN) is the strongest of the tech-based ETFs, most of which are in downtrends. The chart below shows IGN with a breakout surge in October and a triangle consolidation the last two months. Within the triangle, IGN surged off support and broke short-term resistance. This increases the chances of a triangle breakout. The late December lows mark support.
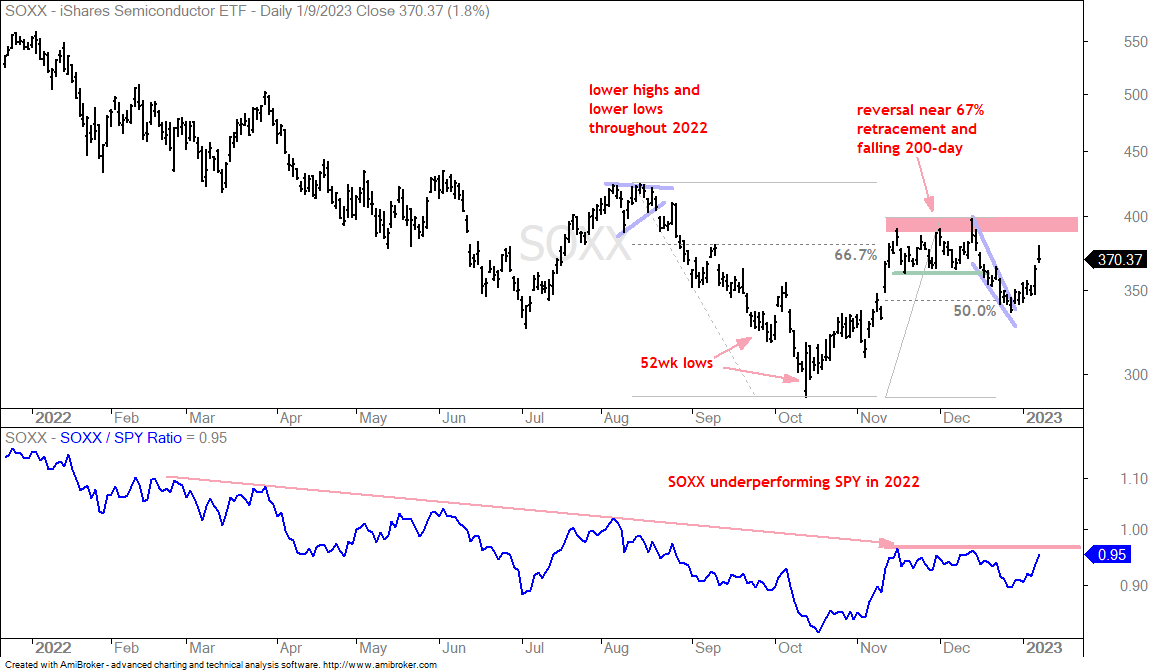
The Semiconductor ETF (SOXX) is showing some upside leadership here in 2023, but the long-term trend remains down and we have yet to see a breakout in the price-relative (SOXX: SPY ratio). The chart below shows SOXX retracing around 67% of the August-October decline and hitting resistance just below 400. The ETF broke down in mid December and fell below 350. This decline retraced just over half of the October-December surge and formed a steep falling wedge. The wedge breakout and short-term surge are positive, but I am not biting because of the long-term downtrend (and bear market). A breakout at 400 would reverse the long-term downtrend. The indicator window shows the price-relative and a break above the red resistance line would show relative strength returning to SOXX.
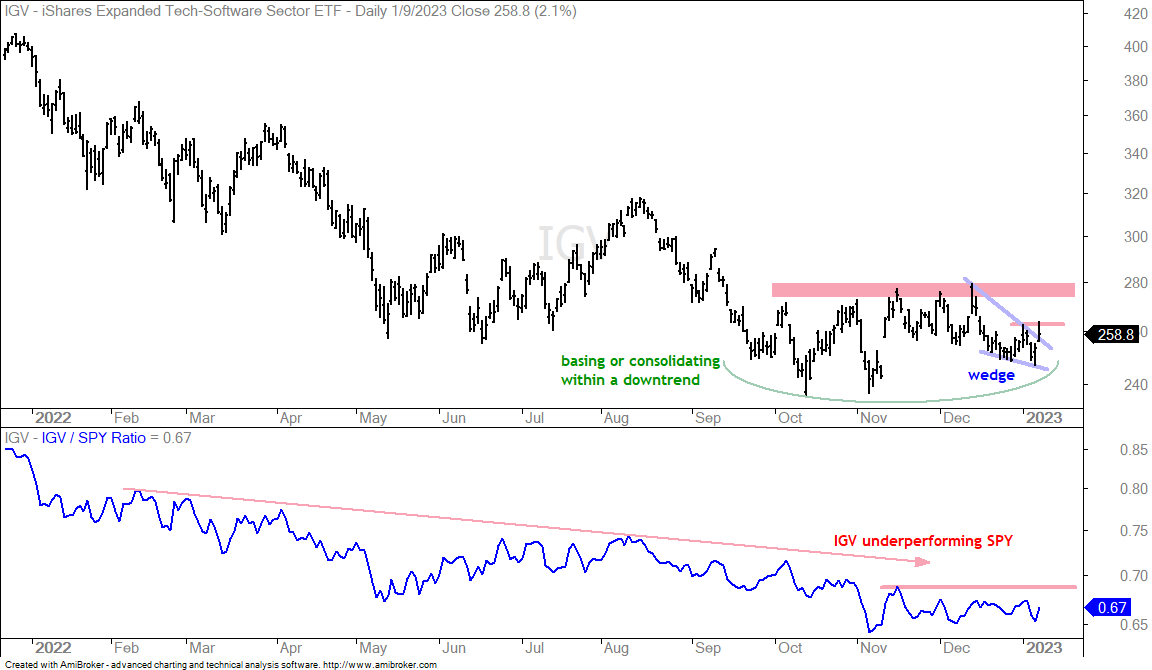
The Software ETF (IGV) sums up the tech sector overall. There is a downtrend on the price chart and a downtrend for the price-relative (IGV:SPY ratio). It is possible that IGV is trying to base because it has been flat since late September (green arc). Most recently, IGV failed at resistance and fell with a falling wedge into early January. This could be a short-term correction that could result in a higher low from November to January. IGV surged on Monday and a follow through breakout at 263.5 would be short-term bullish.