

About the ETF Trends, Patterns and Setups Report
This report contains discretionary chart analysis based on my interpretation of the price charts. This is different from the fully systematic approach in the Trend Composite strategy series. In this ETF Trends, Patterns and Setups report, I am looking for leading uptrends and tradable setups within these uptrends. While I use indicators to help define the trend and identify oversold conditions within uptrends, the assessments are mostly based on price action and the price chart (higher highs, higher lows, patterns in play). Sometimes the chart assessment can be at odds with the indicators.
Schedule for the Week
- Tuesday – 3 Jan: ETF Report and Signal-Rank Table Update
- Wednesday – 4 Jan: Market Regime and ETF Video
- Thursday – 5-Jan: Seasonal Patterns to Consider
- Saturday – 7 Jan: ETF Signal-Rank Table Update
Going More Systematic
I developed two ETF strategies in 2022: a mean-reversion strategy and a rotation strategy. These strategies are fully systematic and do not require chart analysis. Even so, I still use charts to show the indicators, setups, entry signals and exits. The rotation strategy is only active when the Composite Breadth Model is bullish, while the mean-reversion strategy is active all the time because it does not use a market filter. I will start with the mean-reversion strategy next week and introduce the rotation strategy in mid January.
Santa Claus Rally Indicator
The late Yale Hirsch of the Stock Trader’s Almanac invented the Santa Claus Rally (SCR) indicator in 1973. His son, Jeffrey Hirsch, explains this indicator and its history in this Tumblr Post. In short, the SCR extends from the last five trading days of the year to the first two trading days of the new year. The current period goes from December 23rd to January 4th. Hirsch considers the SCR as an indicator because it sets the tone for the rest of the year.
Since 1994, the S&P 500 rose 23 times and fell just 6 times during the SCR period. This is a winning percentage of 79.30%. The average gain for the S&P 500 was 1.3%. Over the last seven days, the S&P 500 is up .80%. Thus, there is clearly a bullish bias during this period.
The Turn of the Month Pattern
I will not extrapolate a 2023 forecast based on a seven day trading period. However, I will note that the eight day turn-of-the-month period has a bullish bias and this was first pointed out in a SystemTrader article on March 2018 and updated in February 2021 at TrendInvestorPro. Also note that I am not the first to suggest a bullish bias for the turn-of-the-month.
The turn-of-the-month covers the last four trading days of one month and the first four trading days of the next month. The rationale is that Fund managers are window dressing at the end of the month and putting new money to work at the beginning of the month. There could also be some front running involved. Buyers step in at the end of the month in anticipation that fund managers will buy at the beginning of the month. Whatever the rationale, the turn-of-the-month has a clear bullish bias.
Chart Example
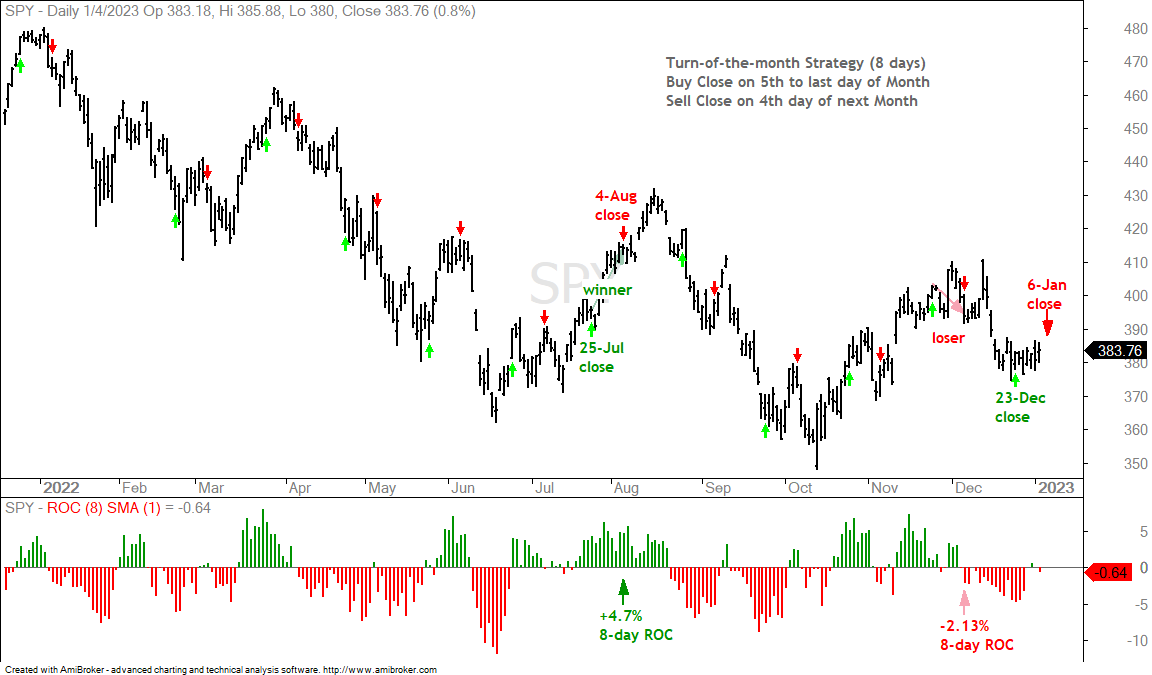
The chart below shows some entries (green arrows) and exits (red arrows). Entry is on the close of the fifth-to-last day of the month and exit is on the close of the fourth day of the next month. This is eight complete trading days from close to close. The current period extends from the close on December 23rd to the close on January 6th. The eight trading days are December 27, 28, 29 and 30, and January 3, 4, 5 and 6.
Backtest Results
The table below shows test results using SPY from December 15th 1997 to now (25 years). SPY closed higher 66% of the time with an average gain of 2.24%. This implies that SPY closed lower 34% of the time, and the average loss was 2.37%. Trading for just eight days every month means exposure to the market was just 35% (one third of the year).

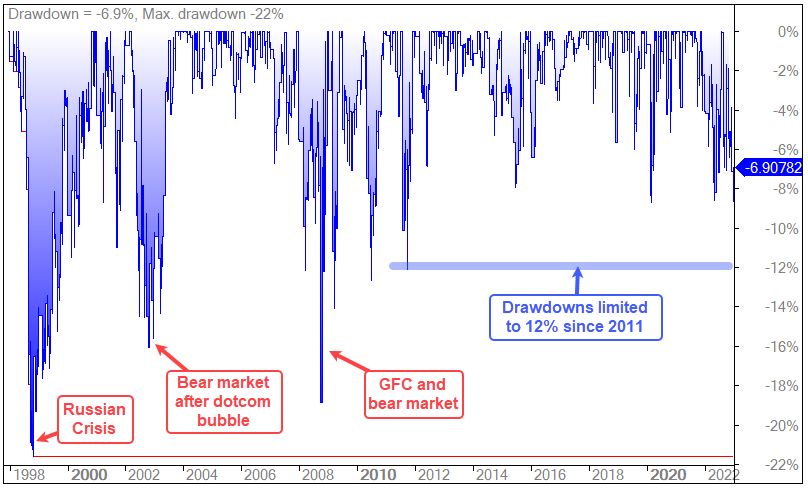
The Compound Annual Return (CAR) was a respectable 6.91%, but the Maximum Drawdown (MDD) was 21.86%, which occurred in October 1998 after a 14.5% loss the prior August. There was also a 19% drawdown in October 2008 during the Global Financial Crisis.
Equity Curve, Drawdowns and Return Breakdown
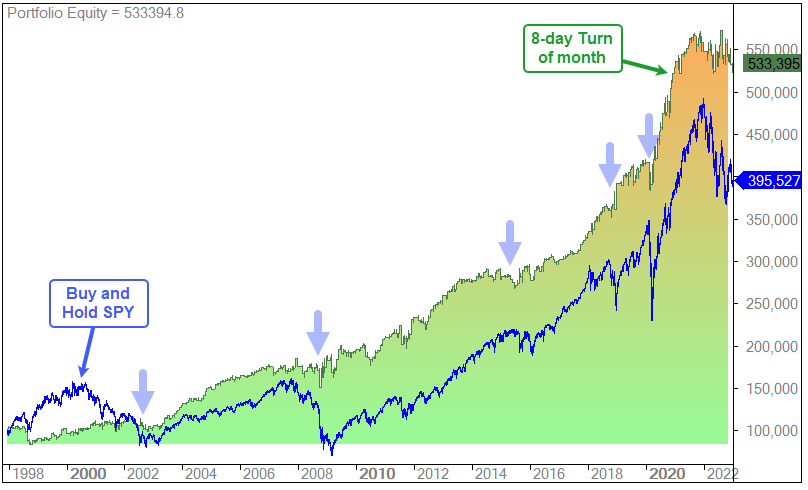
The next chart shows the equity curve (green line) for this strategy. The blue line is buy-and-hold for the S&P 500 SPDR (SPY). Yes, this simple strategy, which was invested just 35% of the time, beat buy-and-hold by a fairly wide margin. Also notice that the drawdowns were contained in 2001, 2008, 2015, 2018 and 2020 (blue arrows). The equity line dipped, but not nearly as sharply as the SPY equity line. The drawdowns for SPY, in contrast, were deep during these periods.
The next chart shows the drawdowns with the deepest occurring in 1998, 2001 and 2008. A financial crisis in Russia is the blame for the 1998 drawdown. The 2001 and 2008 drawdowns occurred during bear markets.
The next table shows the monthly and yearly returns. Note that the monthly returns reflect the change based on the first four days of the month and the last four days of that same month. This is not the turn-of-the-month. Instead, it is the net gain/loss for the overlapping days in each month. The last line shows the monthly averages. February, August and September were the worst months, and the only months with an average loss (red shading). April, October and November were the best months (green shading).
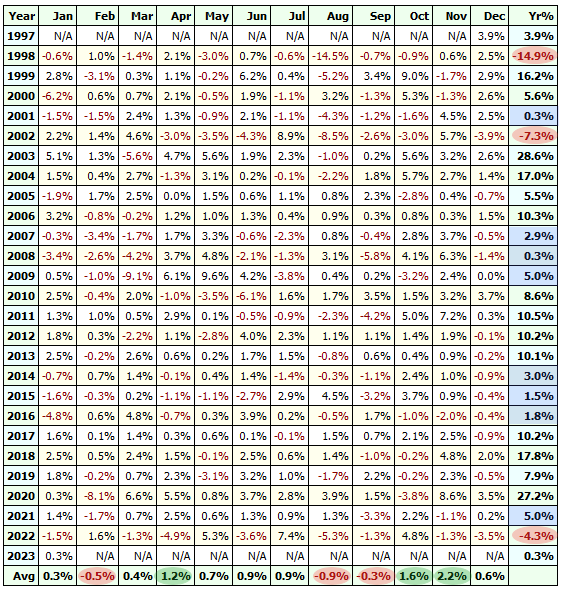
The annual returns in the far right column (Yr%) are a bit erratic. Of the 25 complete years, 10 (40%) show double digit returns (>10%). Of the 12 other positive years, 8 generated returns of 5% or less (blue shading). There were 3 losing years, including a 14.9% loss in 1998 (red shading).
Monthly Seasonal Patterns
Seasonal patterns take a back seat to the Composite Breadth Model and broad market trend. When seasonal patterns align with the market environment, their importance could increase. The table below shows monthly and yearly returns for SPY since 1998 (25 years). The next to the last line shows the average gain/loss for the month. The last line shows how often SPY close higher.
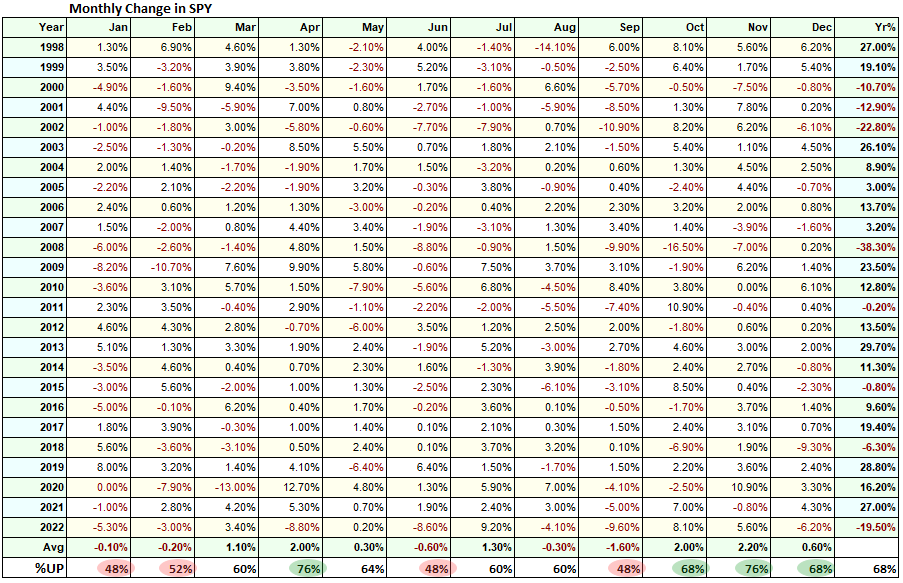
Historically, April, October, November and December were the strongest months of the year (green shading). SPY was up 68% of the time or more in these months. January, February, June and September were the weakest months (red shading). These months are basically a coin flip and each month shows a net loss over the last 25 years.
The stock market moved from a bullish seasonal period in the fourth quarter of 2022 to a bearish seasonal period in January and February. The Composite Breadth Model is negative and this means the bears have the edge. A bear market combined with bearish seasonal patterns could make for a rough beginning this year. This, in turn, could set the stage for some sort of selling climax or bottom in the first quarter.
Previous Reports and Video
Tuesday: Market and ETF Report (here)
- Going More Systematic
- Market Regime is Bearish for Stocks
- SPY Stalls after Short-term Reversal
- QQQ Underperforms
- Equal-weight S&P 500 Show Relative Strength
- Four Diverse ETFs Showing Relative Strength
- Healthcare ETFs Outperforming Broader Market
- Oil Forms Rising Wedge within Falling Wedge
- Energy ETFs Turn Mixed
- Copper Consolidates near 200-day
- Gold, Silver and Platinum Hold Strong
Wednesday: Market Regime, Composite Breadth Model and Yield Spreads (here)
Wednesday Video (here)
- Composite Breadth Model is Negative
- %Above 200-day SMA Shows Split Market
- Yield Spreads Diverge as Junk and AAA Widen
- SPY in Long and Short-term Downtrend
- Equal-weight SPX Leads, but Trend is NOT Up
- QQQ is Leading Lower and Trending Lower
- TLT Gets Oversold Bounce within Downtrend
- 10-yr Treasury Yield Holds Breakout
- Dollar Bullish ETF Gets Oversold Bounce below 200-day
- Gold Extends on Breakout
- Four Diverse ETFs Showing Relative Strength (ITB, KIE, PPA, PHO)
- Healthcare ETFs Outperforming Broader Market (XLV, IBB, XBI, IHF)
- Networking ETF Tests Support Zone and 200-day (IGN)
- MLP ETF Firms Near 67% Retracement (AMLP)
- Oil Breaks Rising Wedge Support (USO, DBE)
- XLE and XES Fail to Follow Through
- XOP and FCG Break Pennant Support
- Short-term Bearish Continuation Patterns (SPY, RSP, XLI)
- Tech ETFs Lag Overall (SKYY, CIBR, FINX, FDN, IPAY)
- Tech, Semi, Retail and Banking ETFs Break Down (XLK, SOXX, XRT, KRE)
- Base Metals ETF Breaks Down as Copper Stalls (DBB, PALL, CPER)
- Gold, Silver and Platinum Hold Strong (GLD, SLV, PLTM)
You can learn more about my chart strategy in this article covering the different timeframes, chart settings, StochClose, RSI and StochRSI.
You can learn more about my chart strategy in this article covering the different timeframes, chart settings, StochClose, RSI and StochRSI.