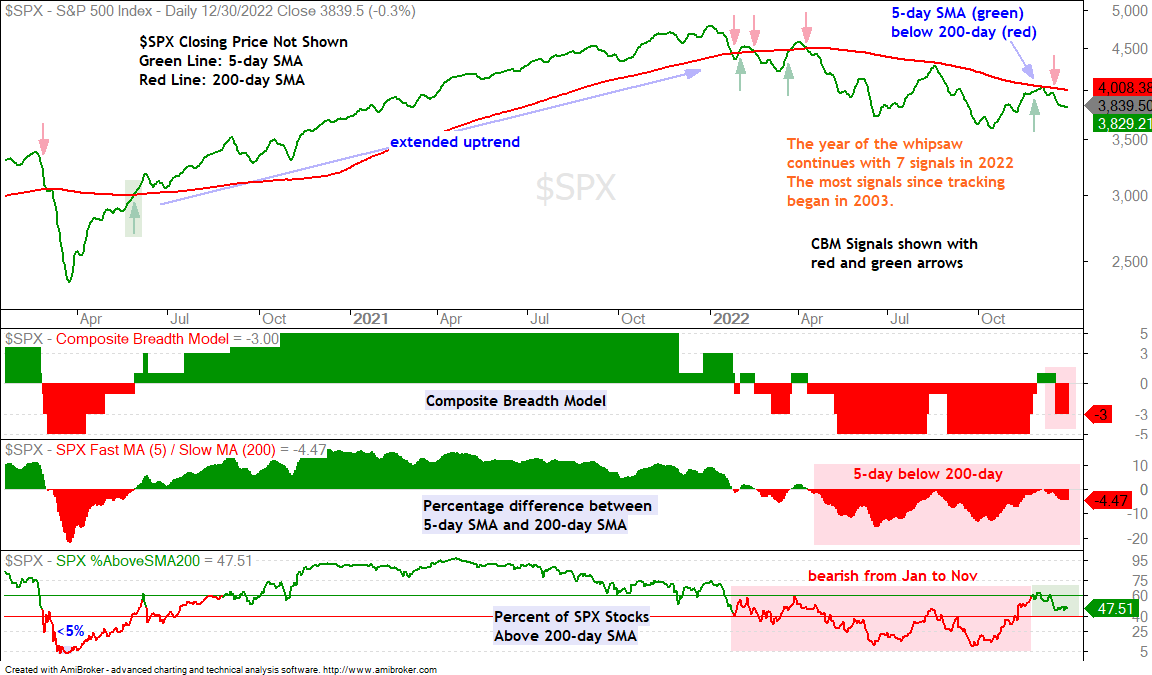
Today’s update starts with the big three (SPY, QQQ, IWM) because they broke down to signal a continuation of their long-term downtrends. Moreover, the Composite Breadth Model turned negative and we are back in bear market mode. These conditions bode ill for most stock-based ETFs. While a few stock-based ETFs may buck the bear, it is extremely difficult to pick upside winners in a bear market. Defense is the name of the game during bear markets.
This Week's Schedule
Tuesday – 3 Jan: ETF Report and Signal-Rank Table Update
Wednesday – 4 Jan: ETF Report and Signal-Rank Table Update
Thursday – 5-Jan: Market Regime and ETF Video
Saturday – 6 Jan: ETF Signal-Rank Table Update
About the ETF Trends, Patterns and Setups Report
This report contains discretionary chart analysis based on my interpretation of the price charts. This is different from the fully systematic approach in the Trend Composite strategy series. In this ETF Trends, Patterns and Setups report, I am looking for leading uptrends and tradable setups within these uptrends. While I use indicators to help define the trend and identify oversold conditions within uptrends, the assessments are mostly based on price action and the price chart (higher highs, higher lows, patterns in play). Sometimes the chart assessment can be at odds with the indicators.
Going More Systematic
I developed two ETF strategies in 2022: a mean-reversion strategy and a rotation strategy. These strategies are fully systematic and do not require chart analysis. Even so, I still use charts to show the indicators, setups, entry signals and exits. The rotation strategy is only active when the Composite Breadth Model is bullish, while the mean-reversion strategy is active all the time because it does not use a market filter. I will start with the mean-reversion strategy next week and introduce the rotation strategy in mid January.
Market Regime is Bearish for Stocks
The Composite Breadth Model turned negative on December 19th and remains at -3, which means four inputs are bearish (-4) and one is bullish (+1). The 5-day SMA for the S&P 500 is below the falling 200-day SMA and this bearish cross has been active since April 11th. Also note that the Fed balance sheet is contracting and junk bond spreads remain elevated.
The Composite Breadth Model sets the tone for stocks and stock-based ETFs. A negative CBM means we are in a bear market environment and risk is above average for stocks and stock-based ETFs. A few might buck the bear market, but it is difficult to pick winners and the risk of loss is above average. This is a time to preserve capital and wait for the next bull market.
The Composite Breadth Model is a trend-following model that whipsawed in 2022. Whipsaws are frustrating, but they are part of the process, especially after an extended uptrend. The model was bullish from 29-May-2020 to 27-Jan-2022 and SPY gained 46.24% during this year. 2022, in contrast, was the year of the drawdown in the equity curve. As with uptrends, equity curves also experience pullbacks along the way.
SPY Stalls after Short-term Reversal
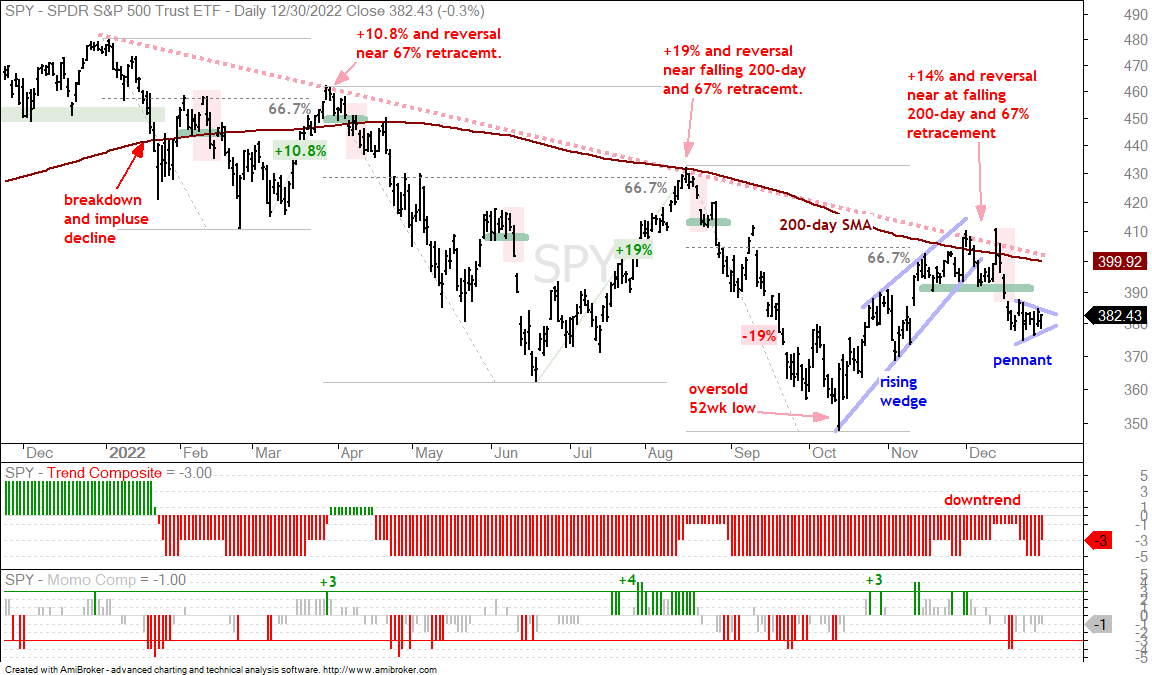
The S&P 500 SPDR (SPY) is in a long-term downtrend with the red dashed line marking the lower highs throughout 2022. There were three double-digit counter-trend advances and these failed near the 67% retracement lines (red arrows). Most recently, SPY advanced some 14% from mid October to early December and reversed the counter-trend advance with a break below 390 on January 15th. The retracement amount (2/3) and pattern (rising wedge) are typical for bear market bounces. This breakdown signals a continuation of the bigger downtrend and I expect a test of the October lows.
Short-term, SPY stalled after the mid December breakdown and formed a pennant. These short-term continuation patterns are dependent on the direction of the prior move for their trading bias. This pennant is bearish because the prior move was down. It represents a short-term consolidation or rest after the break down. A pennant break would signal a continuation of the mid December decline.
QQQ Underperforms
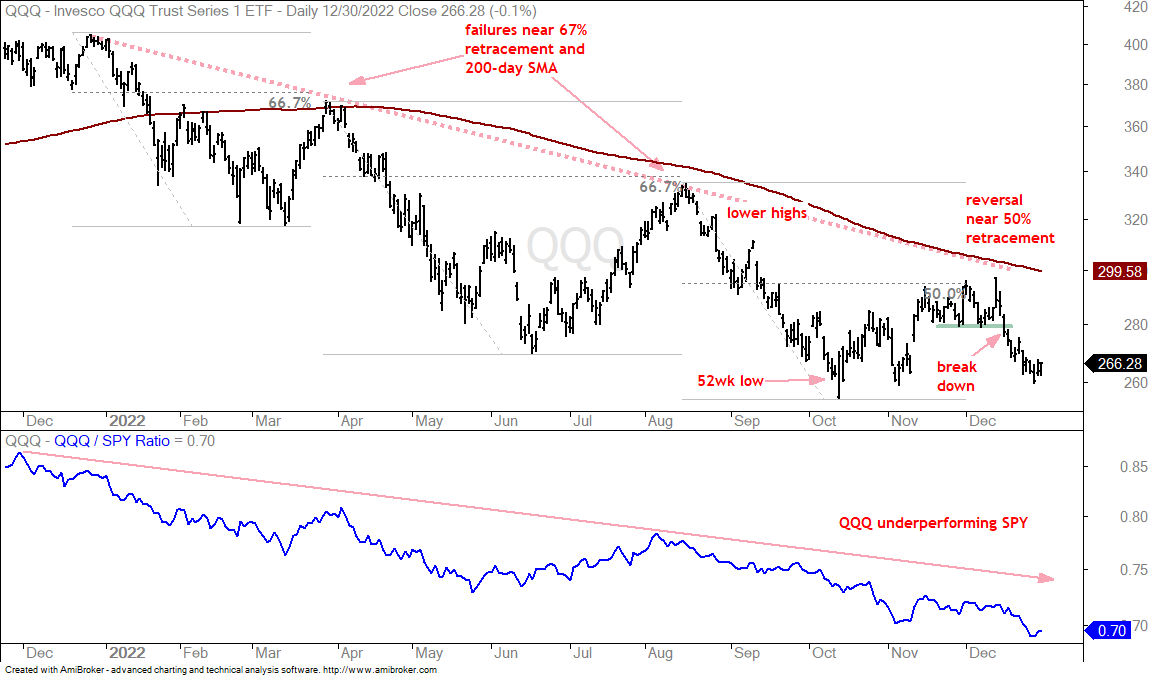
The next chart shows QQQ trending lower and underperforming SPY. Nasdaq 100 stocks account for some 35% of the S&P 500 and tech is the biggest sector (25.7%). Besides a big weighting, these stocks also represent the risk appetite in the stock market. Underperformance in QQQ shows risk aversion in the stock market. On the price chart, QQQ reversed near the 50% retracement line and broke short-term support with a sharp decline in mid December. The lower window shows the QQQ:SPY ratio trending lower and hitting a new low in late December.
You can learn more about my chart strategy in this article covering the different timeframes, chart settings, StochClose, RSI and StochRSI.
Equal-weight S&P 500 Show Relative Strength
Relative performance is a double-edged sword. If one name is outperforming and showing relative strength, then the other is underperforming and showing relative weakness. Large-caps are underperforming equal-weights and small-caps, which means equal-weight and small-caps are outperforming large-caps.
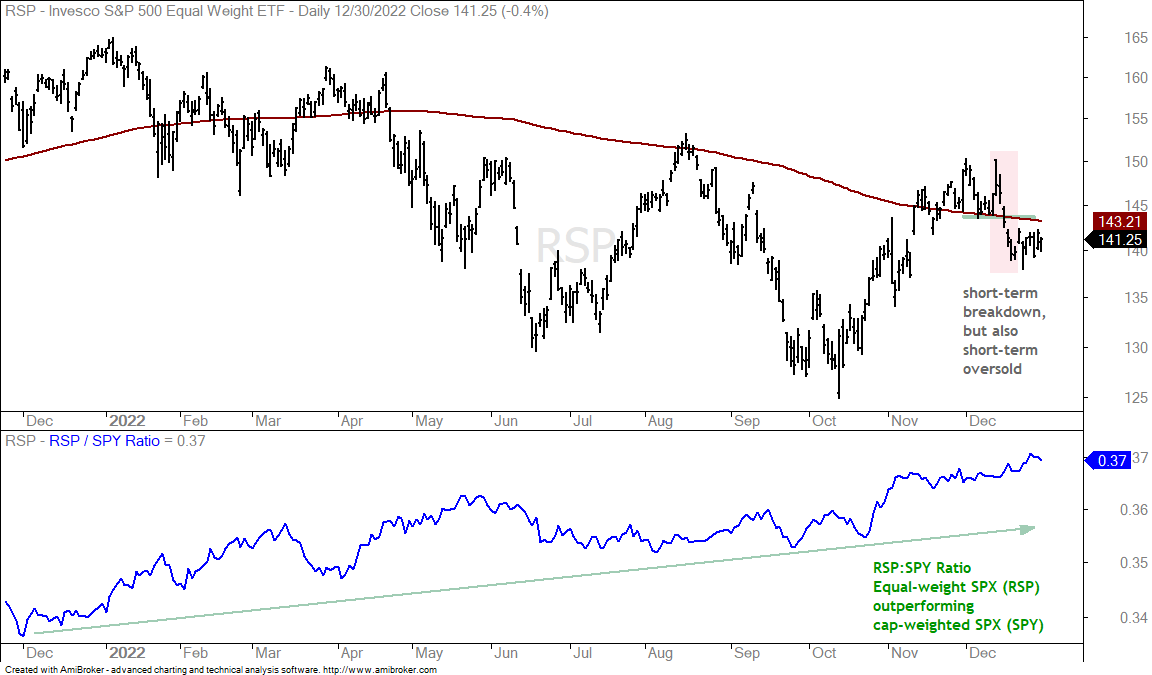
The price-relative captures relative performance with a ratio plot. The indicator window in the chart below shows the RSP:SPY ratio rising for over a year and hitting a new high in late December. This means the S&P 500 EW ETF (RSP) is outperforming the S&P 500 SPDR (SPY). Put another way, SPY is underperforming. RSP represents the average stock in the S&P 500, while SPY represents large-caps.
Even though RSP is outperforming SPY, the long-term trend for RSP is not exactly up. The ETF hit a 52-week low in October and did not exceed the August high with the surge into December. Short-term, RSP fell sharply in mid December and then immediately firmed. This is a short-term trend reversal, but this sharp decline also created a short-term oversold condition that could give way to a bounce.
Before looking at some other ETFs showing relative strength, keep in mind that the Composite Breadth Model is negative and we are in a bear market. Some ETFs are holding up better than the broader market and outperforming. Even so, I remain defensive because market conditions are unfavorable for stocks and stock-based ETFs. Defensive means higher levels of cash and less exposure to stocks. I am limiting stock exposure to ETFs showing relative strength or short-term setups.
Four Diverse ETFs Showing Relative Strength
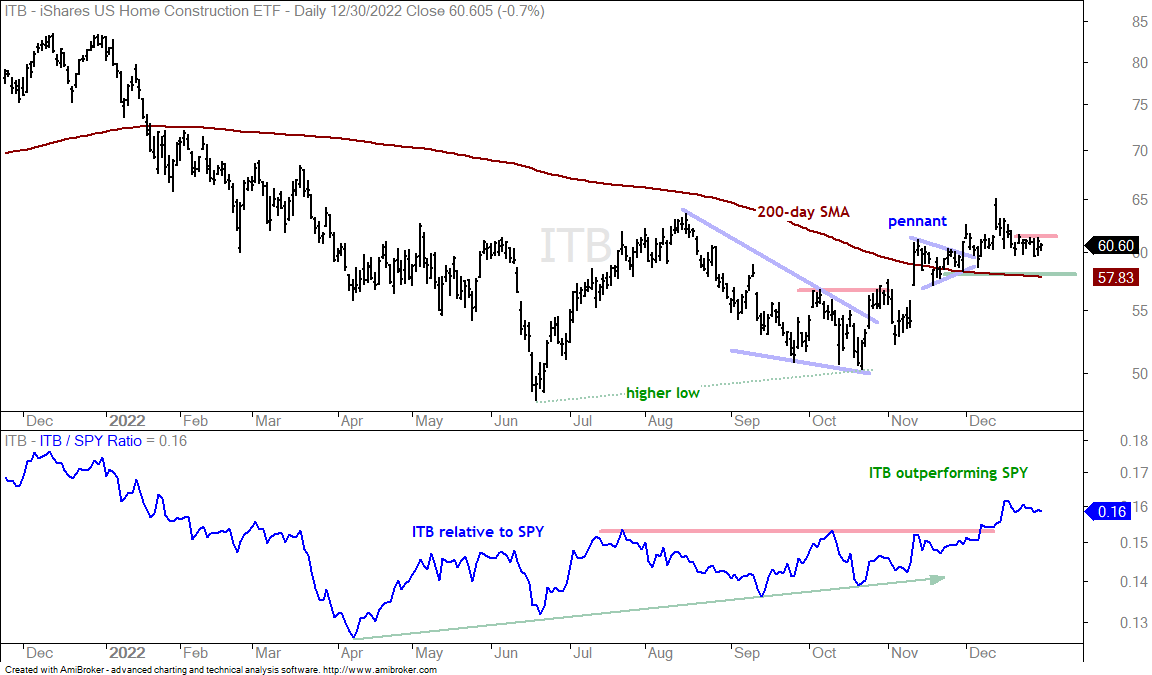
The first chart shows the Home Construction ETF (ITB) moving above its 200-day SMA, forming a pennant and breaking out of this pattern in early December. The ETF fell back over the last few weeks, but firmed around 60 and remains above the 200-day SMA. A short-term breakout would signal another upturn. The indicator window shows the price-relative (ITB:SPY ratio) breaking out in early December as ITB outperforms SPY.
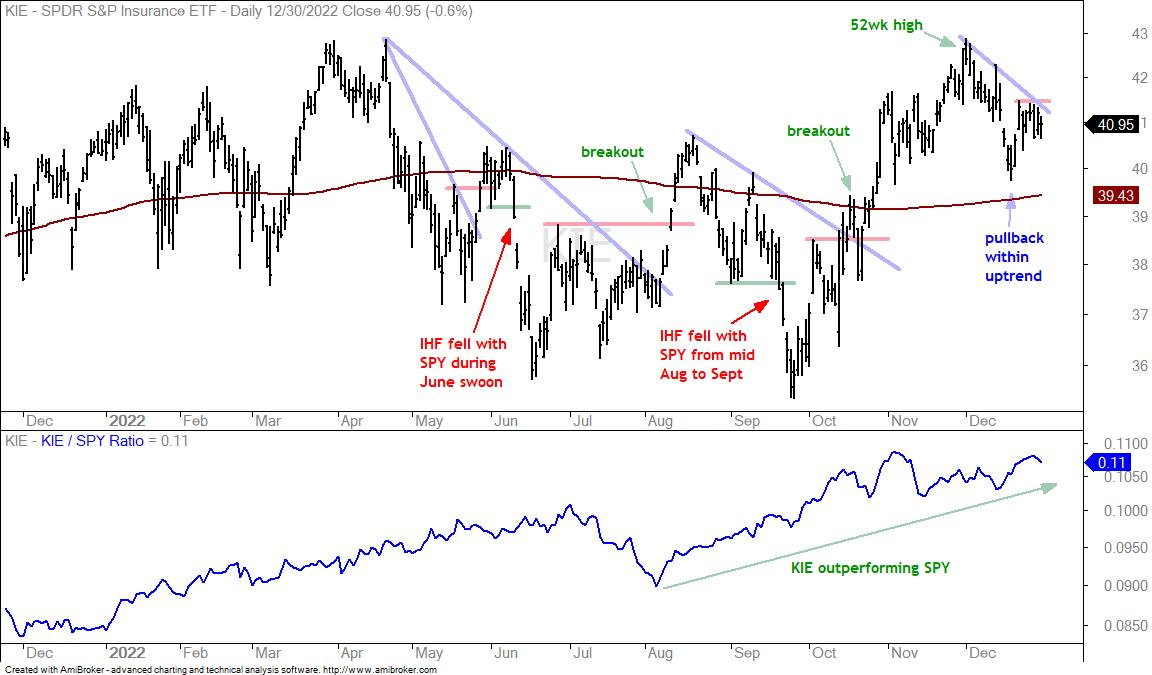
The next chart shows the Insurance ETF (KIE) hitting a 52-week high in early December and then correcting into mid December. This looks like a pullback within an uptrend and a breakout at 41.50 would reverse the short-term downswing. The indicator window shows the KIE:SPY ratio in an uptrend.
You can learn more about exit strategies in this post, which includes a video and charting options for everyone.
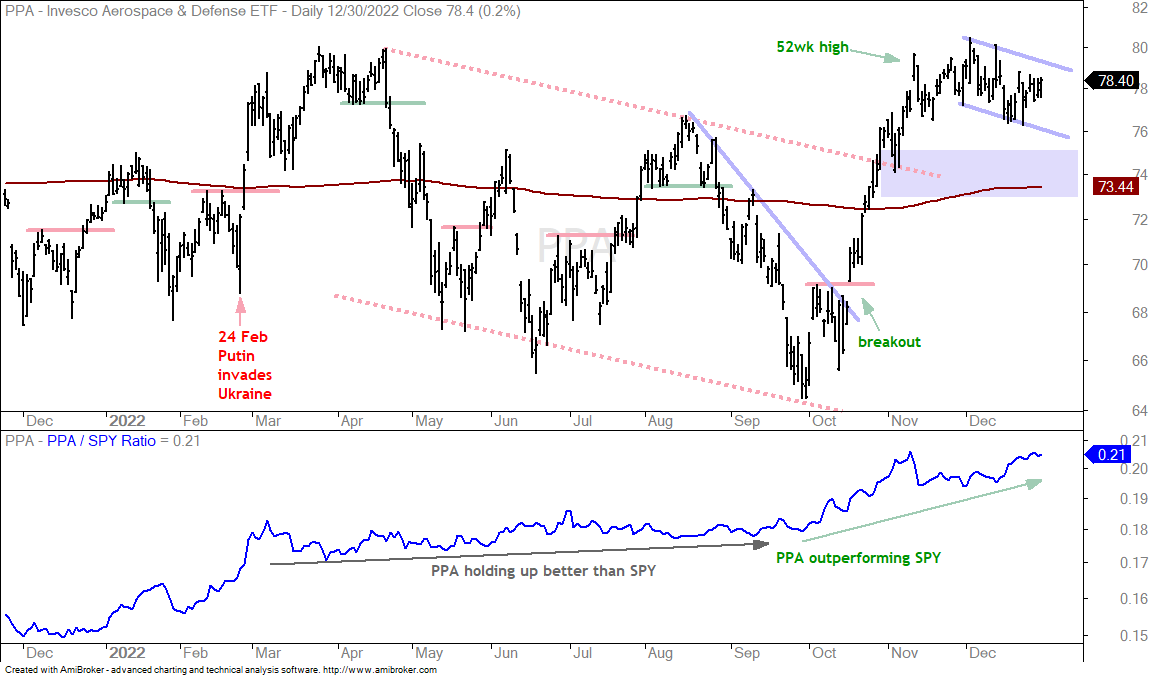
The next chart shows the Aerospace & Defense ETF (PPA) surging to a 52-week high in mid November and hitting another in early December. The ETF fell back the last few weeks and this looks like a consolidation after the big surge. An “ideal” pullback would extend back to the rising 200-day SMA, but the market does not always give us the ideal setup. I view this as a consolidation within an uptrend and a bullish continuation pattern. As such, I expect an upside breakout and continuation higher.
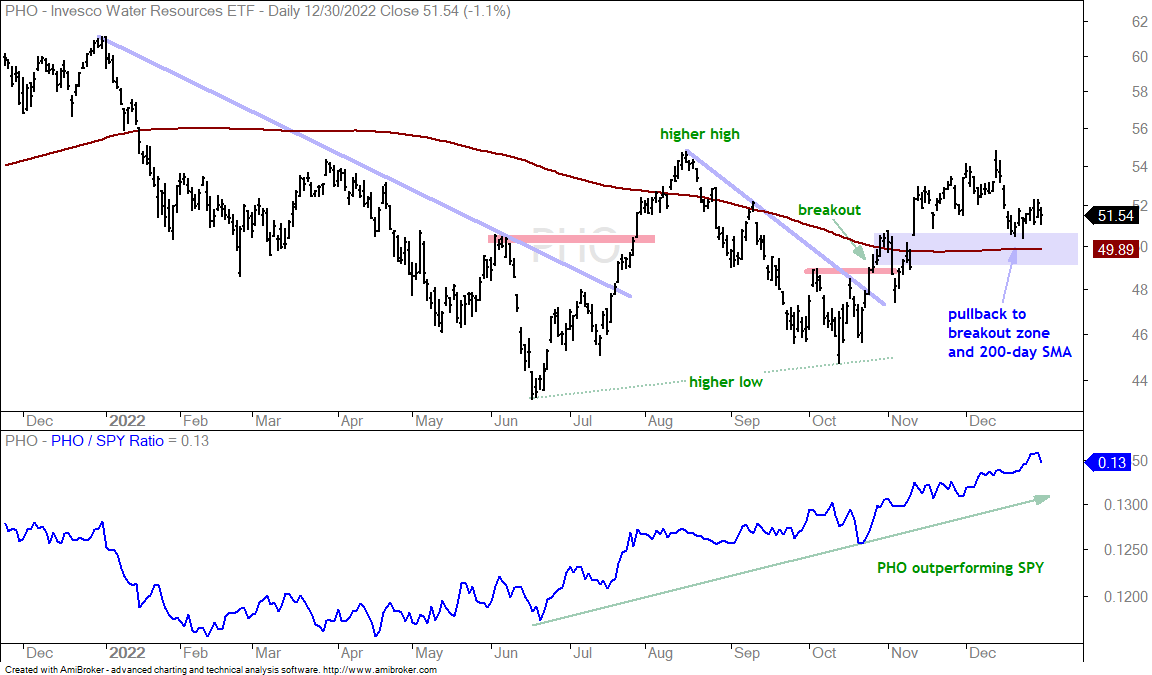
The next chart shows the Water Resources ETF (PHO) with a move above the 200-day SMA during the breakout advance from mid October to early December. The ETF fell with the rest of the market in mid December and became short-term oversold after a sharp decline. Notice that this decline returned to the breakout zone and 200-day SMA (blue shading). This is a good spot for a bounce and a continuation of the bigger uptrend.
Healthcare ETFs Outperforming Broader Market
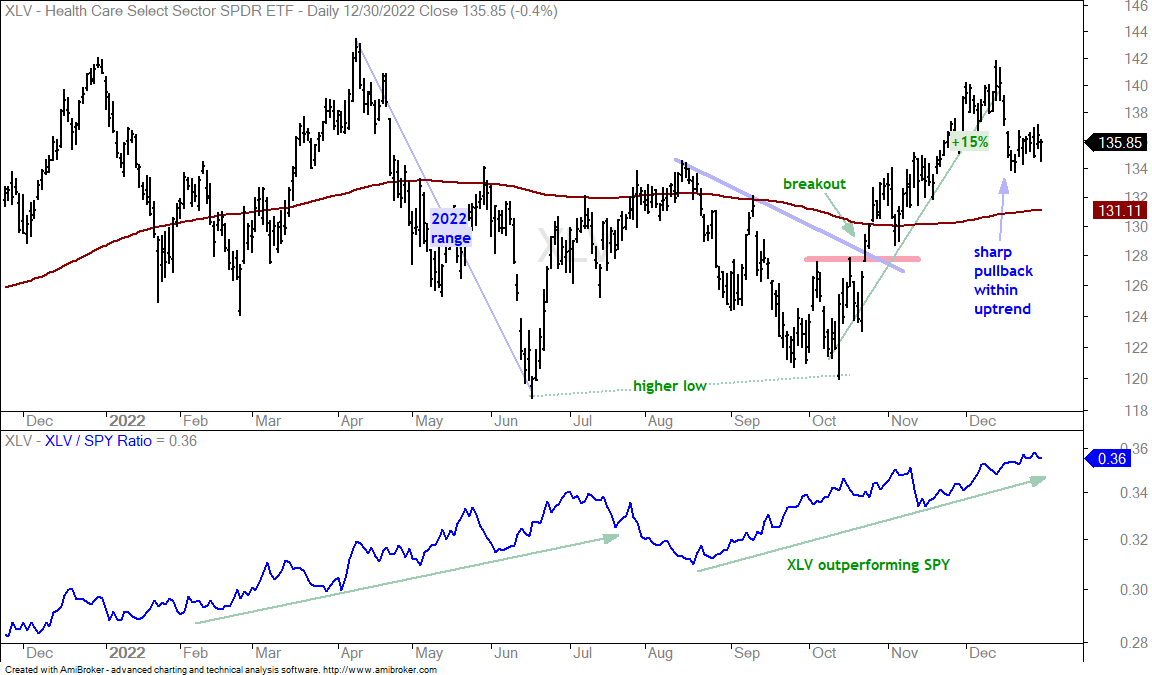
The next outperformance group is from the healthcare sector, which is one of the strongest sectors. The first chart shows the Healthcare SPDR (XLV) with a market-leading surge from mid October to early December and a sharp pullback in mid December. Again, this pullback created a short-term oversold condition within an uptrend, which is a mean-reversion opportunity.
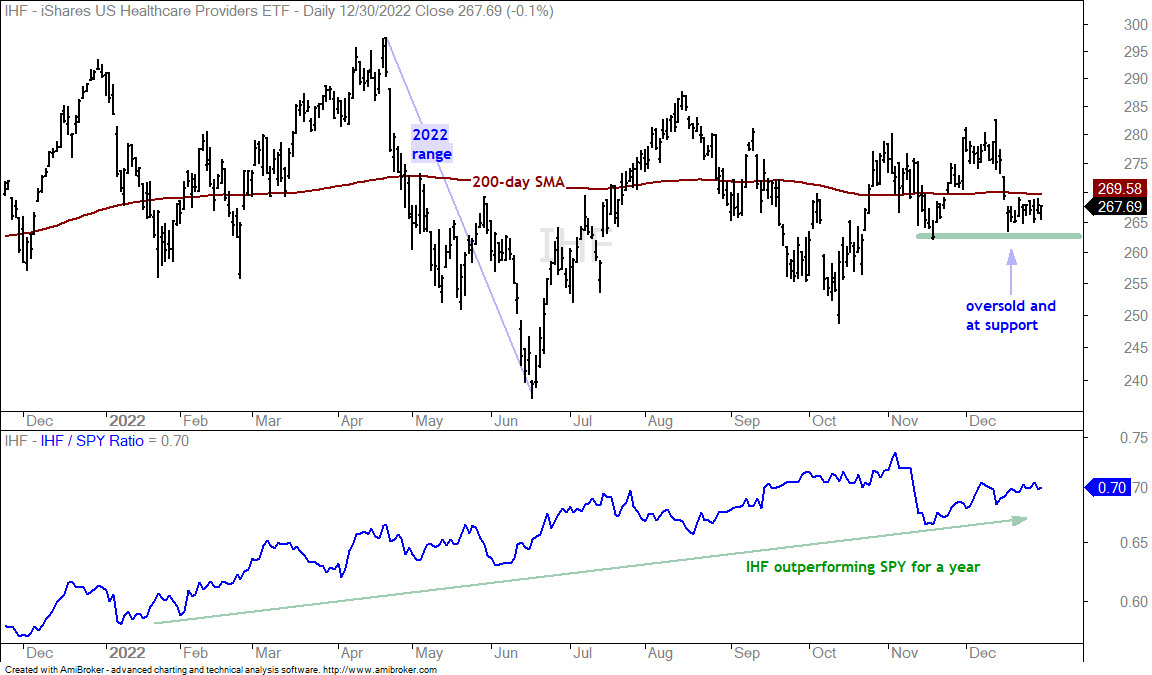
The Healthcare Providers ETF (IHF) shows a long-term trading range on the price chart and a rising price-relative in the indicator window. IHF is going nowhere, but outperforming SPY because it is holding up better. Short-term, the ETF fell sharply with the rest of the market in mid December and became oversold. The ETF is also near the November low and this combination could give way to an oversold bounce. Watch for a move back above the 200-day to get the ball rolling.
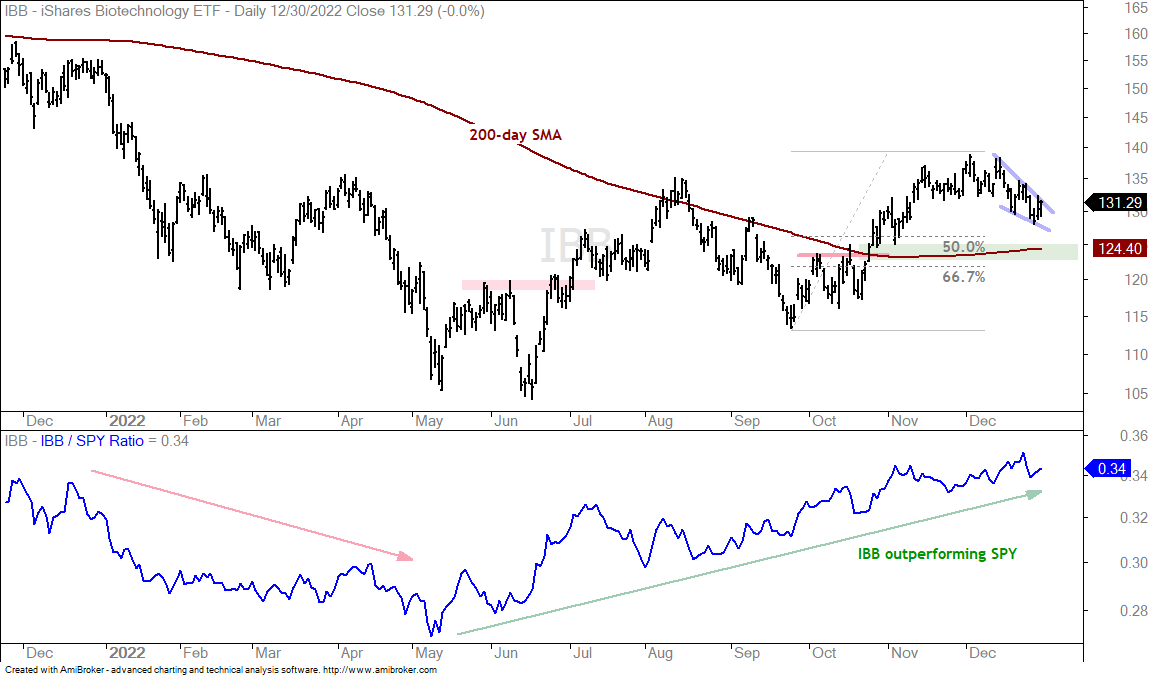
Next up we have the Biotech ETF (IBB) with a small falling wedge pullback in December. The pullback was not as sharp as the others and the ETF did not get back to the breakout zone (green shading). Nevertheless, it is a small correction within an uptrend and IBB is outperforming SPY. A wedge breakout would end this correction and signal a continuation higher.
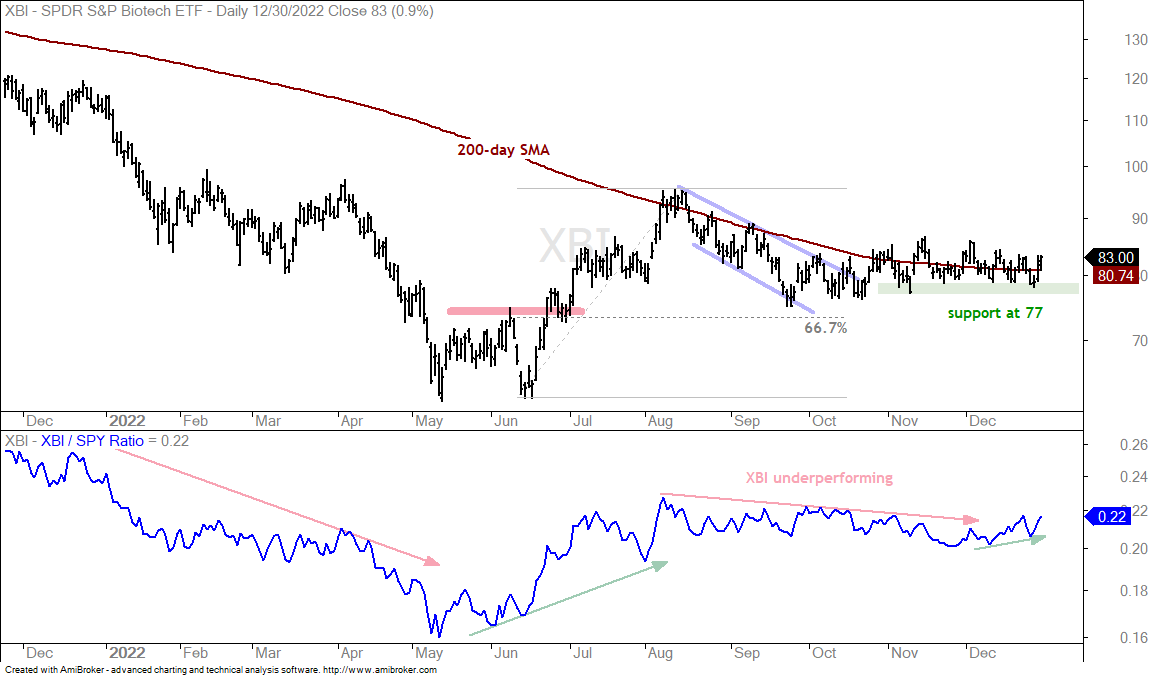
The Biotech SPDR (XBI) held support (green shading) the last few months and the cup remains half full. Overall, the ETF surged from mid June to mid August and corrected with a 2/3 retracement into September. The breakout in October never took hold as the ETF traded sideways the last few months, but support held at 77 and the bulls have the edge as long as it holds. The indicator window shows the price-relative (XBI:SPY ratio) turning up the last few weeks as XBI starts to outperform again.
Oil Forms Rising Wedge within Falling Wedge
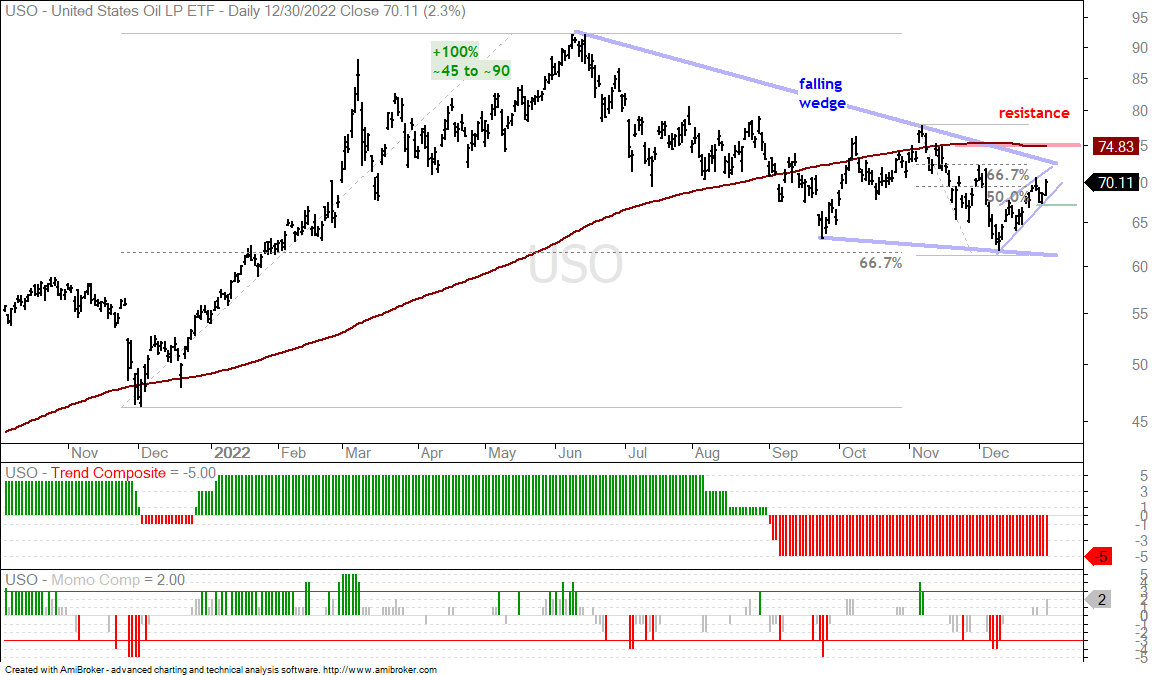
The US Oil Fund (USO) remains in a downtrend since summer with a large falling wedge taking shape. Hypothetically, this wedge could be one big correction after the 100% advance and a breakout at 75 would be bullish. The pattern (wedge) and retracement amount (2/3) are typical for corrections. Nevertheless, USO is currently below the falling 200-day SMA and the trend is down. Let’s see a breakout before turning long-term bullish on oil.
Short-term, USO bounced in December with a rising wedge that retraced 50-67 percent of the prior decline. This is the bear version because the pattern and retracement are typical for bear market bounces. A break below last week’s low (67) would reverse this upswing and signal a continuation of the bigger downtrend.
Energy ETFs Turn Mixed
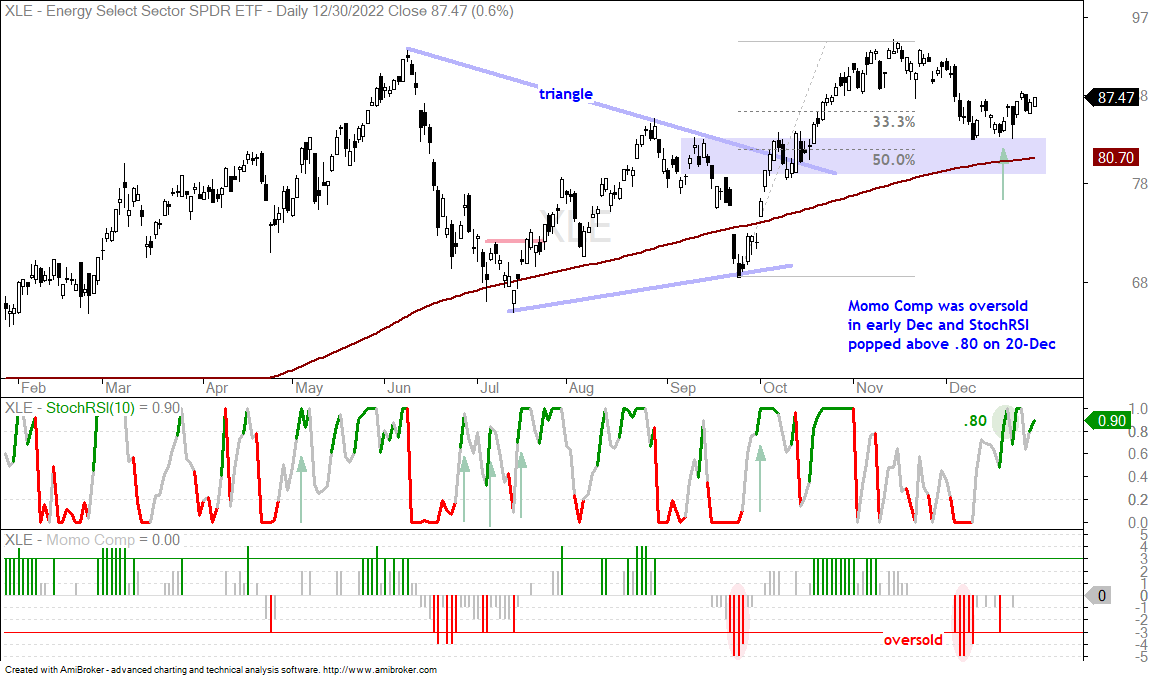
The Energy SPDR (XLE) is a leading ETF because it recorded a 52-week high in mid November and remains above its 200-day SMA. Short-term, the ETF fell back into early December and became oversold. Oversold conditions gave way to a short-term momentum thrust as StochRSI surged above .80 in mid December (green arrow). An oversold bounce is now underway.
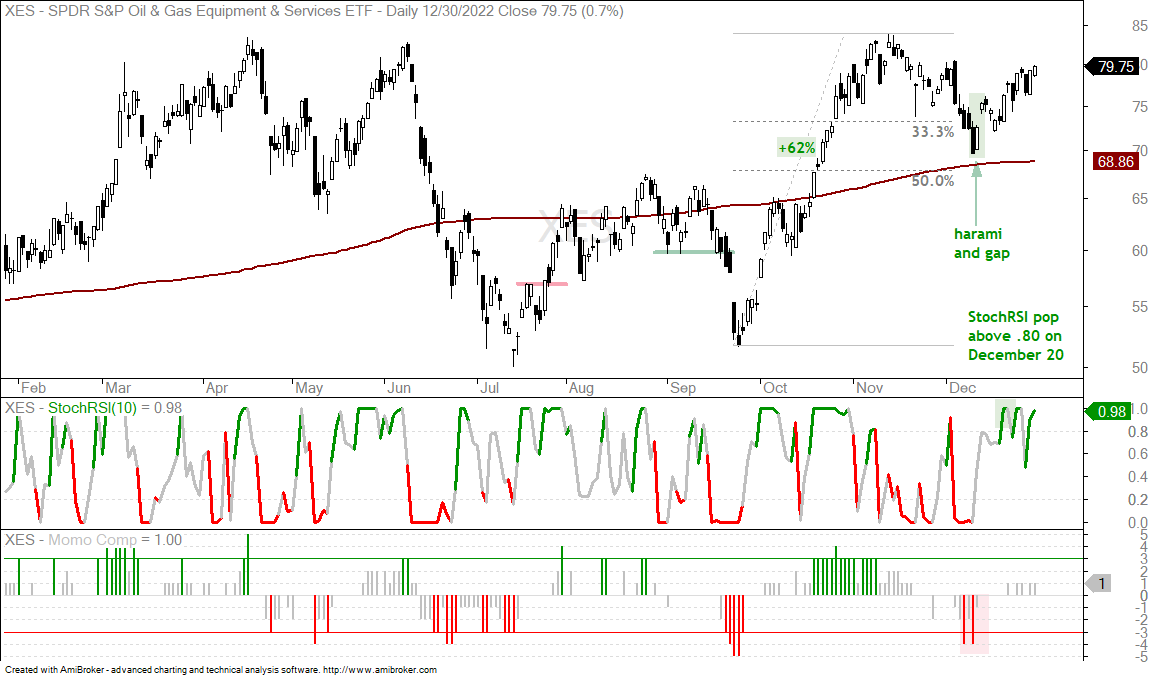
The next chart shows the Oil & Gas Equipment & Services ETF (XES) with a sharp decline towards the 200-day SMA in mid December, a harami on December 12th and a gap up the next day. XES extended on this oversold bounce with further gains the last two weeks.
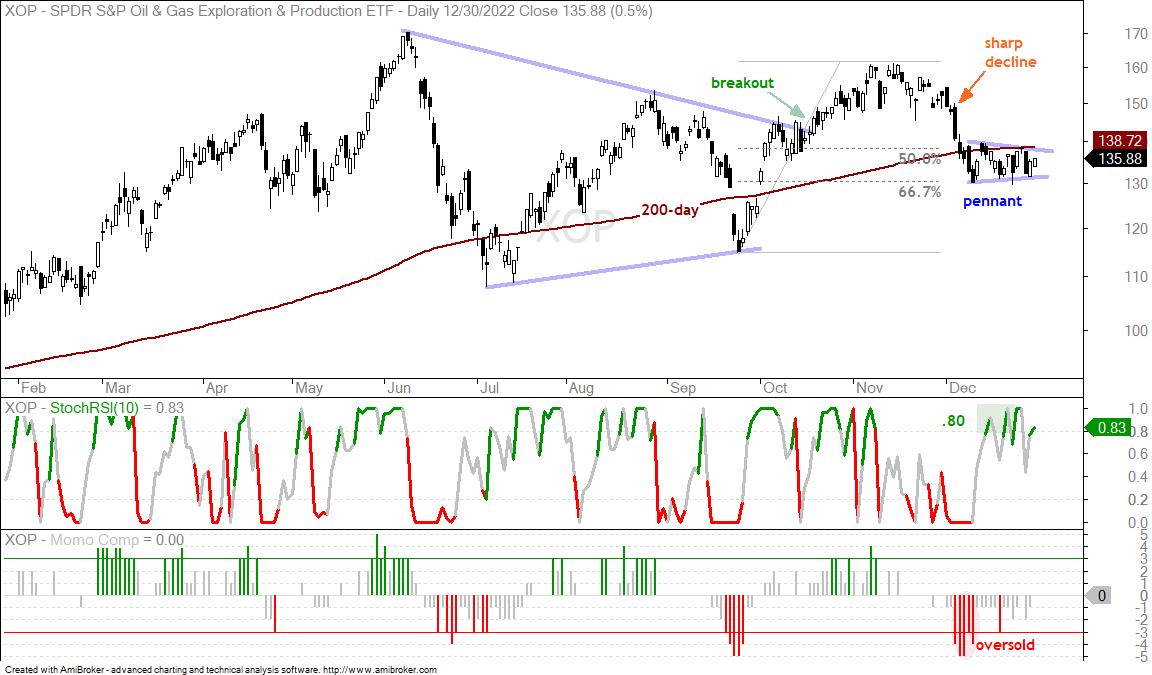
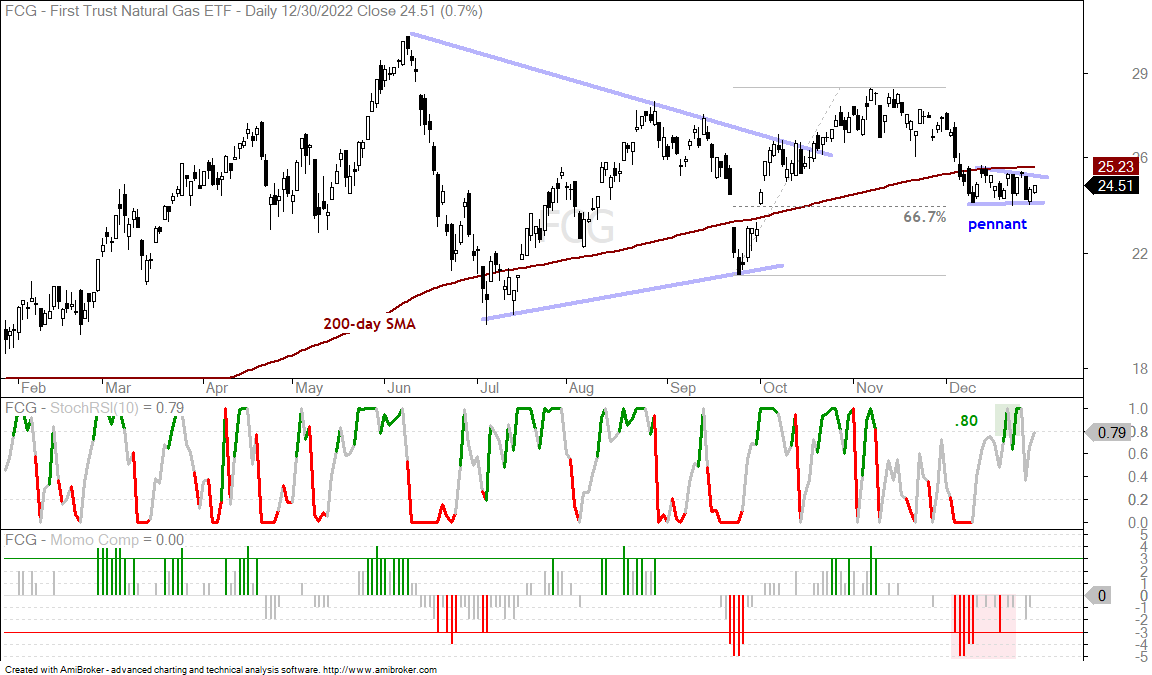
Not all energy-related ETFs turned up the last few weeks. The Oil & Gas Exploration & Production ETF (XOP) and Natural Gas ETF (FCG) did not move back above their 200-day SMAs and formed bearish pennants. The first chart shows XOP with a triangle breakout in mid October and a sharp decline below the 200-day SMA in early December. XOP is currently stalling in a potential reversal zone because it retraced 50-67% of the September-November advance. Technically, this is a short-term reversal zone. A break back above the 200-day SMA is needed to trigger a short-term bullish signal.
I would be concerned because XOP did not bounce along with oil, XLE and XES over the last few weeks. The ETF is also formed a pennant after the sharp decline into early December. This looks like a short-term bearish continuation pattern and a pennant break down would argue for further weakness. The next chart shows FCG with similar characteristics.
Copper Consolidates near 200-day
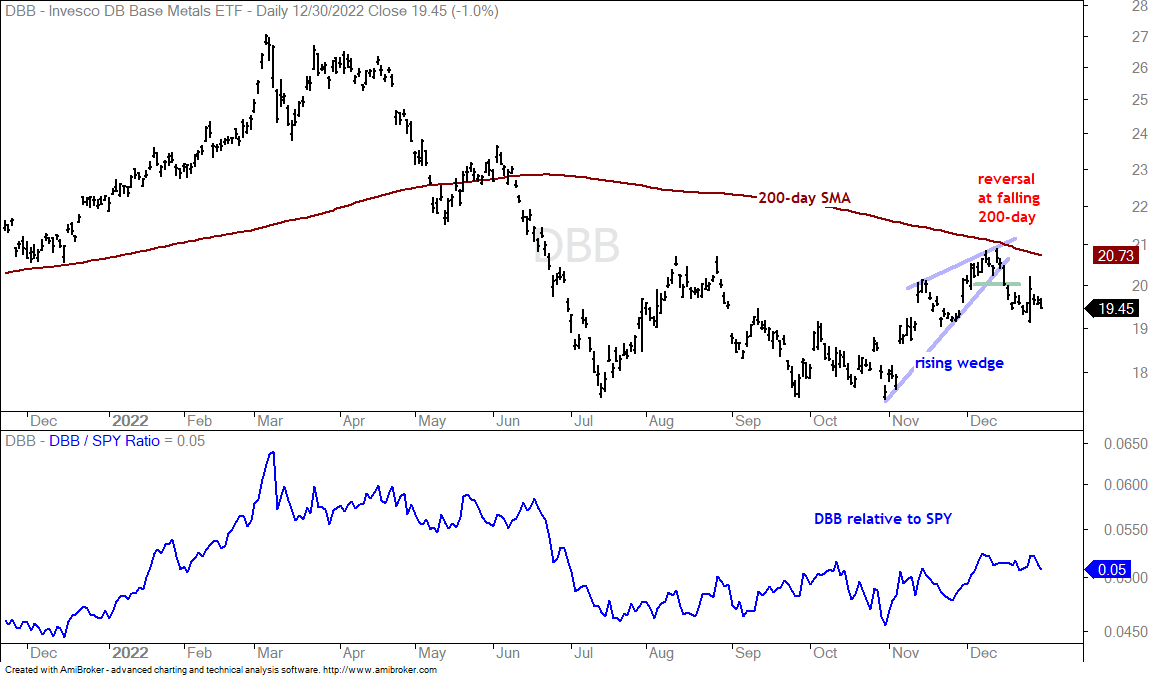
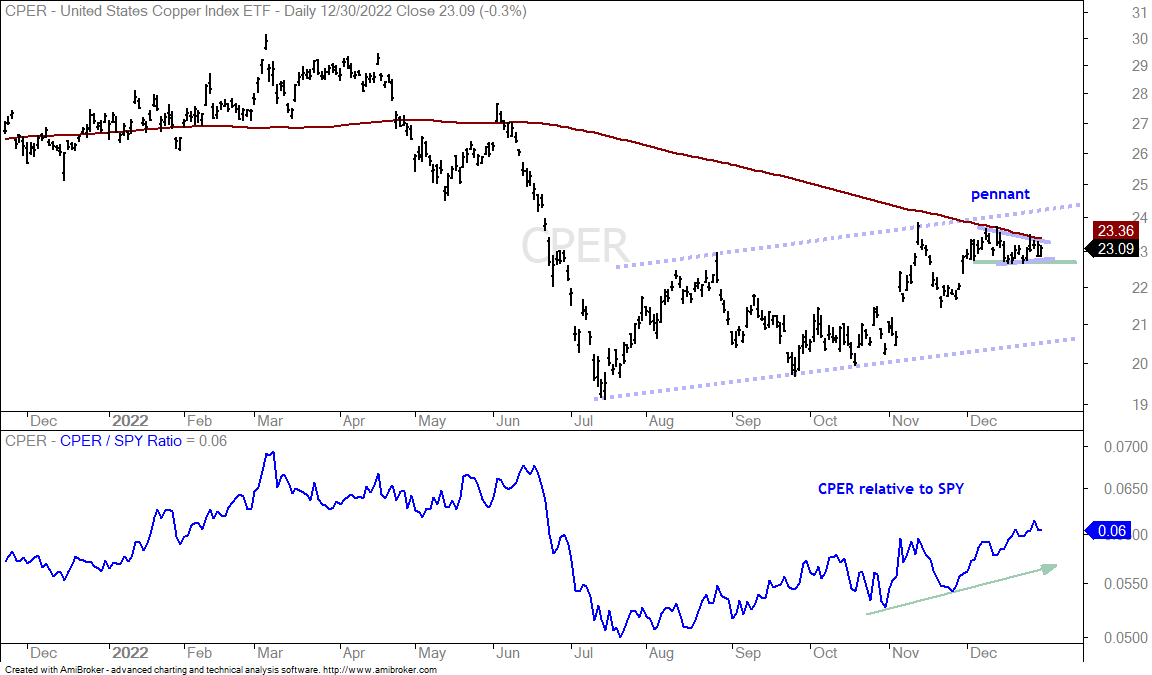
The Copper ETF (CPER) is holding up as it consolidates near the falling 200-day SMA, but the DB Base Metals ETF (DBB) reversed its short-term upswing with a sharp decline. The first chart shows DBB advancing to the 200-day SMA in December with a rising wedge forming. The ETF broke wedge support with a sharp decline in mid December. This reverses the short-term uptrend and signals a continuation of the long-term downtrend.
The breakdown in DBB is a concern for the Copper ETF (CPER) because copper is an industrial metal. CPER is holding up so far as it consolidates just below the 200-day SMA. A pennant is taking shape and a break above 23.5 would be bullish. Failure to break out and a support break at 22.6 would be bearish. This would signal a short-term reversal at the falling 200-day SMA.
Gold, Silver and Platinum Hold Strong
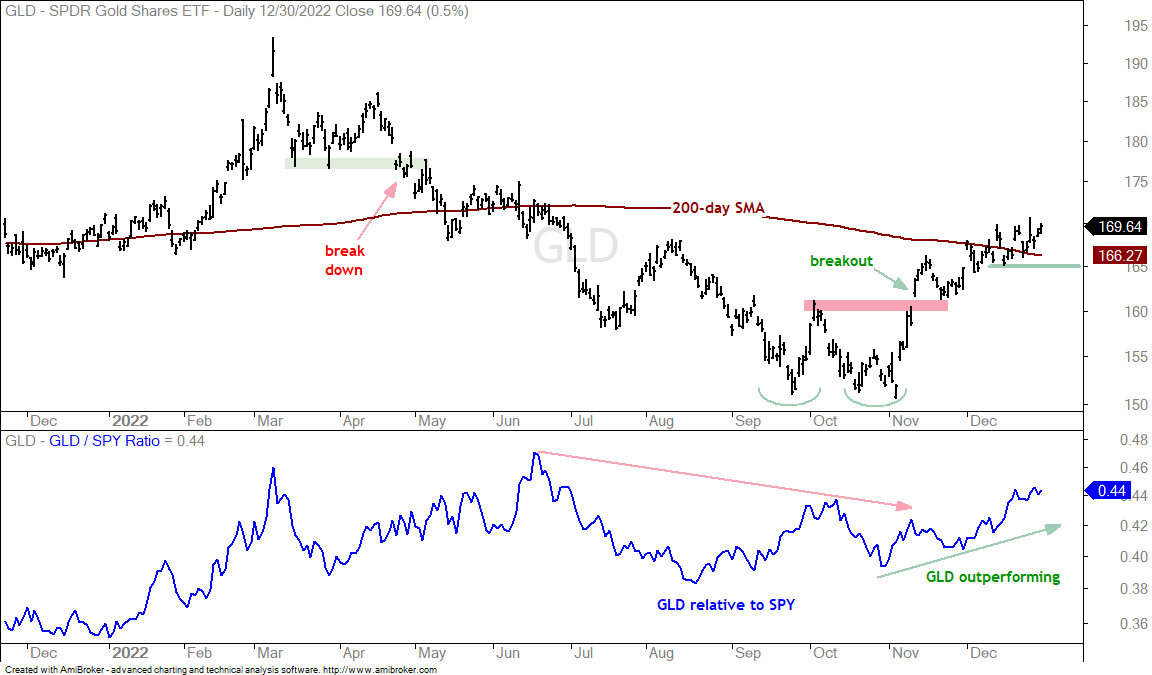
The Gold SPDR (GLD) broke out with a surge into mid November, held the breakout and worked its way higher the last six weeks. GLD is just above the 200-day SMA and outperforming SPY since late October. Today will be interesting because the Euro/Dollar is down over 1% in early trading and the Dollar Bullish ETF (UUP) is up over 1%. I continue to watch short-term support at 165 because the falling 200-day SMA is in play. A support break would signal a reversal at the falling 200-day SMA and this would be bearish.
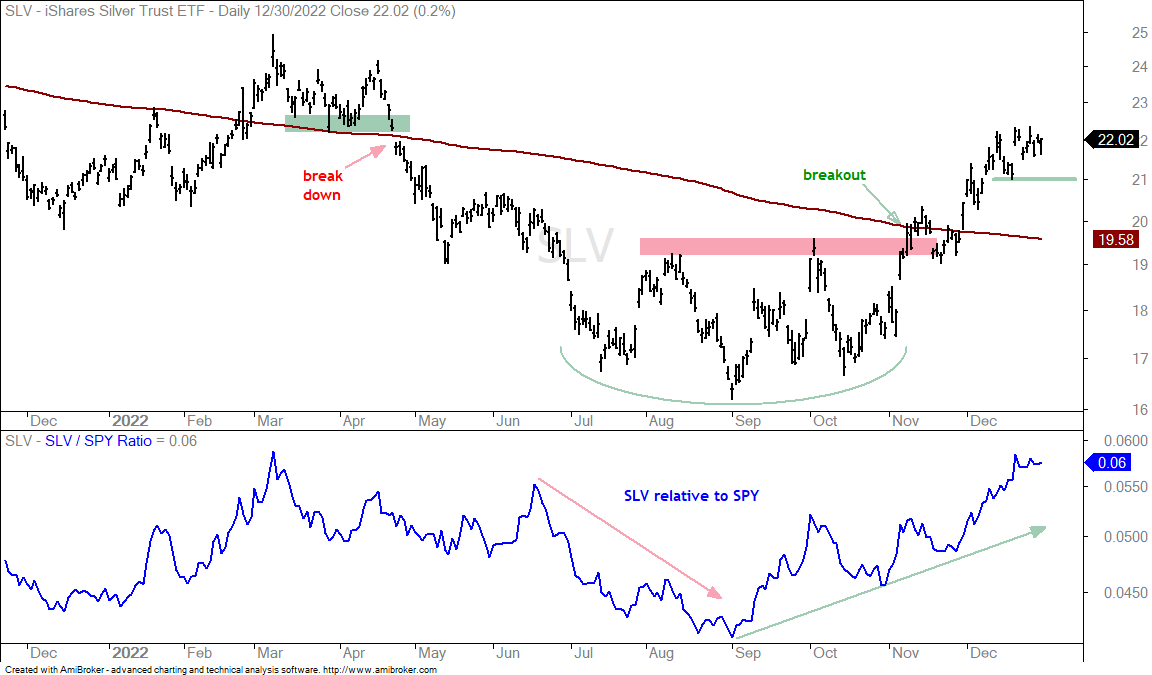
The Silver ETF (SLV) will take its cue from gold. Silver is bullish as long as gold holds up. A breakdown in GLD would be negative for SLV. I am marking support at 21 on the chart.
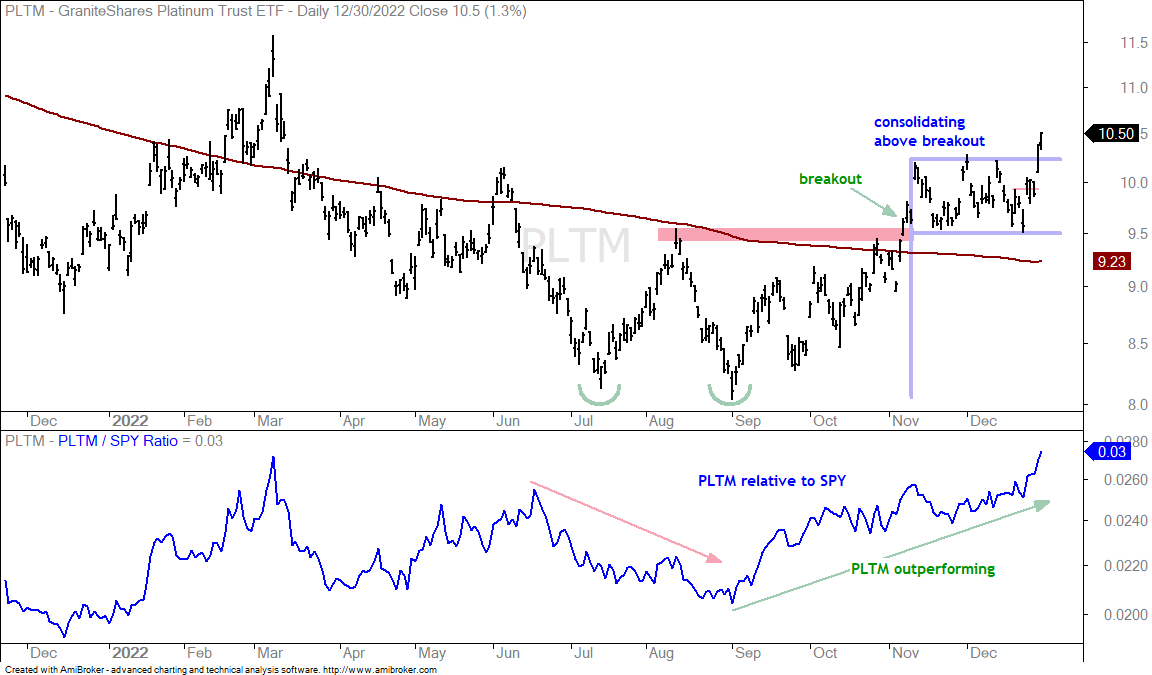
The Platinum ETF (PLTM) is the strongest of the three as it broke above its 200-day SMA with a surge in November, consolidated above this moving average and broke out with a surge the last five days. The pattern is a big flag and the flag breakout signals a continuation higher. The flag lows mark support at 9.50.
You can learn more about my chart strategy in this article covering the different timeframes, chart settings, StochClose, RSI and StochRSI.