Key Influences on Stock Performance – Bullish Patterns for Two Cybersecurity Stocks

Key Influences on Stock Performance – Bullish Patterns for Two Cybersecurity Stocks

Welcome to the Friday Chart Fix!

Trading is all about putting the odds in your favor. When picking stocks, we can improve our odds by staying on the right side of the market and focusing on names in leading sectors and industry groups. Today’s report starts with the market environment and a leading sector (tech). We then feature the leading uptrend in the Cybersecurity ETF and two names with bullish patterns.

  • Market, Sector and Industry Group Influence
  • Cybersecurity ETF in Leading Uptrend
  • Bullish Continuation Patterns for Two Cybersecurity Leaders

Recent Reports and Videos for Premium Members

  • Bullish Setups in Cloud, Software and 3 other Tech ETFs
  • A Bullish Breakout in an Aerospace Stock
  • Housing ETFs and Home Depot Test 200-day SMAs
  • 3-month Yield Points to Dovish Fed (Market Regime)
  • Bond ETFs Extend on Breakouts, but Still Lag Stocks
  • Click here to take a trial and gain full access.

Market, Sector and Industry Group Influence

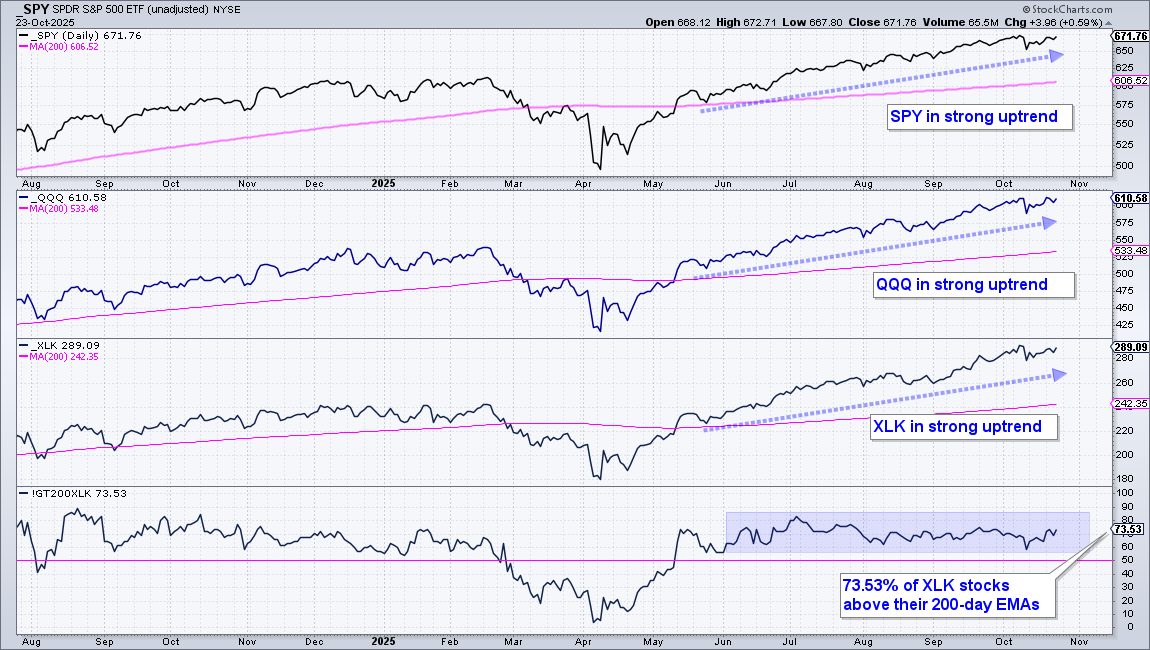
Many factors influence individual stock prices. Chief among these factors are the broad market environment, sector performance and industry group performance – in that order. Chartists should consider stocks during bull markets and stock alternatives during bear markets. There is clearly a bull market somewhere because SPY and QQQ hit new highs in October and remain well above their rising 200-day SMAs. Looking at sector performance, the Technology SPDR (XLK) is also in a leading uptrend and is the leading sector year-to-date (+24.91%). There is also broad strength within Technology because 73.55% of its stocks are above their 200-day EMAs. This is the second highest of the 11 sectors (XLU is tops with 100%!).

Looking for indicators with an edge? Check out the TIP Indicator-Edge Plugin for StockCharts ACP. Click here to learn more.

Cybersecurity ETF in Leading Uptrend

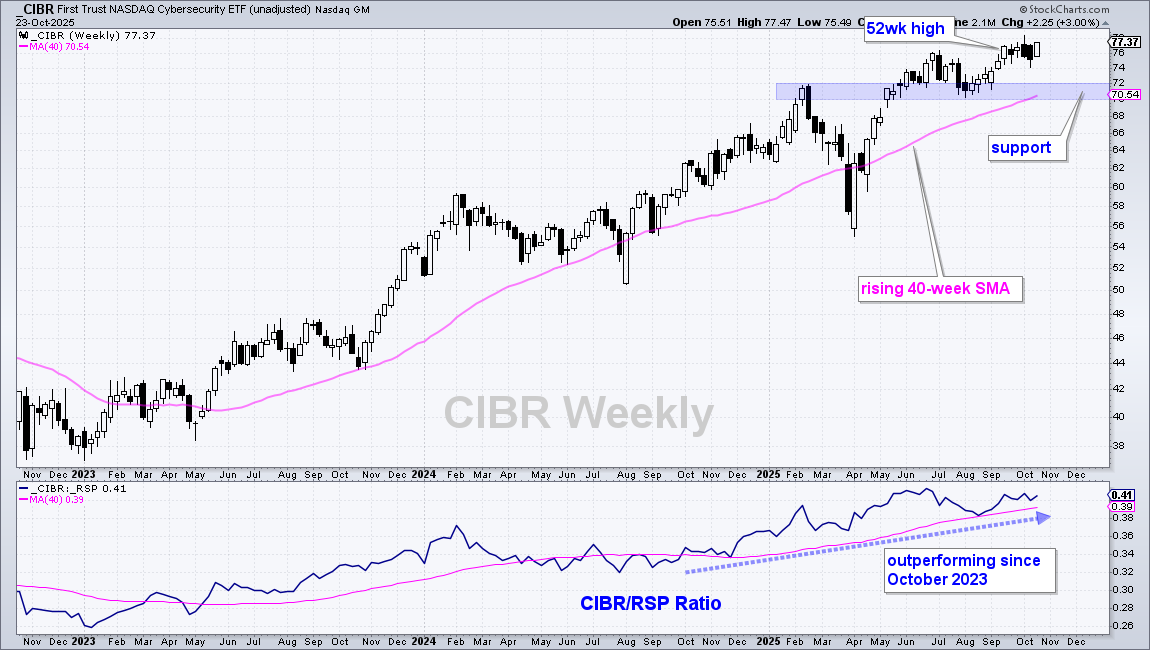
Within the technology sector, the Cybersecurity ETF (CIBR) is in a leading uptrend with price near a 52-week high and a rising relative performance line. Until these facts change, I expect this uptrend to continue. On the price chart, the trend is clearly up as CIBR hit 52-week highs from June to October and remains above the rising 40-week SMA. Broken resistance, the summer lows and 40-week SMA mark long-term support in the 70-72 area (blue shading). The bottom window shows the price-relative (CIBR/RSP ratio) turning up in late September 2023 and rising throughout 2025. This ratio rises when CIBR outperforms and falls when CIBR underperforms. The trend here favors relative strength because the price-relative is above its rising 40-week SMA.

Cup-with-Handle Pattern for Two Leaders

The market environment is bullish, technology is a leading sector and the Cybersecurity ETF sports a leading uptrend. This is an industry that warrants our attention for individual stock setups. Let’s look at two with classic bullish continuation patterns.

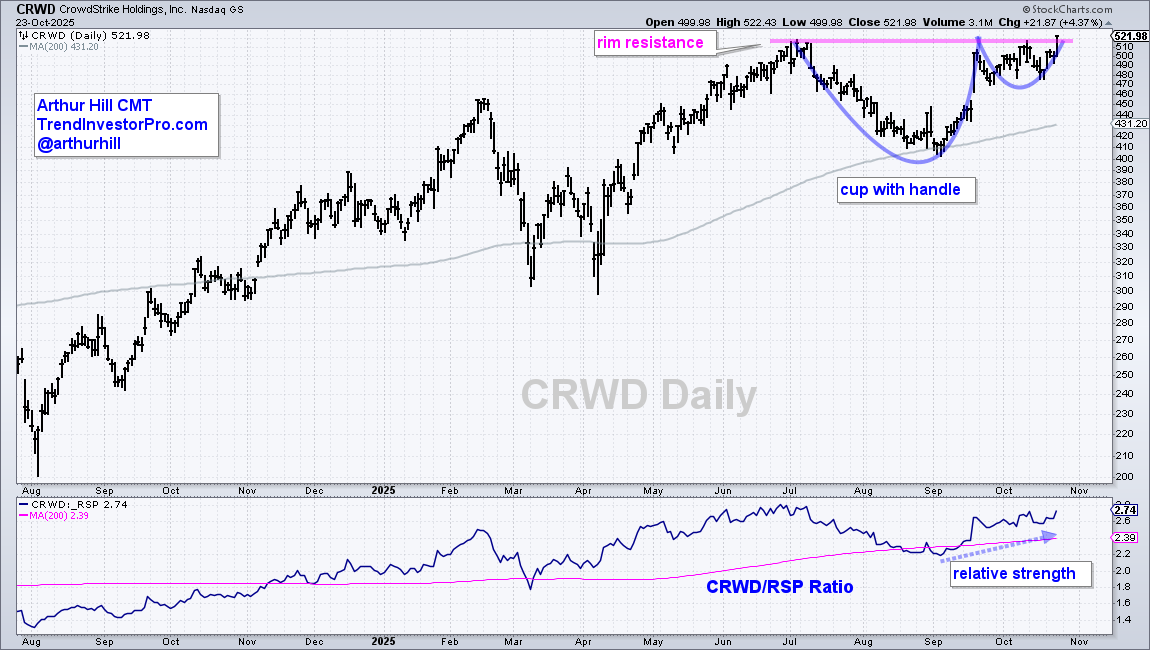
Popularized by William O’Neil of IBD, the cup-with-handle is a bullish continuation pattern. Here are some key characteristics. First, note that bullish continuation patterns form within uptrends and represent a consolidation within the uptrend. The cup forms with a pullback and recovery back to the prior highs. The handle forms with a shallower pullback or consolidation near the highs. Shallow pullbacks signal a decrease in selling pressure, which is a positive sign. The pattern highs mark rim resistance and overhead supply. A break above rim resistance signifies a material increase in buying pressure because demand overpowered supply. This breakout also signals the end of the consolidation phase and the resumption of the bigger uptrend.

The chart above shows CrowdStrike (CRWD) with the cup-with-handle forming above the rising 200-day SMA. The right side of the pattern looks like a surge-flag setup. CRWD surged from the 200-day to rim resistance and then consolidated within a tight range. With a surge on Thursday, the stock broke rim resistance and recorded a fresh 52-week high. The lower window shows the price-relative (CRWD/RSP ratio) rising since early September as CrowdStrike outperforms. Note that I featured this stock in late August as it tested the 200-day SMA with a classic correction.

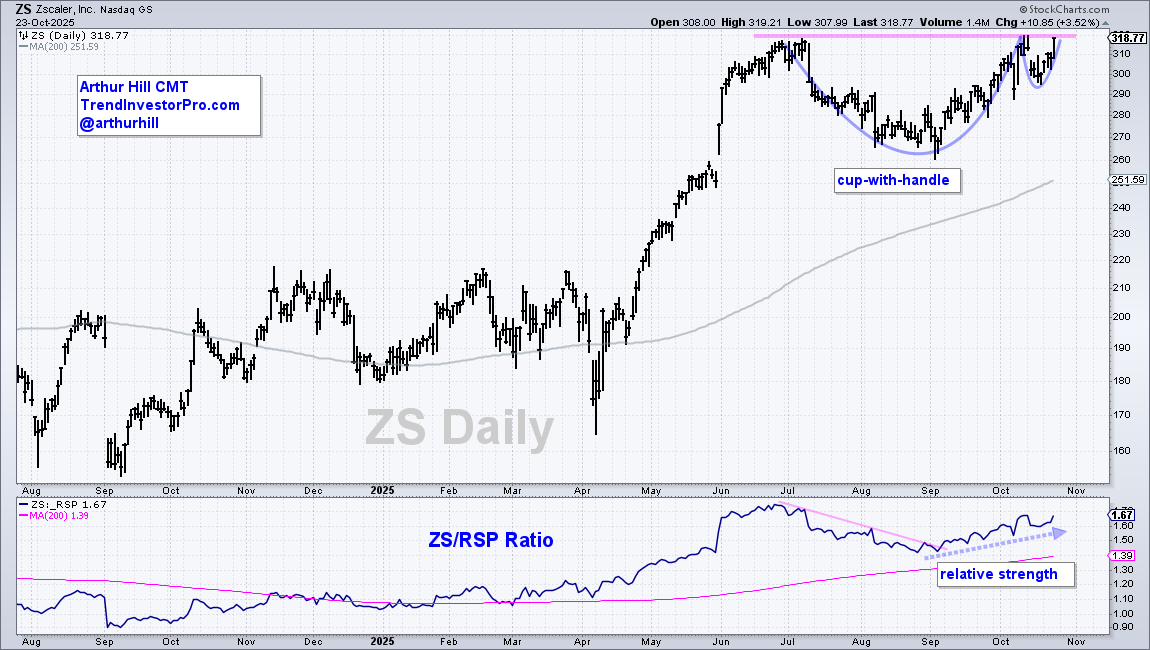
The next chart shows Zscaler (ZS) forming a cup-with-handle well above the rising 200-day SMA. ZS is currently challenging rim resistance and a breakout would confirm the pattern. The lower window shows the ZS/RSP ratio turning up in early September as ZS resumed its relative strength uptrend. Note that I featured ZS in early September as it firmed near a key retracement.

Recent Reports and Videos for Premium Members

  • Bullish Setups in Cloud, Software and 3 other Tech ETFs
  • A Bullish Breakout in an Aerospace Stock
  • Housing ETFs and Home Depot Test 200-day SMAs
  • 3-month Yield Points to Dovish Fed (Market Regime)
  • Bond ETFs Extend on Breakouts, but Still Lag Stocks
  • Click here to take a trial and gain full access.

Rotation Investor ETF – Ranking Table

This page covers the ranking table for the rotation strategy trading ETFs (RO-Investor-ETF). The ranking table shows the ETF universe with a sortable prefix, which makes it easy to find specific groups (tech ETFs, commodity ETFs). Table indicators include the Momentum Rank, Trend Trio (up/down), Broad Breadth Model (bull/bear), the momentum indicator and the 5-day change in momentum. The default sort puts the strongest ETFs at the top and each ETF includes a SharpChart link.

Rotation Investor ETF – Ranking Table Read More »

Rotation Investor NDX100 – Ranking Table

This page covers the ranking table for the rotation strategy trading Nasdaq 100 stocks (RO-Investor-NDX). The ranking table includes the sector and industry for sorting to find specific groups (software, semiconductor). Table indicators include the Momentum Rank, PPO Trend (up/down), Broad Breadth Model (bull/bear), the NDX momentum indicator and the 5-day change in momentum. The default sort puts the strongest stocks at the top and each stock includes a SharpChart link.

Rotation Investor NDX100 – Ranking Table Read More »

Trend Composite Signals for S&P 500 Stocks

This page shows Trend Composite signals for stocks in the S&P 500. The Trend Composite aggregate trend signals in five trend-following indicators. Recent signals appear at the top of the table. Users can also sort by different columns and single out specific sectors using the search function. Stocks in uptrends are color coded green for quick identification. This table includes the signal date, gain/loss since the signal and a chart link.

Trend Composite Signals for S&P 500 Stocks Read More »

Rotation Investor NDX100 – Signals & Portfolio

This page covers the signals and portfolio for the rotation strategy trading Nasdaq 100 stocks (RO-Investor-NDX). The strategy starts with our stock market breadth model to define the broad market environment. There is a table showing the current portfolio, gain/loss and new entry/exit signals. Two sidebars make it easy to compare the current ranking with the prior week’s ranking, and see which stocks made the cut. A second table shows the most recent closed positions with their gain/loss and bars traded.

Rotation Investor NDX100 – Signals & Portfolio Read More »

Rotation Investor SPX500 – Signals & Portfolio

This page covers the signals and portfolio for the rotation strategy trading S&P 500 stocks (RO-Investor-SPX). The strategy starts with our stock market breadth model to define the broad market environment. There is a table showing the current portfolio, gain/loss and new entry/exit signals. Two sidebars make it easy to compare the current ranking with the prior week’s ranking, and see which stocks made the cut. A second table shows the most recent closed positions with their gain/loss and bars traded.

Rotation Investor SPX500 – Signals & Portfolio Read More »

Rotation Investor ETF – Signals and Portfolio

This page covers the signals and portfolio for the rotation strategy trading ETFs (RO-Investor-ETF). The strategy starts with our stock market breadth model to define ETF eligibility. There is a table showing the current portfolio, gain/loss and new entry/exit signals. Two sidebars make it easy to compare the current ranking with the prior week’s ranking, and see which ETFs made the cut. A second table shows the most recent closed positions with their gain/loss and bars traded.

Rotation Investor ETF – Signals and Portfolio Read More »

Rotation Investor SPX500 – Ranking Table

This page covers the ranking table for the rotation strategy trading S&P 500 stocks (RO-Investor-SPX). The ranking table includes the sector and industry for sorting to find specific groups (housing, semiconductor). Table indicators include the Momentum Rank, Trend Filter (strong/not), Broad Breadth Model (bull/bear), the SPX momentum indicator and the 5-day change in momentum. The default sort puts the strongest stocks at the top and each stock includes a SharpChart link.

Rotation Investor SPX500 – Ranking Table Read More »

Trend Signals & StochClose Rank for ETFs

Using a 270 ETF universe, this page covers Trend Composite signals for trend and StochClose values for ranking. Users can identify new trend signals, track existing signals and see the percentage change. Sortable columns make it easy to filter for uptrends and then sort by StochClose to rank trend strength. The table includes links to a StockCharts chart with corresponding indicators.

Trend Signals & StochClose Rank for ETFs Read More »

Broad Breadth Model – Current Signal

Updated at the end of every week (usually Saturday mornings), this page shows charts and current signals for the Broad Breadth Model (BBM). The model uses an array of breadth indicators from various indexes for a weight of the evidence approach to assess conditions for the broader stock market (large-caps, mid-caps, small-caps). Stock market conditions are favorable when this model is bullish (positive) and unfavorable when the model is bearish (negative).

Broad Breadth Model – Current Signal Read More »

Scroll to Top