What Happens to Bitcoin Should QQQ Correct?

The odds are increasing for a correction in the stock market. This week we looked at three indicators pointing in that direction and provided targets for SPY and QQQ. Small-caps and mid-caps could feel it the most because they are still underperforming large-caps. A broad market correction would also weigh on most sector and industry groups.

The table below shows SPY and the 11 sector SPDRs with the Correlation Coefficient (65,SPY) in the right column. The Technology SPDR (XLK) has the strongest positive correlation (.994), which means XLK almost always moves in the same direction as SPY. Thus, should SPY correct, the chances are very high that XLK will correct, and QQQ by extension. 

At the bottom of the table, the Consumer Staples SPDR (XLP) and Healthcare SPDR (XLV) have the weakest correlations to SPY (<. 10). These two may be the most immune to a correction in SPY.

This week at TrendInvestorPro:

  • 3 Indicators Pointing to a Correction and Targets for SPY/QQQ
  • Tech ETFs Lead the Way, but become very Extended
  • Utilities Break Out, Gold Maintains Bullish Pattern, IBIT Support Levels
  • The Ultimate ETF ChartLists – Delivered to your StockCharts Account

Click here to see are most recent reports and videos.

Bitcoin, QQQ and Correlation

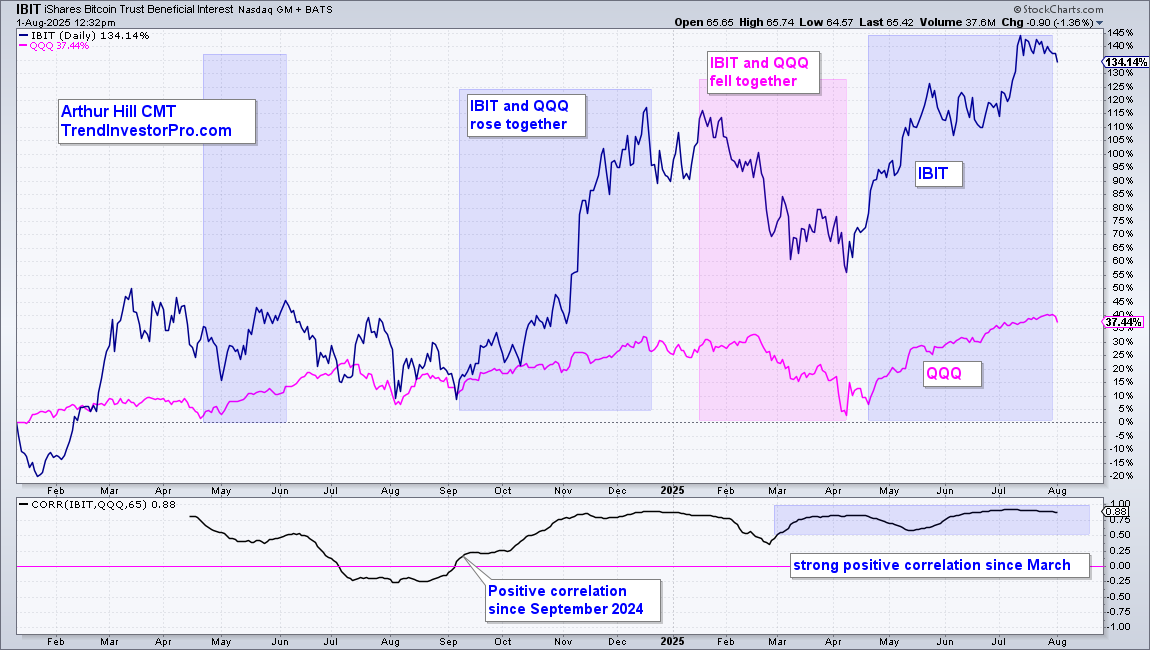
But what about equity alternatives, such as Bitcoin? For clues on Bitcoin,  chartists can compare performance and use correlation analysis. The chart below shows Price Performance for the Bitcoin ETF (IBIT) in blue and QQQ in pink. IBIT is the clear winner since January 2024 with a 134% gain. QQQ is up a meager 37.5% (LOL).

The blue shading shows periods when they rose together and the pink shading shows a period when they fell together. Rising and falling together means they are positively correlated. This correlation is especially strong since late March 2025.

The indicator window quantifies this correlation using the Correlation Coefficient (65). This indicator was negative in July-August 2024, but positive since September 2024 and above .50 since March 2025. This shows a strong positive correlation the last five months, which makes sense because IBIT and QQQ are risk-on assets. As such, they will likely rise and fall together.

Click here to see are more recent reports and videos.

Rotation Investor NDX100 – Signals & Portfolio

This page covers the signals and portfolio for the rotation strategy trading Nasdaq 100 stocks (RO-Investor-NDX). The strategy starts with our stock market breadth model to define the broad market environment. There is a table showing the current portfolio, gain/loss and new entry/exit signals. Two sidebars make it easy to compare the current ranking with the prior week’s ranking, and see which stocks made the cut. A second table shows the most recent closed positions with their gain/loss and bars traded.

Rotation Investor NDX100 – Signals & Portfolio Read More »

Rotation Investor SPX500 – Signals & Portfolio

This page covers the signals and portfolio for the rotation strategy trading S&P 500 stocks (RO-Investor-SPX). The strategy starts with our stock market breadth model to define the broad market environment. There is a table showing the current portfolio, gain/loss and new entry/exit signals. Two sidebars make it easy to compare the current ranking with the prior week’s ranking, and see which stocks made the cut. A second table shows the most recent closed positions with their gain/loss and bars traded.

Rotation Investor SPX500 – Signals & Portfolio Read More »

Rotation Investor ETF – Signals and Portfolio

This page covers the signals and portfolio for the rotation strategy trading ETFs (RO-Investor-ETF). The strategy starts with our stock market breadth model to define ETF eligibility. There is a table showing the current portfolio, gain/loss and new entry/exit signals. Two sidebars make it easy to compare the current ranking with the prior week’s ranking, and see which ETFs made the cut. A second table shows the most recent closed positions with their gain/loss and bars traded.

Rotation Investor ETF – Signals and Portfolio Read More »

Broad Breadth Model – Current Signal

Updated at the end of every week (usually Saturday mornings), this page shows charts and current signals for the Broad Breadth Model (BBM). The model uses an array of breadth indicators from various indexes for a weight of the evidence approach to assess conditions for the broader stock market (large-caps, mid-caps, small-caps). Stock market conditions are favorable when this model is bullish (positive) and unfavorable when the model is bearish (negative).

Broad Breadth Model – Current Signal Read More »

Rotation Investor ETF – Ranking Table

This page covers the ranking table for the rotation strategy trading ETFs (RO-Investor-ETF). The ranking table shows the ETF universe with a sortable prefix, which makes it easy to find specific groups (tech ETFs, commodity ETFs). Table indicators include the Momentum Rank, Trend Trio (up/down), Broad Breadth Model (bull/bear), the momentum indicator and the 5-day change in momentum. The default sort puts the strongest ETFs at the top and each ETF includes a SharpChart link.

Rotation Investor ETF – Ranking Table Read More »

Rotation Investor NDX100 – Ranking Table

This page covers the ranking table for the rotation strategy trading Nasdaq 100 stocks (RO-Investor-NDX). The ranking table includes the sector and industry for sorting to find specific groups (software, semiconductor). Table indicators include the Momentum Rank, PPO Trend (up/down), Broad Breadth Model (bull/bear), the NDX momentum indicator and the 5-day change in momentum. The default sort puts the strongest stocks at the top and each stock includes a SharpChart link.

Rotation Investor NDX100 – Ranking Table Read More »

Trend Composite Signals for S&P 500 Stocks

This page shows Trend Composite signals for stocks in the S&P 500. The Trend Composite aggregate trend signals in five trend-following indicators. Recent signals appear at the top of the table. Users can also sort by different columns and single out specific sectors using the search function. Stocks in uptrends are color coded green for quick identification. This table includes the signal date, gain/loss since the signal and a chart link.

Trend Composite Signals for S&P 500 Stocks Read More »

Rotation Investor SPX500 – Ranking Table

This page covers the ranking table for the rotation strategy trading S&P 500 stocks (RO-Investor-SPX). The ranking table includes the sector and industry for sorting to find specific groups (housing, semiconductor). Table indicators include the Momentum Rank, Trend Filter (strong/not), Broad Breadth Model (bull/bear), the SPX momentum indicator and the 5-day change in momentum. The default sort puts the strongest stocks at the top and each stock includes a SharpChart link.

Rotation Investor SPX500 – Ranking Table Read More »

Trend Signals & StochClose Rank for ETFs

Using a 270 ETF universe, this page covers Trend Composite signals for trend and StochClose values for ranking. Users can identify new trend signals, track existing signals and see the percentage change. Sortable columns make it easy to filter for uptrends and then sort by StochClose to rank trend strength. The table includes links to a StockCharts chart with corresponding indicators.

Trend Signals & StochClose Rank for ETFs Read More »

Scroll to Top