
")
What will Make or Break this V Reversal?
- Arthur Hill, CMT

Stocks plunged into early April and surged into early May, suggesting that a “V” reversal is in the making. There are two parts to the V reversal. First, there is the V, which is the plunge and the rebound. Second, there is the breakout move that completes the reversal. SPY fulfilled the V part, but has yet to actually reverse the long-term downtrend.
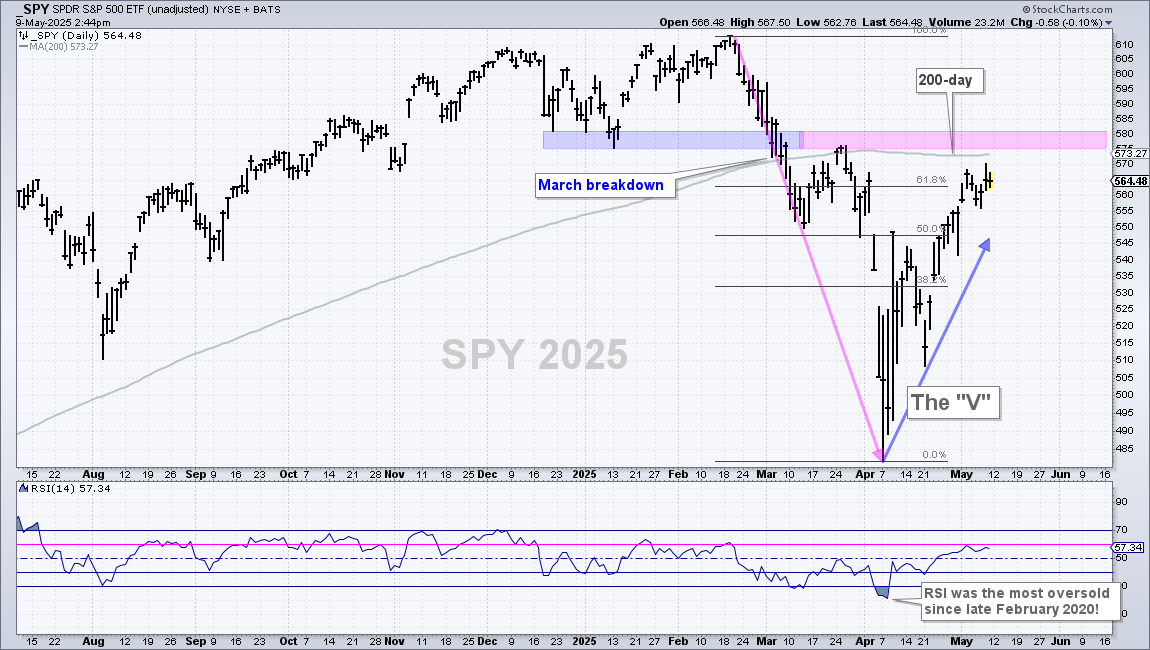
The chart below shows SPY falling 20% from late February to early April and then surging some 14% into early May. This move created the V as SPY nears the 200-day SMA and the March support break. The blue-pink shading marks broken support turned resistance in the 575-580 area. We also have the 200-day SMA marking resistance here. Thus, SPY is clearly at a moment of truth. A push through 580 would break the 200-day SMA and negate the March breakdown. This would be bullish price action.
There is more to a V reversal than price action. TrendInvestorPro went back and studied four V reversals over the last 11 years. They all feature capitulation and a sharp V-shaped recovery. However, it is upside participation that holds the key to moving from bear market to bull market. We need to see a significant increase in upside participation and key breadth indicators cross specific thresholds. These indicators include the percentage of stocks above their 200 and 150 day SMAs, and High-Low Percent.
Recent Reports and Videos for Premium Members
- Testing the Zweig Breadth Thrust with an Exit Strategy
- Oil and Agriculture Lead as Uranium Sets Up
- Breadth Deteriorates, but Short of Bear Market Signal
- Safety is Relative (Healthcare, Utilities, Infrastructure)
- Trend Trio150 Signals for Dow 30 Stocks and SPDRs
- Click here to take a trial and gain full access.