
The Breakout Parade within Tech – Cloud, Cybersecurity and Software – What’s Next?
- Arthur Hill, CMT
Welcome to the Chart Fix!
Technology is the leading sector with the largest gains since April and new highs throughout May. Within the sector, Semiconductors (SMH, SOXX) and AI (ARTY, AIQ) are leading the way. These two groups are not alone because the Cybersecurity ETF (CIBR) surged to a new high and the Cloud ETF (SKYY) extended on its breakout. The Software ETF (IGV) is the newest member to the breakout club and the ARK Fintech Innovation ETF (ARKF) is coming alive.
- Cloud Computing ETF Extends on Breakout
- Cybersecurity ETF Leads with Surge to New Highs
- Software Plays Catch up with Sprint to Falling 200-day
- Fintech Keeps Double Bottom Alive with Wedge Breakout
Recent Reports and Videos at TrendInvestorPro
- Rate and Energy Shock Weigh – Gold Headwinds and Set Up
- Semiconductor Equipment and Testing Stocks Set Up
- Early August Breakouts back in Play for Tech, AI and Semis
- ETF Master ChartList ~300 ETFs Organized in Top-Down Manner
- Click here to take a trial and gain full access.
Cloud Computing ETF Extends on Breakout
The first chart shows the Cloud Computing ETF (SKYY) with a large falling wedge defining the downtrend from November to March and a resistance breakout in April. SKYY stalled around the breakout zone for a week and then zoomed higher in May. Once in an established uptrend, chartists can look for short-term bullish continuation pattern and/or oversold conditions. TrendInvestorPro noted the pennant breakout in our report on May 26th.
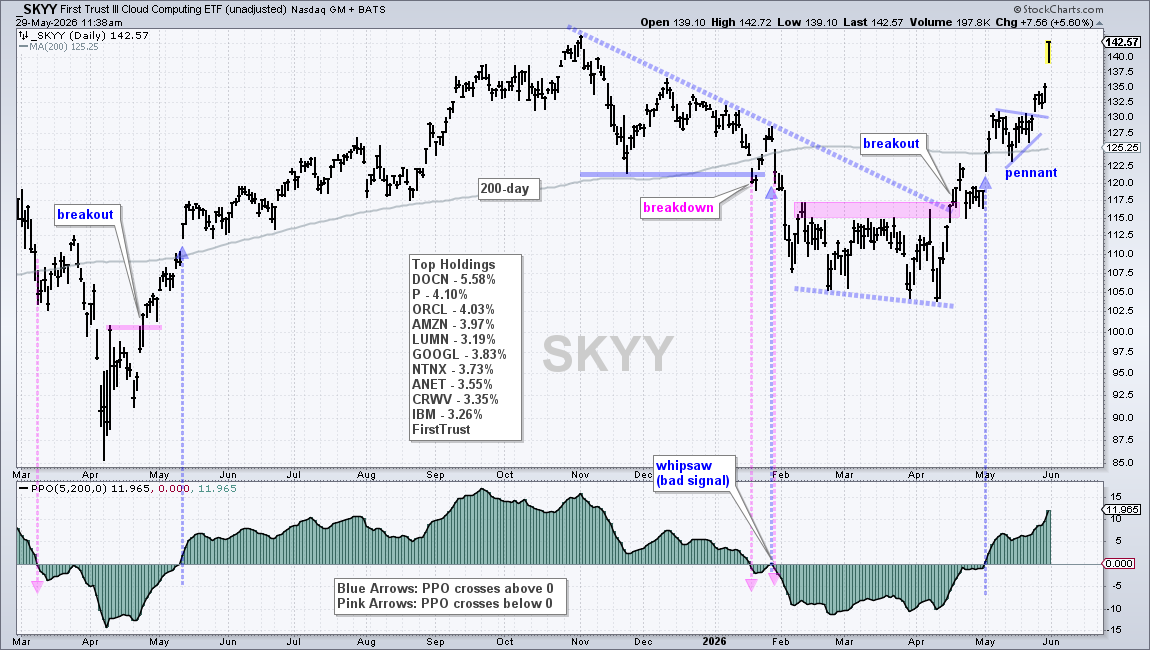
The indicator window shows the PPO(5,200,0), which measures the percentage difference between the 5 and 200 day EMAs. A move above 0 signals a bullish EMA cross (blue arrows), while a move below 0 signals a bearish EMA cross (pink arrows). As with all long-term trend-following indicators, it can be susceptible to lag and whipsaws. Price action is moving so fast that trend signals are lagging behind the price breakouts.
Cybersecurity ETF Leads with Surge to New Highs
The next chart shows the Cybersecurity ETF (CIBR) with a Double Bottom from late February to early April and resistance breakout in mid April. This breakout confirmed the Double Bottom and reversed the downtrend. CIBR stalled around the breakout zone for a week and then zoomed higher.
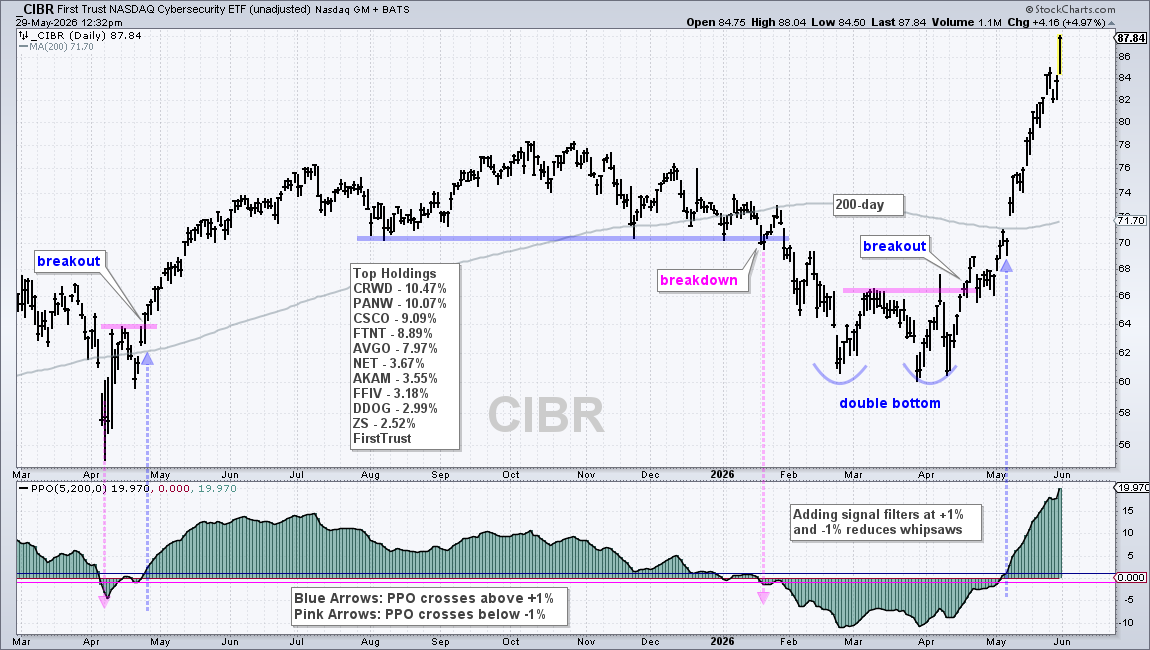
The indicator window again shows the PPO(5,200,0), but this time with signal lines at +1% and -1%. Adding signal filters can reduce, but not eliminate, whipsaws (bad signals). The PPO signals in late April 2025 and mid January 2026 corresponded with the price breakout and breakdown. The PPO signal in early May lagged the price breakout.
SKYY and CIBR were covered in our report/video on May 8th.
Software Plays Catch up with Sprint to Falling 200-day
The next chart shows the Software ETF (IGV) breaking support and hitting a 52-week low in early April. And then surging above the March high. The failed support break was a bear trap and the resistance break in early May reversed the downtrend. Even though IGV is just now back to its falling 200-day, basic price chart analysis points to an uptrend since the resistance breakout. IGV and Microsoft were featured in our report/video on May 19th.
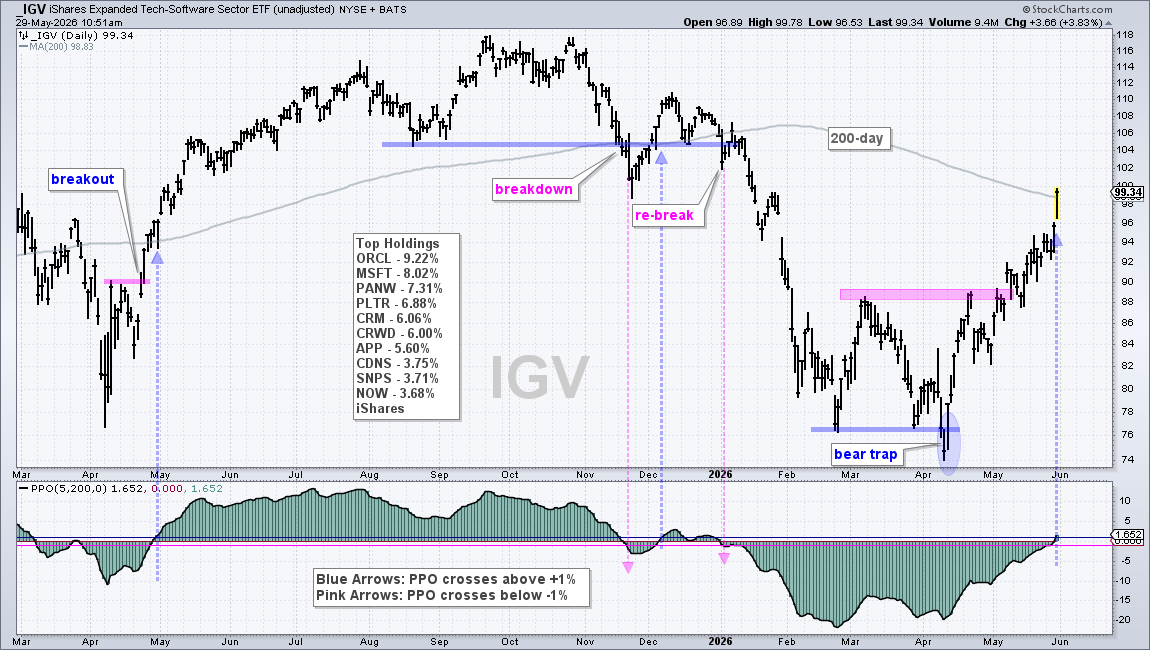
The indicator window shows the PPO(5,200,0) with signal lines at +1% and -1%. There was a whipsaw (bad signal) in early December as the PPO moved below -1% in early January. The subsequent decline was so deep that the 5-day EMA was more than 20% below the 200-day EMA in February and April. With a strong move since early April, the PPO finally poised to move above 1% and trigger a bullish trend signal.
Fintech Keeps Double Bottom Alive with Wedge Breakout
The ARK Fintech Innovation ETF (ARKF) could be next in line for the breakout parade. ARKF formed a double bottom from February to March and broke intermittent resistance with a surge into mid April. This move confirmed the double bottom and reversed the downtrend. The ETF then corrected in May with a falling wedge and broke the wedge line with a surge on Thursday. This signals a continuation of the April surge and keeps the double bottom breakout alive. A close below 40 would negate the breakouts.
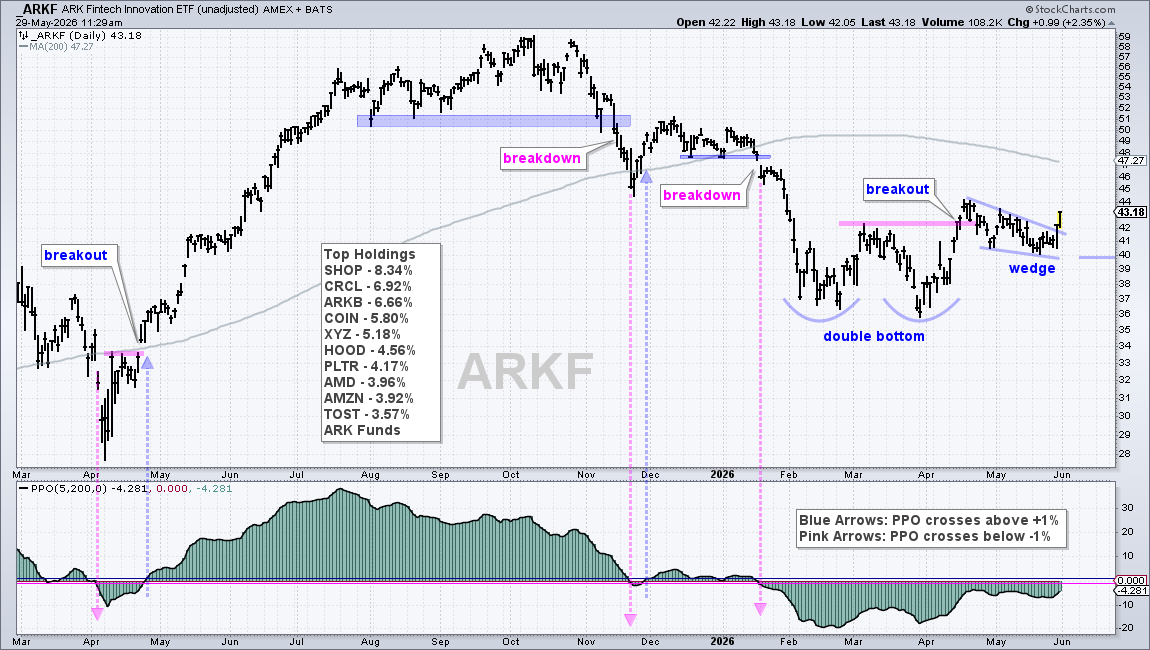
The PPO(10,200,0) remains in negative territory and has yet to reverse its bearish signal from January 20th. This could be another case of price leading and the trend-following indicator lagging.
What Now? Tech and the industry groups within tech are leading the market. Semis, AI, Cloud, Cybersecurity and Software are off to the races and clear leaders. TrendInvestorPro will monitor these charts for short-term bullish setups. Furthermore, we will be looking within these groups for individual stock setups. Microsoft was featured in our report on May 19th. Click here to learn more.
Recent Reports and Videos at TrendInvestorPro
- Rate and Energy Shock Weigh – Gold Headwinds and Set Up
- Semiconductor Equipment and Testing Stocks Set Up
- Early August Breakouts back in Play for Tech, AI and Semis
- ETF Master ChartList ~300 ETFs Organized in Top-Down Manner
- Click here to take a trial and gain full access.