Sector Momentum Favors Defense, but QQQ has yet to Break and NDX Breadth is Split
- Arthur Hill, CMT
")
Welcome to the Chart Fix!
The market profile is clearly defensive in 2026, but QQQ has yet to break and Nasdaq 100 breadth has yet to turn bearish. Today’s report will rank the equal-weight sectors to separate the leaders from the laggards and identify the long-term trends. We then turn to the QQQ, which remains in a long-term uptrend despite a split beneath the surface.
- EW Sector Momentum Favors Defense
- QQQ is Stalling as Nasdaq 100 Breadth Turns Mixed
Recent Reports and Videos for Premium Members
- Testing the Zweig Breadth Thrust with an Exit Strategy
- Oil and Agriculture Lead as Uranium Sets Up
- Breadth Deteriorates, but Short of Bear Market Signal
- Safety is Relative (Healthcare, Utilities, Infrastructure)
- Trend Trio150 Signals for Dow 30 Stocks and SPDRs
- Click here to take a trial and gain full access.
EW Sector Momentum Favors Defense
The table below shows year-to-date performance for the 11 equal-weight sectors and the S&P 500 EW ETF (RSP), which is the benchmark. Note that equal-weight sectors are more representative of the entire sector because they are not weighted by market cap. This table is sorted by the percentage above the 200-day SMA (SMA(200) column). The EW Energy ETF (RSPG) shows the strongest upside momentum because it is 25% above its 200-day. The EW Finance ETF (RSPF) is the weakest and below its 200-day with a value of -.86%.
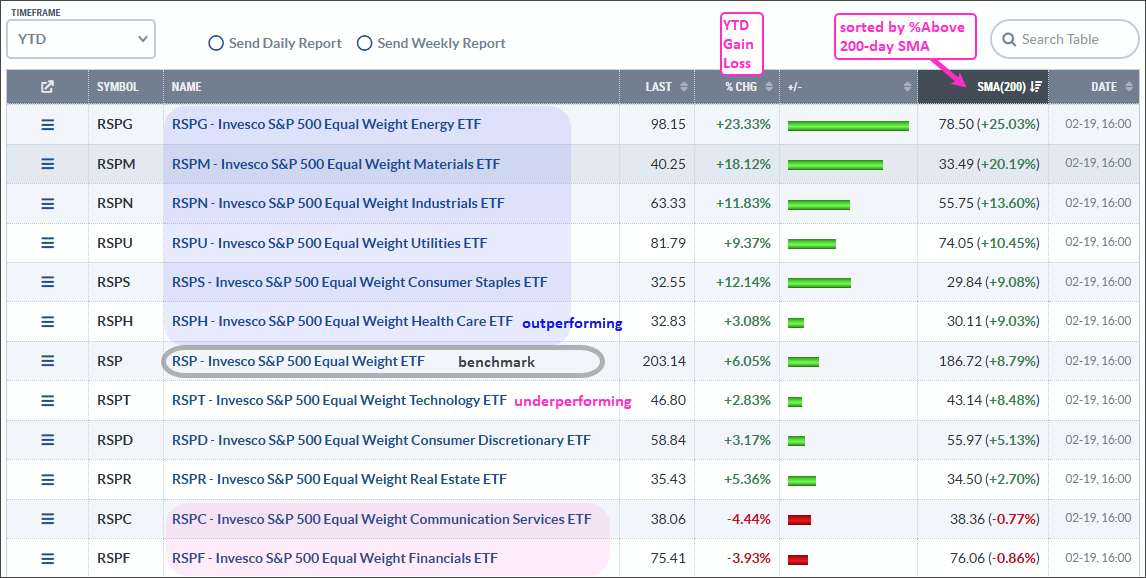
The blue shading shows the leaders (blue shading), which show more upside momentum than RSP (gray outline). Here we have energy, materials, industrials, utilities, consumer staples and healthcare. Except for industrials, this momentum ranking shows a defensive market. Energy and materials are typically late cycle leaders, while utilities, staples and healthcare are defensive sectors.
In the bottom half, we find technology, consumer discretionary, real estate, communication services and financials. With the exception of real estate, these are offensive sectors that should lead during a bull market. Even though they are lagging, they are above their 200-day SMAs and still in long-term uptrends. Broad market trouble starts when these start breaking their 200-day SMAs.
QQQ is Stalling, but Not Broken
Even though market profile is defensive and the Nasdaq 100 Equal-Weight ETF (QQEW) broke down two weeks ago, QQQ has yet to break down and long-term breadth has yet to turn bearish. Here’s a simple long-term strategy to identify significant reversals in QQQ.
- A bullish signal triggers when QQQ crosses above its 200-day SMA and Nasdaq 100 Percent above 200-day SMA crosses above 60%.
- A bearish signal triggers when QQQ crosses below its 200-day SMA and Nasdaq 100 %Above 200-day crosses below 40%.
The chart below shows QQQ in the top window, NDX %Above 200-day SMA ($NDXA200R) in the indicator window and these signals in blue/pink.
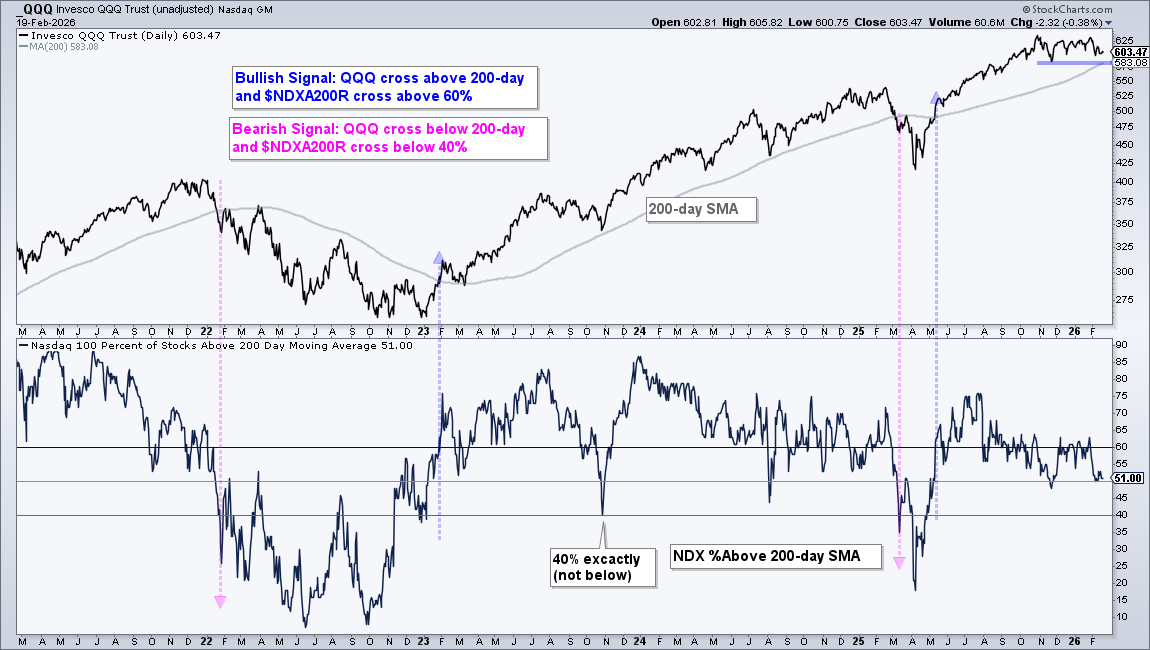
Note that these are long-term signals, which is why there are only four signals over the last five years. In the first half, a bearish signal foreshadowed the 2022 bear market, and a bullish signal marked the beginning of the bull run in 2023-2024. There was a bearish signal on March 13th, just before the tariff meltdown. A bullish signal followed on May 12th, which remains the active signal.
On the price chart, QQQ is currently consolidating above the rising 200-day SMA. A close below 583 would break this key moving average. NDX %Above 200-day SMA is at 51%, which means roughly half of the component stocks are in uptrends and half in downtrends. A split market, but not a bear market.
Note that I am using 60% and 40% for my bullish and bearish signals, respectively. While the 50% level seems logical, using this level results in more whipsaws (bad signals). We can reduce whipsaws by widening the signal thresholds on indicators. The vast majority of NDX stocks are in uptrends when this indicator is above 60% and the vast majority are in downtrends when this indicator is below 40%.
Recent Reports and Videos for Premium Members
- Testing the Zweig Breadth Thrust with an Exit Strategy
- Oil and Agriculture Lead as Uranium Sets Up
- Breadth Deteriorates, but Short of Bear Market Signal
- Safety is Relative (Healthcare, Utilities, Infrastructure)
- Trend Trio150 Signals for Dow 30 Stocks and SPDRs
- Click here to take a trial and gain full access.