Finance SPDR Takes a Hit, but Maintains Uptrend as Trading Setup Emerges
- Arthur Hill, CMT
")
Welcome to the Chart Fix!
The Finance SPDR was hit hard the last few weeks, but remains in an uptrend overall. In fact, the ETF is oversold within this uptrend and oversold conditions present traders with opportunities to trade in the direction of the bigger trend. There are three steps in this process. First, determine the long-term trend. Second, identify oversold conditions. Third, set key levels to signal a breakout. Today’s report will cover the setup in XLF.
- Ensure a Long-term Uptrend
- Using Bollinger Bands to Identify Oversold Conditions
- Look for a Short-term Upside Catalyst
Recent Reports and Videos for Premium Members
- Trend Trio150 Signals for Dow 30 Stocks and SPDRs
- DB Agriculture ETF Leads as Copper Sends a Message
- A Defense Stock with a Bullish Setup
- Tech ETFs Hold Up, but have yet to Reverse Downswings
- Click here to take a trial and gain full access.
Ensure a Long-term Uptrend
The first chart shows the Finance SPDR (XLF) with candlesticks, the 200-day SMA (gray line) and the PPO(5,200,0). XLF is in a long-term uptrend with a new high in early January and price above the rising 200-day SMA.
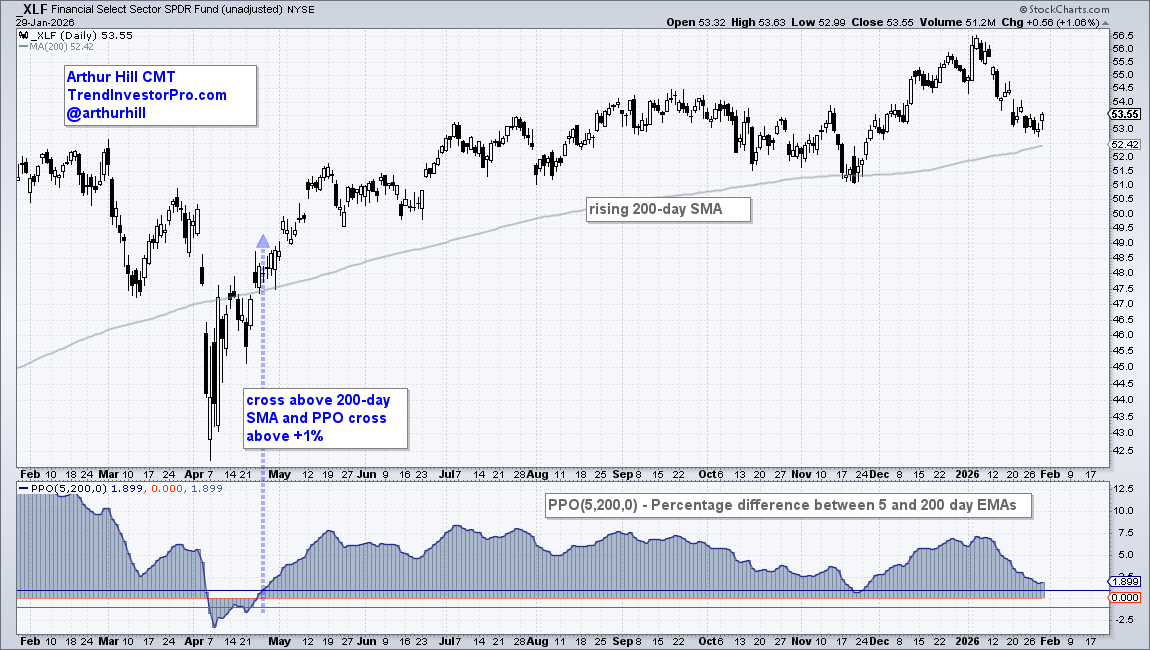
The bottom window shows the PPO(5,200,0), which is the percentage difference between the 5 and 200 day EMAs. I added signal lines at +1% and -1% to reduce whipsaws. A cross above +1% signals an uptrend, while a cross below -1% triggers a downtrend. This indicator signals uptrend right now.
Identify Oversold Conditions
With an uptrend underway, it is time to wait for oversold conditions and/or tradable patterns. The next chart shows XLF with Bollinger Bands (20,2) on the price chart and %B (20,2) in the indicator window. %B measures the distance of the close relative to the upper and lower Bollinger Bands. A value below zero occurs when the close is below the lower Bollinger Band, which signals a short-term oversold condition. This means the close is more than 2 standard deviations below the 20-day SMA, which is the middle line on the Bollinger Bands.
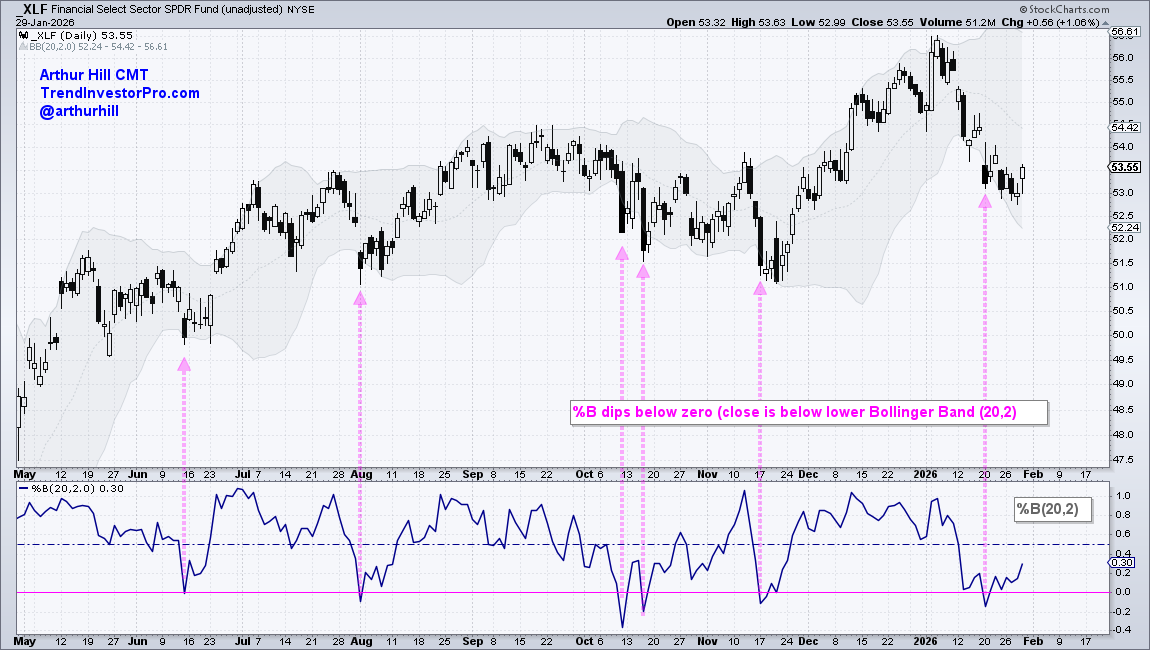
The pink arrows show oversold conditions since May. XLF bounced after oversold conditions in mid June, late July and mid November. The ETF did not bounce much in October as it continued lower into mid November. Not every oversold condition leads to a bounce. TrendInvestorPro specializes in finding short-term oversold conditions within uptrends for stocks and ETFs.
Look for a Short-term Reversal
There is a big challenge with oversold conditions. Namely, ETFs and stocks can become oversold and remain oversold (continue falling). We need a method to determine that the short-term decline is reversing and the long-term uptrend is resuming. Traders can use candlestick patterns, a short-term PPO or price action.
The chart below shows tradable patterns forming in June and early November (triangles). XLF broke out in late June and moved to new highs in July. The ETF also broke out in early November, but this breakout did not hold as price fell below the October low. Setups sometimes fail. Be prepared.
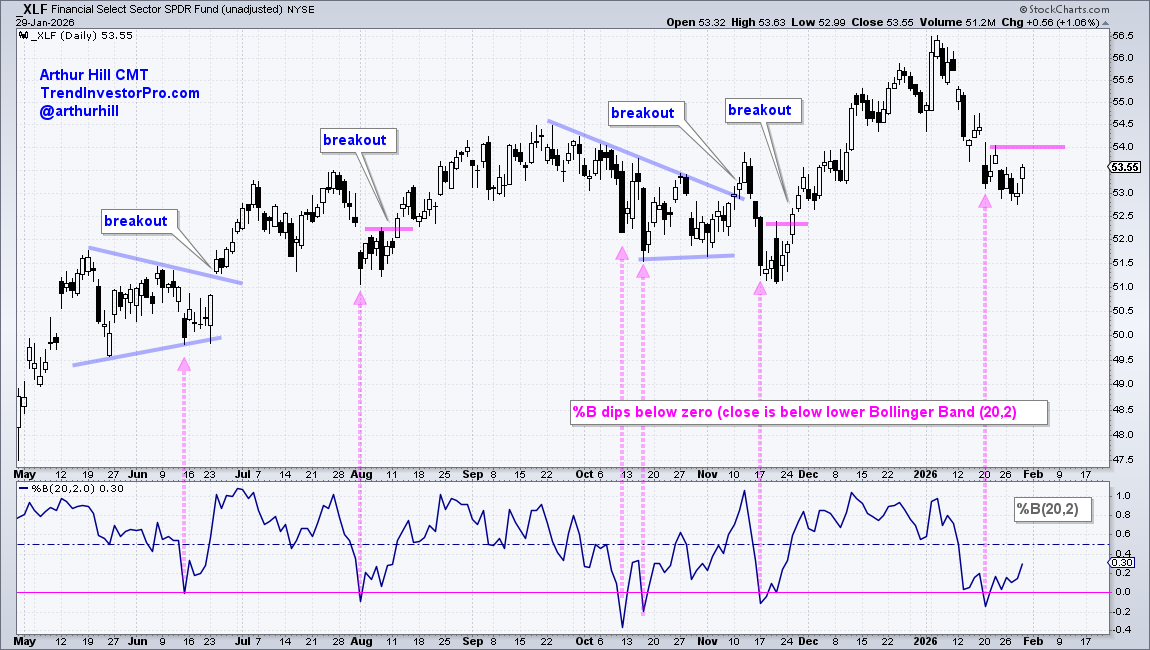
Even though XLF did not form clear patterns in August and mid November, the ETF became oversold and established short-term resistance levels to monitor for breakouts. XLF broke out each time and moved to new highs shortly thereafter.
This brings us to the current situation. XLF is oversold within an uptrend and the ETF established a short-term resistance level at 54. A breakout here would reverse the short-term slide and argue for a move higher.
Keep in mind that not all setups work. This is why we must plan our trade ahead of time and then trade according to that plan.
Looking for indicators with an edge? Check out the TIP Indicator-Edge Plugin for StockCharts ACP. Click here to learn more.
Recent Reports and Videos for Premium Members
- Trend Trio150 Signals for Dow 30 Stocks and SPDRs
- DB Agriculture ETF Leads as Copper Sends a Message
- A Defense Stock with a Bullish Setup
- Tech ETFs Hold Up, but have yet to Reverse Downswings
- Click here to take a trial and gain full access.