The stock market moved from offense to defense over the last few weeks. Speculative tech names led the market into October, but defensive names took over in November. Healthcare, consumer staples and gold are holding strong, while the ARK Innovation ETF breaks support and Microsoft triggers a bearish Trend Composite signal. In contrast, an old school utility is perking up with a bullish Trend Composite signal.
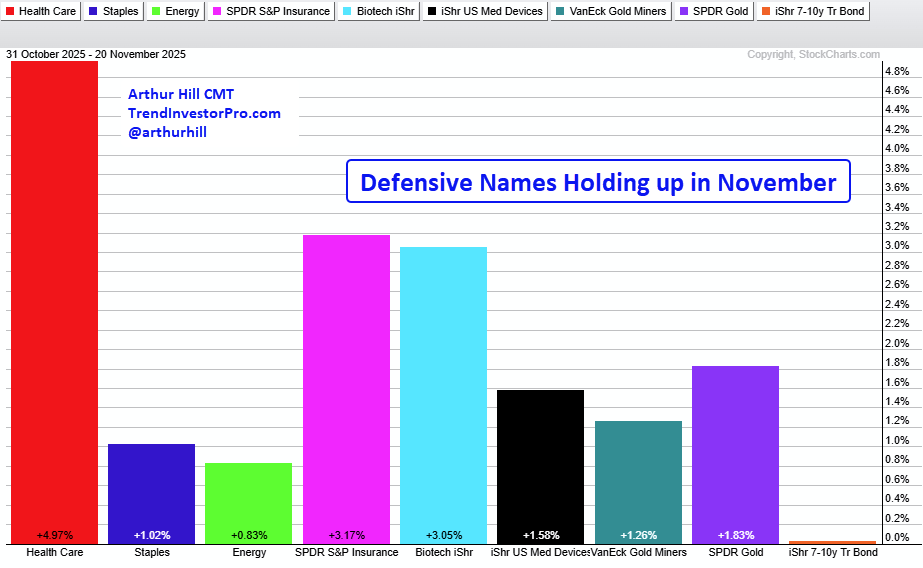
Defensive Groups Lead Month-to-Date
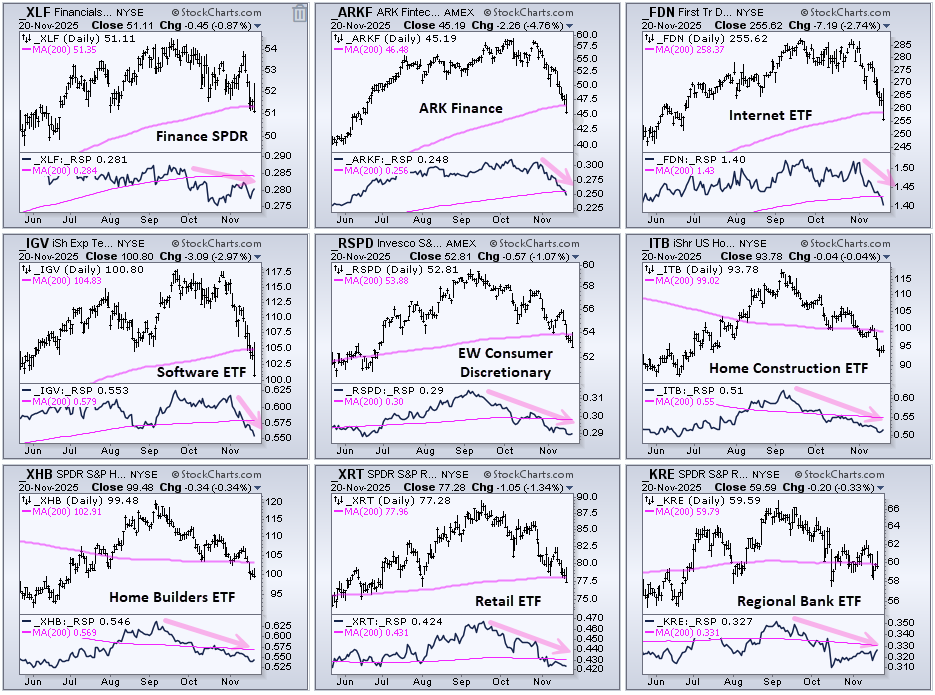
Economically Sensitive Groups in Downtrends
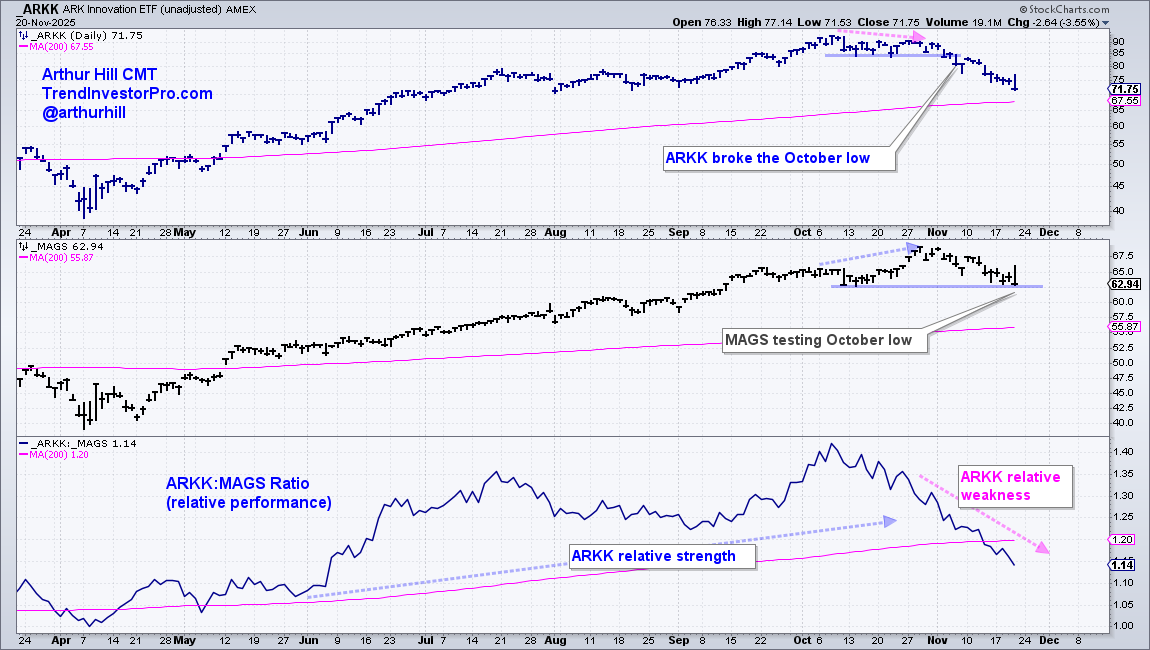
Throwing Out the Speculative Names
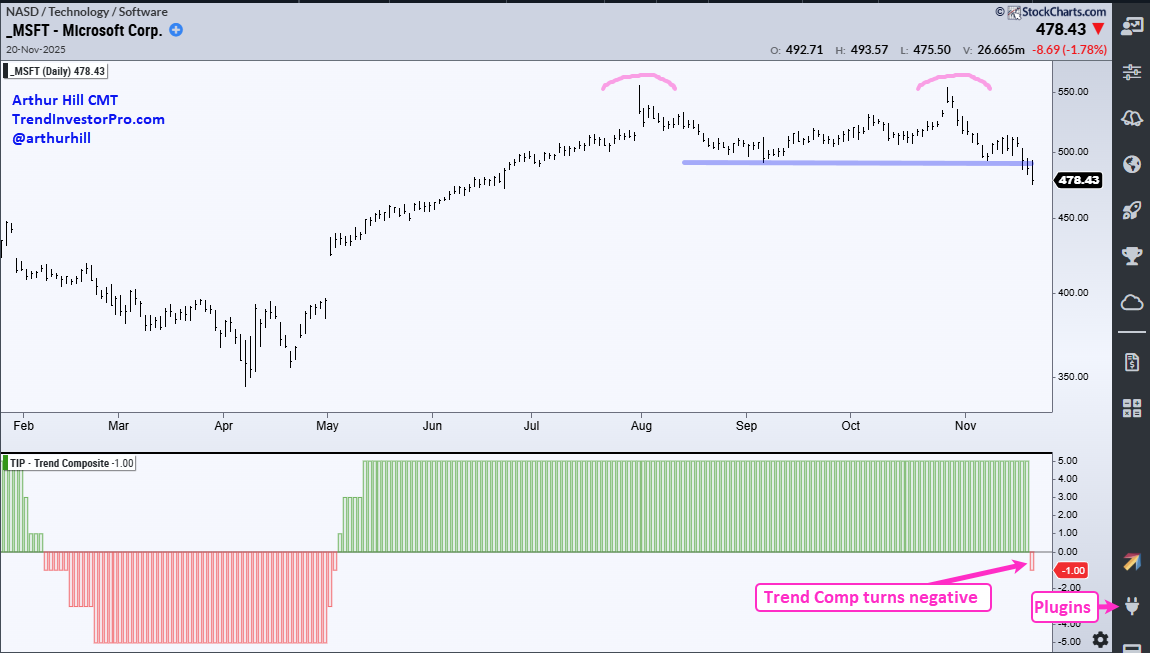
Microsoft Breaks from the MAG7
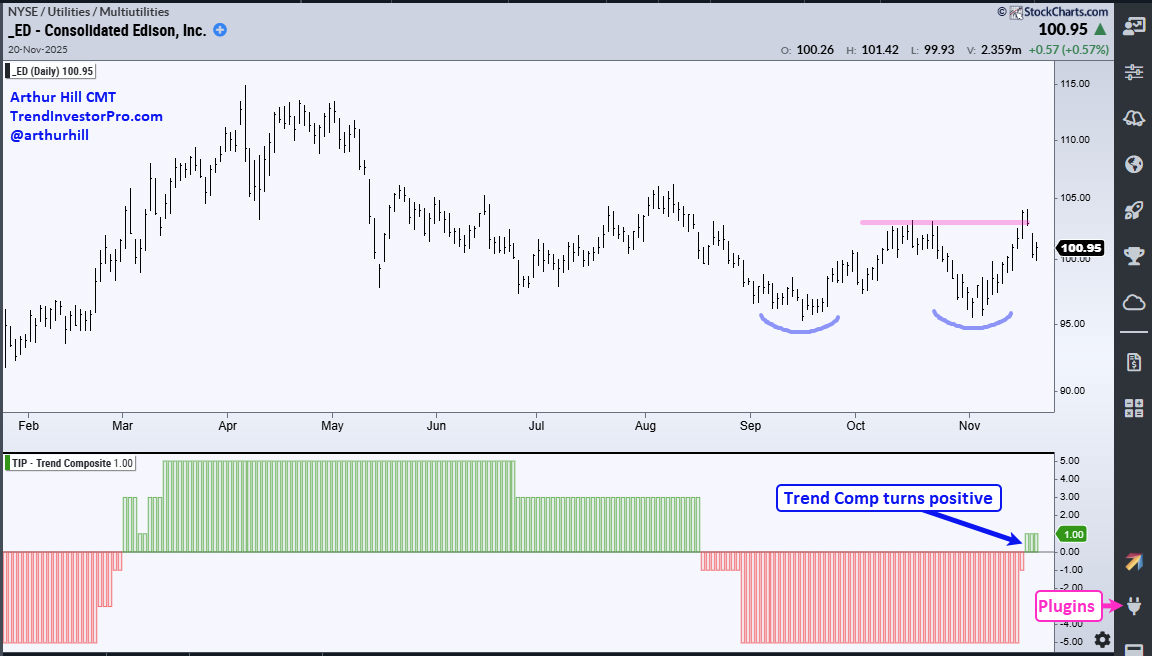
Old School Utility Triggers Bullish Trend Signal
The next Chart Fix will be on Friday, November 28th. I wish you all a happy Thanksgiving week! Here’s to family, friends, food and, of course, college football.
November is still a work in progress, but month-to-date performance shows a clear preference for defense. The PerfChart below shows nine names with month-to-date gains. Note that almost all equity ETFs are down month-to-date with SPY losing 4.33% and QQQ off 6.9%. As money moved out of tech, it found its way into ETF related to healthcare, consumer staples, energy, insurance, biotech and medical devices. Outside of equities, gold and bond ETFs also moved higher in November. The PerfChart below shows nine ETFs with month-to-date gains.
Economically Sensitive Groups in Long-term Downtrends
Some tech ETFs and most economically sensitive groups are in long-term downtrends as they broke below their 200-day SMAs (pink lines). I noted cracks within the technology sector last week. This week the ARK Fintech Innovation ETF (ARKF), Internet ETF (FDN) and Software ETF (IGV) moved below their 200-day SMAs. Note that software accounts for a third of the tech sector.
Elsewhere, economically sensitive groups are seriously lagging. The EW Consumer Discretionary ETF (RSPD), Retail SPDR (XRT) and Homebuilders ETF (XHB) broke their 200-day SMAs this week. This bodes ill for the economic outlook, and the broader market. Also notice that the Finance SPDR (XLF) and Regional Bank ETF (KRE) broke their 200-day SMAs this week. The indicator windows show the relative performance lines and all are below their 200-day SMA (relative weakness).
The ARK Innovation ETF (ARKK), which represents the most speculative end of the market, led the market lower this month and is seriously underperforming the Mag7 ETF (MAGS). This shows risk aversion in the most speculative stocks. In the top window, ARKK peaked in early October, formed a lower high and broke the October lows on November 4th, the same day the Bitcoin ETF (IBIT) broke its 200-day SMA.
The middle window shows MAGS with a higher high from early to late October and price still above its October low (barely). MAGS is the only tech-related ETF in our Core ETF ChartList that has yet to close below its October 10th low, which means it is holding up the best. The bottom window shows the ARKK:MAGS ratio falling sharply from early October to mid November and breaking its 200-day SMA.
Microsoft Breaks from the MAG7
The next two charts feature the Trend Composite, an indicator that aggregates signals in five trend-following indicators. This indicator is one of eleven in the TrendInvestorPro indicator edge plugin for StockCharts ACP. You can learn more about it here.
Speaking of the MAG7, Microsoft is breaking ranks as its Trend Composite turned negative for the first time since April. MSFT joins META, which triggered a downtrend signal on October 31st. The other five remain with positive Trend Composites (NVDA, GOOGL, AAPL, AMZN, TSLA). As with the tech sector, we are starting to see cracks within the MAG7 and these stocks account for around 49% of QQQ and around 35% of SPY.
Looking for indicators with an edge? Check out the TIP Indicator-Edge Plugin for StockCharts ACP. Click here to learn more.
Consolidated Edison Triggers Bullish Trend Signal
This week there are over 20 new Trend Composite signals in the S&P 500 (as of Thursday). And all but one were down. These signals are updated every Saturday at TrendInvestorPro and this page is available to all. The lone uptrend signal came from Consolidated Edison (ED), an old school utility based in New York City. I don’t think there are any data centers planned for NYC. ED underperformed the market from April to October as the broader market moved higher.
")