Cracks within Tech – Bonds Outperform Bitcoin – Insurance Names Catch Strong Bid
- Arthur Hill, CMT
")
Welcome to the Friday Chart Fix!
The market shows more signs of risk aversion with breakdowns in technology-related ETFs, strength in insurance and bonds, and a downtrend signal in Bitcoin. The Semiconductor ETF is holding up, but the Software ETF and ARK Innovation ETF are breaking down. Money is rotating from these areas to insurance stocks, which produced several bullish Trend Composite signals this week. Traders are also selling Bitcoin as it reversed a one year uptrend and started underperforming the Treasury bond ETF.
- Cracks within Technology (ARKK, IGV)
- Trend Consensus with the Trend Composite (NVDA)
- Uptrend Signals in Insurance Names
- Bitcoin ETF Triggers Downtrend Signal
- Bonds Outperforming Bitcoin (IEF, IBIT)
Recent Reports and Videos for Premium Members
- Trend Trio150 Signals for Dow 30 Stocks and SPDRs
- Agriculture, Wheat, Corn and Sugar ETFs Break Out
- Breadth Deteriorates, Spreads Widen and Rate Rise
- Downtrend Signals in XLK and XLC – A Breakout in Space
- Click here to take a trial and gain full access.
Cracks within Technology (ARKK, IGV)
Cracks are appearing in the tech sector as the ARK Innovation ETF (ARKK) and Software ETF (IGV) break their lows from October 10th. Stocks fell sharply on October 10th with the Technology SPDR (XLK) losing 4%. XLK then rebounded into late October with a new high on October 29th (blue arrows). The Semiconductor ETF (SMH) followed suit with a new high as well. As the chart below shows, both XLK and SMH are still above their October 10th lows (as of Thursday’s close).
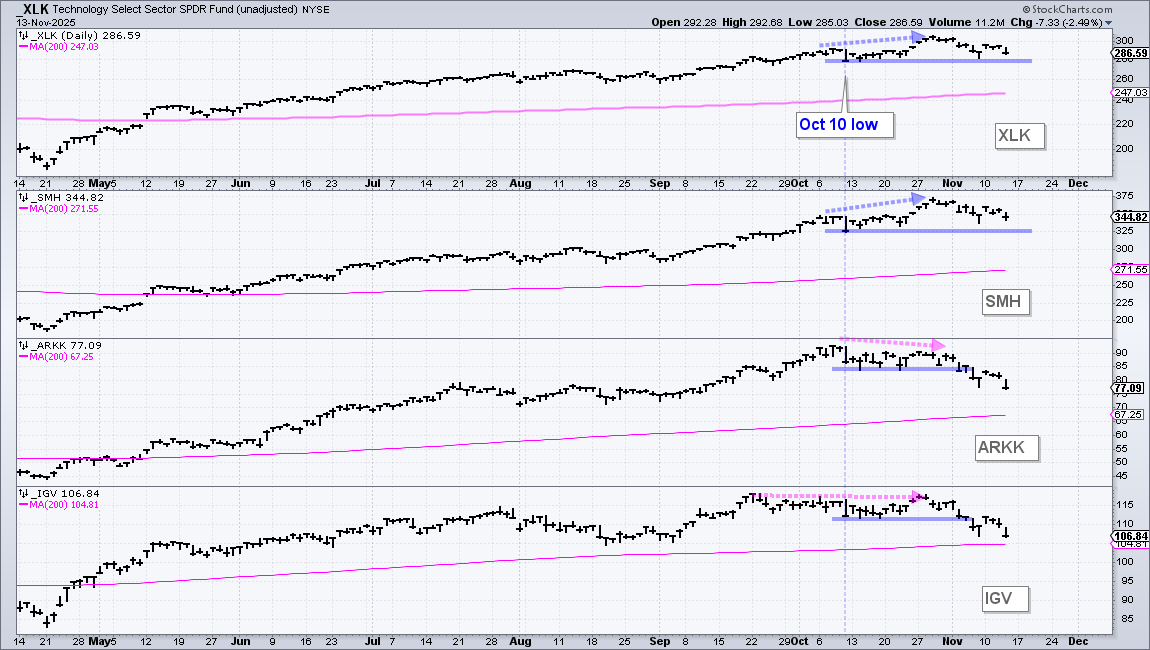
The October 10th lows mark benchmark lows chartists can use to compare performance. Names holding above these lows show relative strength, while names breaking below these lows show relative weakness (and absolute weakness). While SMH is holding up, the Software ETF (IGV) is not and leading the way lower. The bottom window shows IGV failing to record a new high in late October and breaking its October 10th low (blue line). The ARK Innovation ETF (ARKK), which represents the most speculative tech stocks, it also lagging as it broke the October 10th low.
Semiconductor stocks account for 38.35% of the Technology SPDR (XLK), which makes this the largest group in XLK. Software, however, is not far behind with a 33.4% weighting.
Looking for indicators with an edge? Check out the TIP Indicator-Edge Plugin for StockCharts ACP. Click here to learn more.
Trend Consensus with the Trend Composite (NVDA)
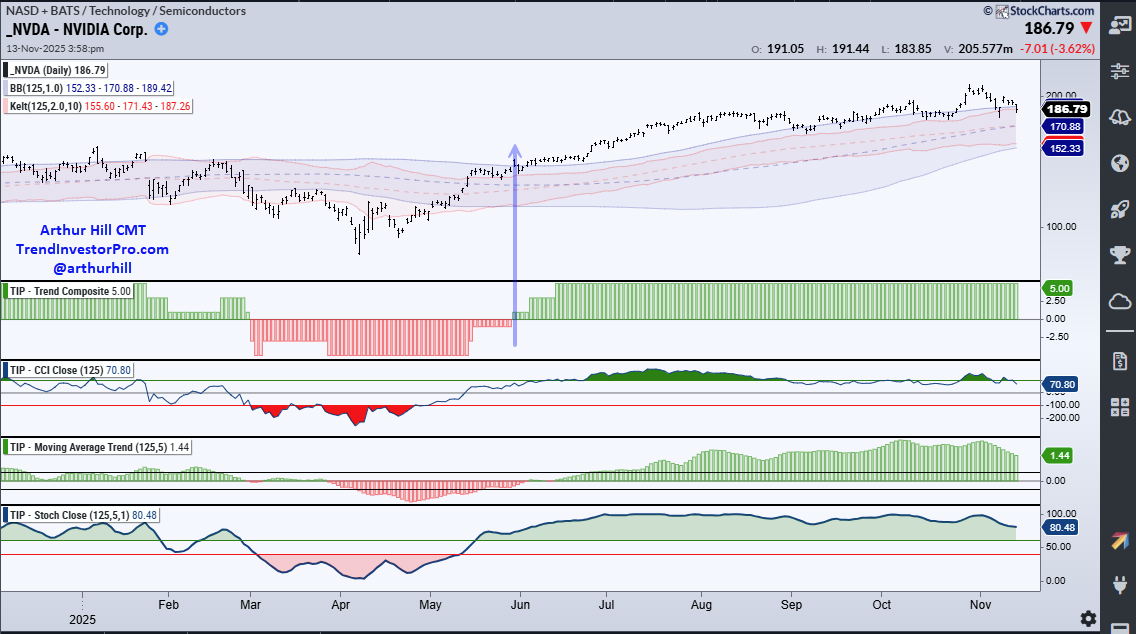
In an effort to reduce whipsaws and find consensus, I created the Trend Composite for trend-following signals. This indicator defines the consensus by aggregating signals from five trend-following indicators. These include Bollinger Bands, Keltner Channels, StochClose, Moving Average Trend and CCI-Close with 125-day timeframes. This indicator is one of eleven in the TIP Indicator Edge Plugin for StockCharts ACP.
An uptrend signals when the indicator turns positive, which means the majority of indicators signal an uptrend. A downtrend signals when the indicator turns negative. The Trend Composite ranges from +5 to -5 and is always an odd number. A reading of +3 means four indicators are bullish and one is bearish (4 – 1 = 3).
The chart below shows Nvidia (NVDA) with the Trend Composite in the first indicator window and the other indicators. Currently, all five indicators signal uptrend (Trend Composite = +5).
Uptrend Signals in Insurance Names
TrendInvestorPro tracks Trend Composite signals for S&P 500 stocks on a weekly basis (Saturday updates). One group stood out while analyzing this week’s signals: Insurance. Note that Healthcare stocks were dominant over the last six weeks with 19 uptrend signals.
Insurance stocks triggering uptrend signals this week include Allstate (ALL), Berkshire (BRK/B), Chubb (CB), Hartford (HIG), Prudential (PRU) and MetLife (MET). The S&P GICS methodology lists Berkshire as a consumer non-cyclical, which explains why it is not part of the Insurance ETF (KIE). However, in a CNBC interview last year, Warren Buffet noted that insurance is the most important business at Berkshire.
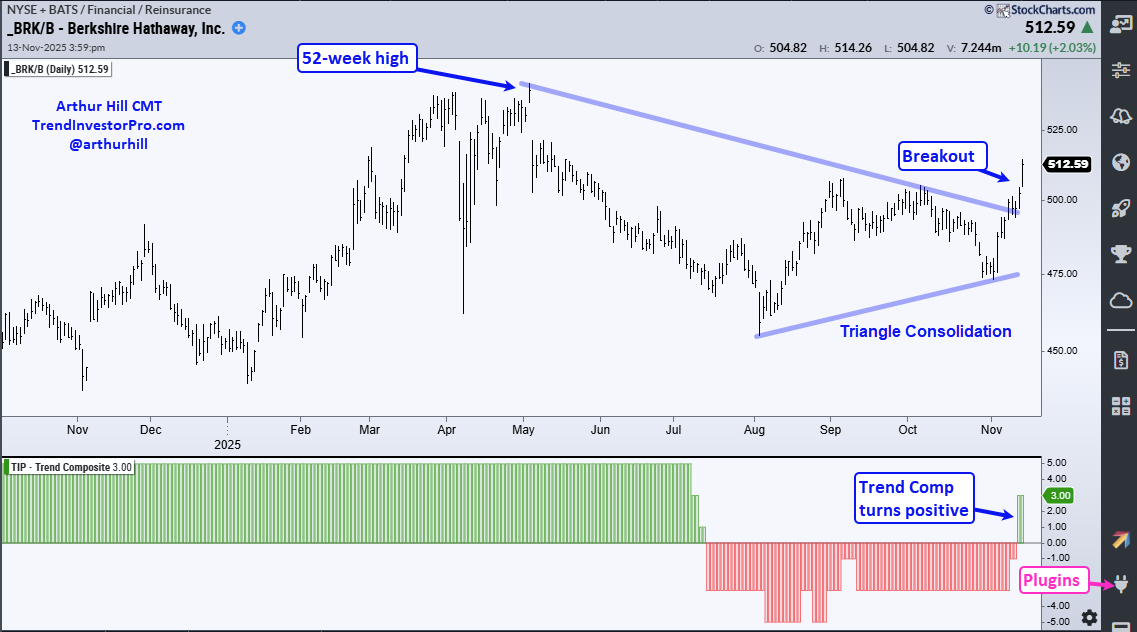
The chart above shows Berkshire with the Trend Composite turning positive this week (+3). This bullish trend signals coincides with a triangle breakout and break above the September high. Also note that the S&P 500 is down around 1.5% so far this month and Berkshire is up 7.5%.
Trend-following indicators lag, which means they will never catch a top or bottom. These indicators signal when a move is strong enough to reverse the prior trend. Not all signals work, but some lead to extended trends that more-than-pay for the poor signals. For Berkshire, the Trend Composite turned positive in mid November 2022 and stayed positive until mid July 2025, which price rising from 310 to 470.
Bitcoin ETF Triggers Downtrend Signal
The next chart shows the Bitcoin ETF (IBIT) with the Trend Composite turning negative on November 4th. This downtrend signal reverses a bullish signal from mid October 2024. IBIT gained around 45% from mid October 2024 to early November 2025.
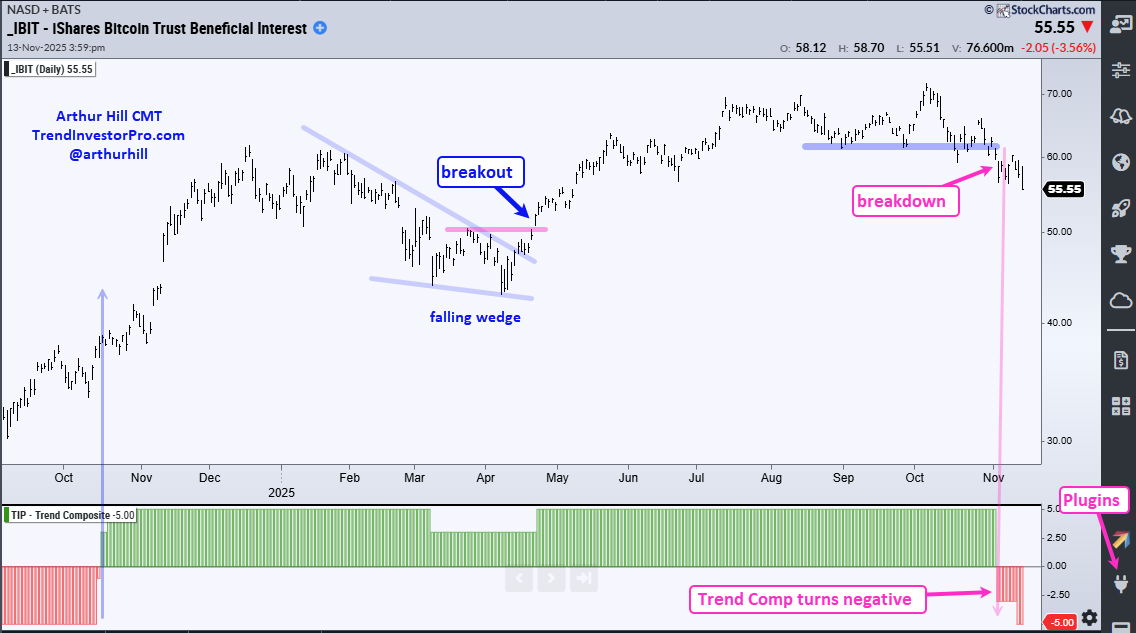
Trend Composite signals can also be used as a filter to separate uptrends from downtrends. Once an uptrend signals, chartists can put these names on a watch list and wait for tradable pullbacks and bullish setups to emerge. For example, IBIT formed a falling wedge into April and broke out with a surge in late April. This correction occurred within a long-term uptrend as the Trend Composite remained positive.
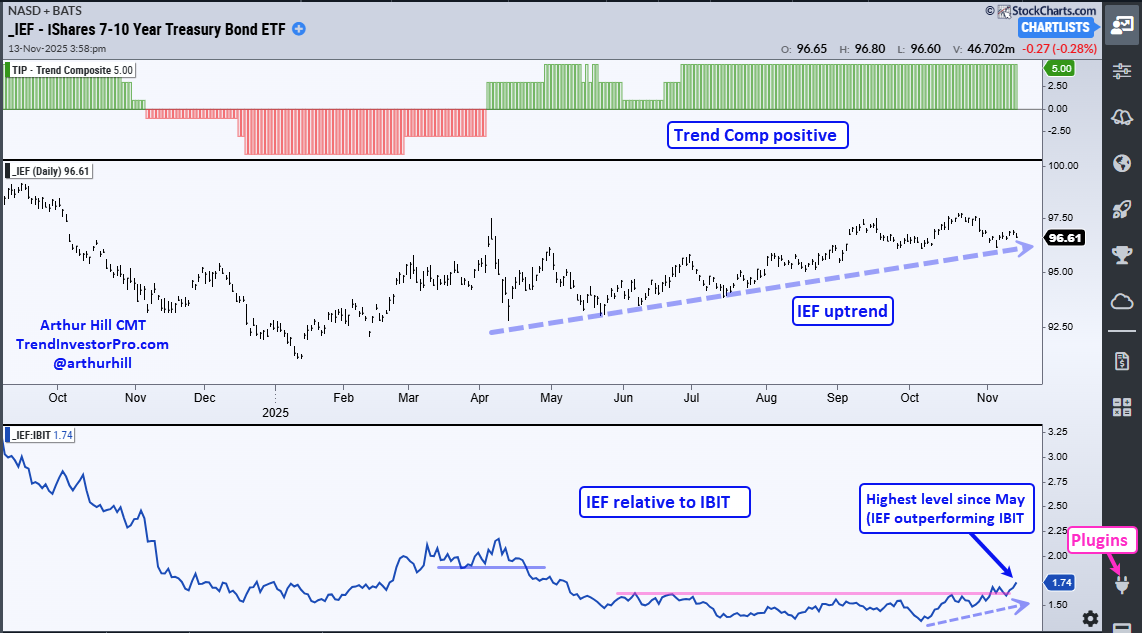
Bonds Outperforming Bitcoin (IEF, IBIT)
The 7-10Yr TBond ETF (IEF) is not the most exciting trade out there, but this bond ETF is in an uptrend and outperforming the Bitcoin ETF. The chart below shows the Trend Composite turning positive in early April and IEF trending higher the last six plus months. In the lower window, we have the price-relative (IEF/IBIT ratio), which measures relative performance. IEF underperformed IBIT from April to early October as the price-relative fell. This relative performance line turned up in October and recorded a five month high in early November. This means Treasury bonds (safe-haven assets) are outperforming Bitcoin (risk asset). Trade accordingly!
Recent Reports and Videos for Premium Members
- Trend Trio150 Signals for Dow 30 Stocks and SPDRs
- Agriculture, Wheat, Corn and Sugar ETFs Break Out
- Breadth Deteriorates, Spreads Widen and Rate Rise
- Downtrend Signals in XLK and XLC – A Breakout in Space
- Click here to take a trial and gain full access.