The market is rising, but relatively few stocks are doing the heavy lifting. Will leadership broaden and extend this bull run or will narrow leadership lead to weakness?
Today’s report will show how chartists can use new highs and new lows to quantify leadership within the S&P 500 and time directional moves. High/Low data show relatively narrow leadership during the 2025 advance. Even so, new highs are still outpacing new lows and the High-Low Line is rising. The trouble starts when the High-Low Line turns down. We are watching this closely.
Recent Reports and Videos for Premium Members
Testing the Zweig Breadth Thrust with an Exit Strategy
Oil and Agriculture Lead as Uranium Sets Up
Breadth Deteriorates, but Short of Bear Market Signal
Safety is Relative (Healthcare, Utilities, Infrastructure)
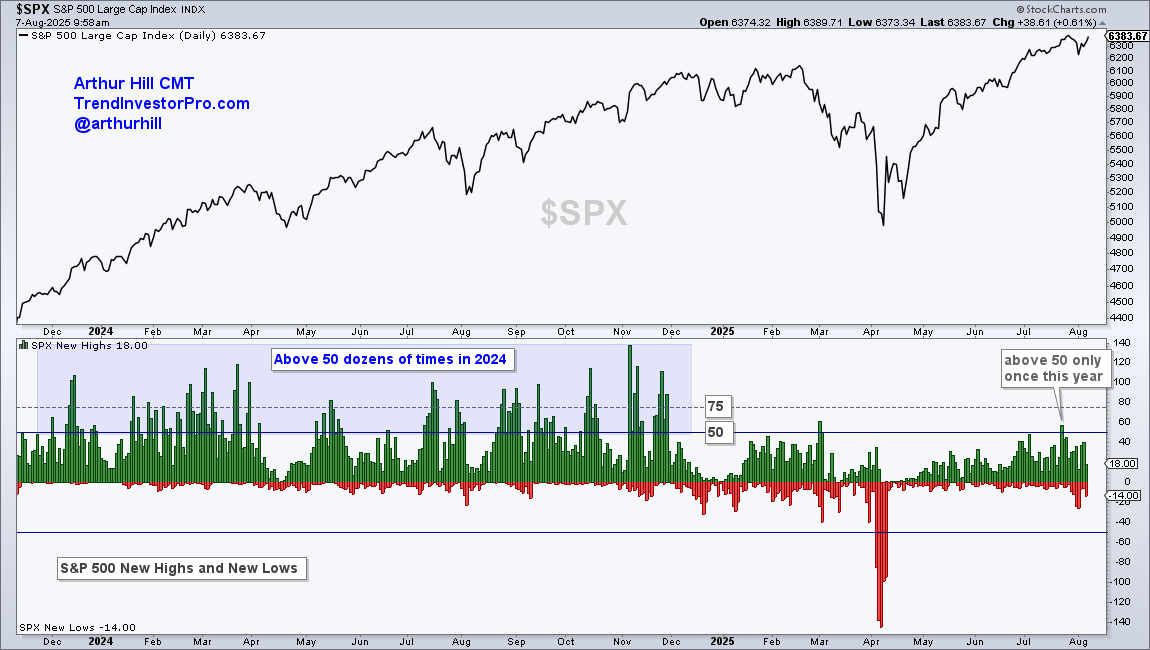
The first indicator shows S&P 500 new highs and lows as an up/down pair. New highs are positive (up) and new lows are negative (down). I have horizontal lines at +50 and -50, which represent 10% of the S&P 500. New highs exceeded 50 just one time this year (July 23rd). The inability to exceed 50 on a regular basis shows narrow leadership within the S&P 500.
In contrast with 2025, the 2024 bull market showed broad leadership because new highs regularly exceeded 50. In fact, new highs exceeded 75 several times and 100 on a few occasions. It is much easier to trade during bull markets with broad leadership. Look for new highs to exceed 60 for signs of expanding leadership.
New Highs Still Outpacing New Lows
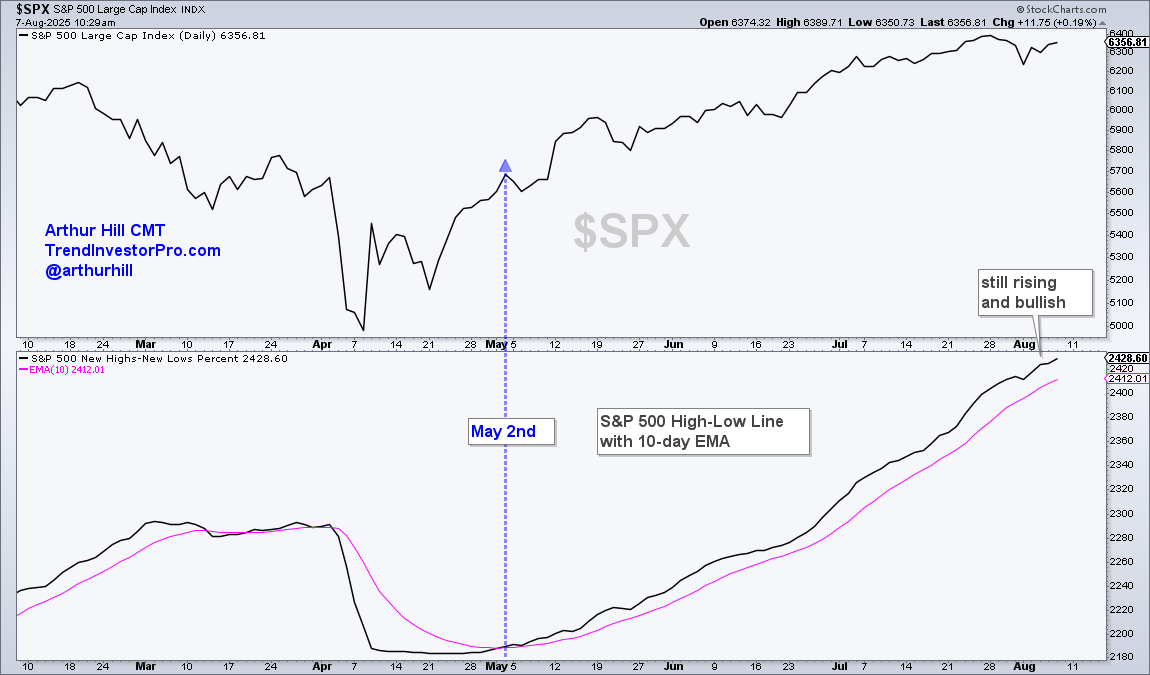
Despite narrow leadership, the cup is half full for the indicator and the S&P 500. The next chart shows the High-Low Line, which is a cumulative measure of daily net new highs (new highs less new lows). This line rises as long as new highs outpace new lows. It turned up on May 2nd with a cross above its 10-day EMA (pink line), and remains in an uptrend. The bulls have the edge until the High-Low Line turns down and breaks its 10-day EMA, which would mean new lows are outpacing new highs.
Recent Reports and Videos for Premium Members
Testing the Zweig Breadth Thrust with an Exit Strategy
Oil and Agriculture Lead as Uranium Sets Up
Breadth Deteriorates, but Short of Bear Market Signal
Safety is Relative (Healthcare, Utilities, Infrastructure)
")