Today’s video will start with a 16+ year backtest of a slightly modified version of the Index Breadth Model. These results will be compared to buy-and-hold and a 5/200 cross for the S&P 500 SPDR. I will then review the current signals in the StockCharts breadth indicators. The upswing since late March dominates right now so I will show some short-term breadth measures to watch going forward, as well as key supports for SPY, QQQ and two others. The video will then review the core ETFs in the ChartList and finish with the yield spreads, which continue to narrow.
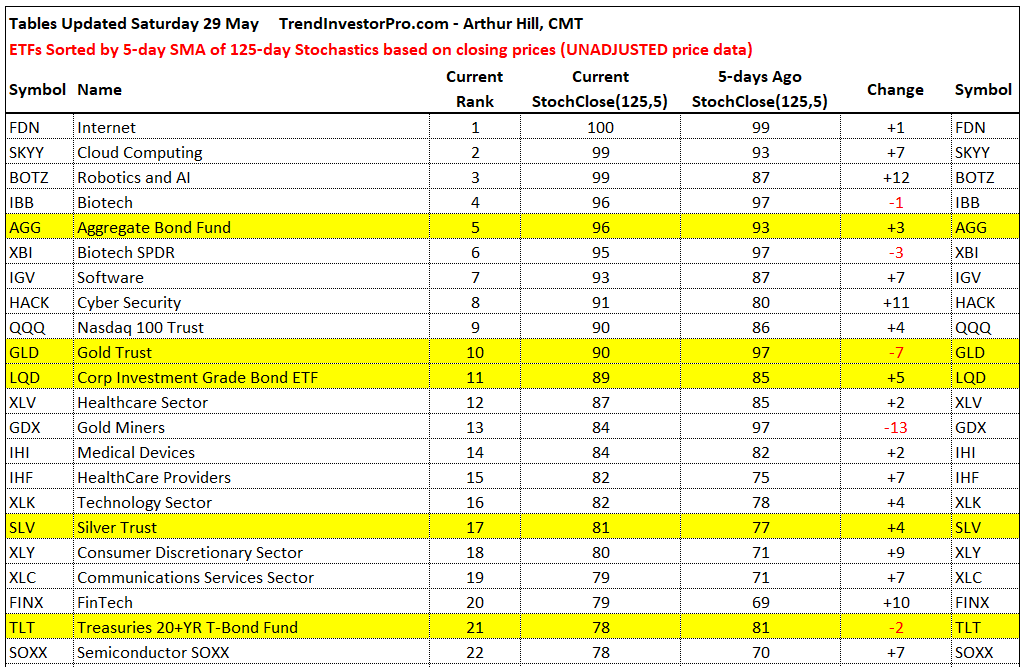
The image below comes from the StochClose rankings tables. You can read about the indicator here and see the complete tables in the link above.
There are 50 ETFs related to the US stocks in the core list of 60 ETFs. Of these 50, 29 (58%) finished the week with the StochClose at 60 or higher, which points to an uptrend. Only 6 finished with a StochClose below 40, which points to a downtrend (XES, REM, KRE, KBE, XOP, KIE). The remaining 15 were somewhere in between. Overall, there are more ETFs in uptrends than downtrends and this is net positive. The yellow highlights show the non-stock ETFs.
Rankings and Chart Setups are Different
The ETF ranking tables are designed for trend-momentum traders looking for the strongest ETFs. The StochClose is calculated on a 125-day timeframe, which makes it a 3-6 month trend indicator. Even though XLP, XLU and XLRE are not leading in the ranking tables, they broke out of flag-like patterns this week and these patterns were highlighted in Thursday’s report.
I noticed that bullish chart setups often occur in ETFs that are not leading. This makes sense because bullish chart setups often involve a pullback that pushes the StochClose lower. ETFs that don’t pull back, such as FDN, IGV and FINX, remain with high StochClose values. As noted above, TLT fell out of the top 20, but still has a bullish continuation pattern working.
Why Use Closing Prices for Indicators?
The Aggregate Bond ETF (AGG) spiked below its 200-day SMA on Thursday and then finished the day pretty much unchanged. This spike did not affect the Stochastic Oscillator because prices were already near the high of the 14-day range. The Commodity Channel Index, however, uses the typical price in its calculation ((H+L+C)/3). The spike low resulted in an exceptionally low typical price and CCI became oversold (below -200) on Thursday. In reality, AGG was not oversold.
The Premium Content Page
I created a page with Premium Content that is less time sensitive. Chart analysis, chart setups, indicator signals and ETF rankings are time sensitive and these reports get stale after a week or two. The Premium Content page contains articles to get you started using TrendInvestorPro, strategy articles, analysis considerations and long-term themes. A link can be found at the top of the main analysis page or here.
")