")
2022 has been a tough market for trend-followers, but swing traders have been able to catch a few rides. Trend-followers are suffering because whipsaws are above average this year. A whipsaw occurs when an uptrend cannot extend after a bullish trend signal and the trade results in a loss.
Before looking at some trend-following stats, note that I am using a database of 105 ETFs with trading history back to 2007 or earlier. These ETFs include US stock-based ETFs (index, sector, industry group), commodity ETFs, bond ETFs and currency ETFs. There are no international stock ETFs in this list. I am using the Trend Composite for trend signals in this test. A cross above zero triggers a bullish trend signal, while a cross below zero triggers a bearish trend signal. The Trend Composite and ten other indicators are part of the TIP Indicator Edge Plugin for StockCharts ACP.
From January 2007 to December 2021, there were 1739 bullish Trend Composite signals and 44.34 percent of these resulted in further gains before the Trend Composite triggered bearish. The average gain was 18.28% and the average loss was 4.48%. There were 104 bullish Trend Composite signals so far this year and only 19.23% of these resulted in a profit. The average gain was 2.97% and the average loss was 5.41%. 2022 has been a tough year for trend-following.
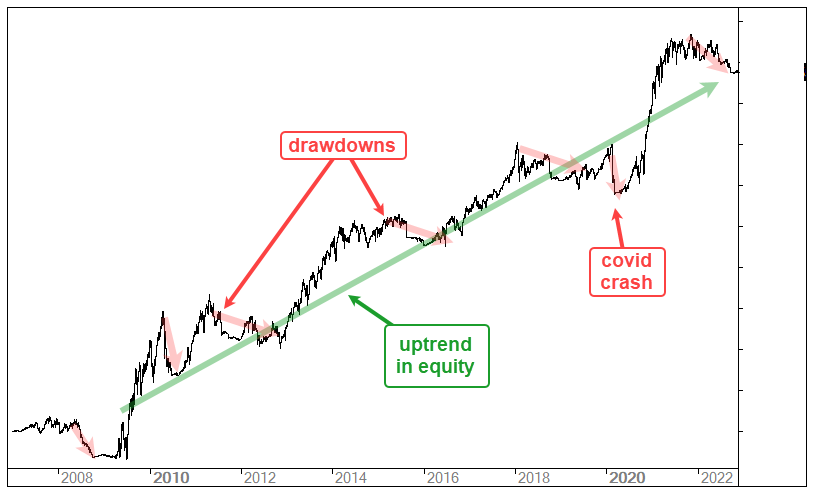
The chart above shows a performance example for a generic trend-following strategy. The strategy performs well over time as the equity curve moves from the lower left to the upper right (2007 to 2022). There are, however, drawdowns along the way and these drawdown periods can last more than a year (red arrow-line). Trend-following strategies work well when markets trend and suffer drawdowns when markets do not trend. **it happens.
We have all heard of diversification for a portfolio, but traders can also consider diversification for their strategies. Mean-reversion and swing trading strategies differ from trend-following strategies and have a better chance of success when markets do not trend. The chart below shows the Utilities SPDR (XLU) with the Trend Composite (bottom window) whipsawing this year as the ETF produced five double digit swings since late February (+20%, -16.8%, +21.4%, -22.7%, +14.4%). The blue lines show short-term bullish continuation patterns that swing traders could use to trade the short-term moves.
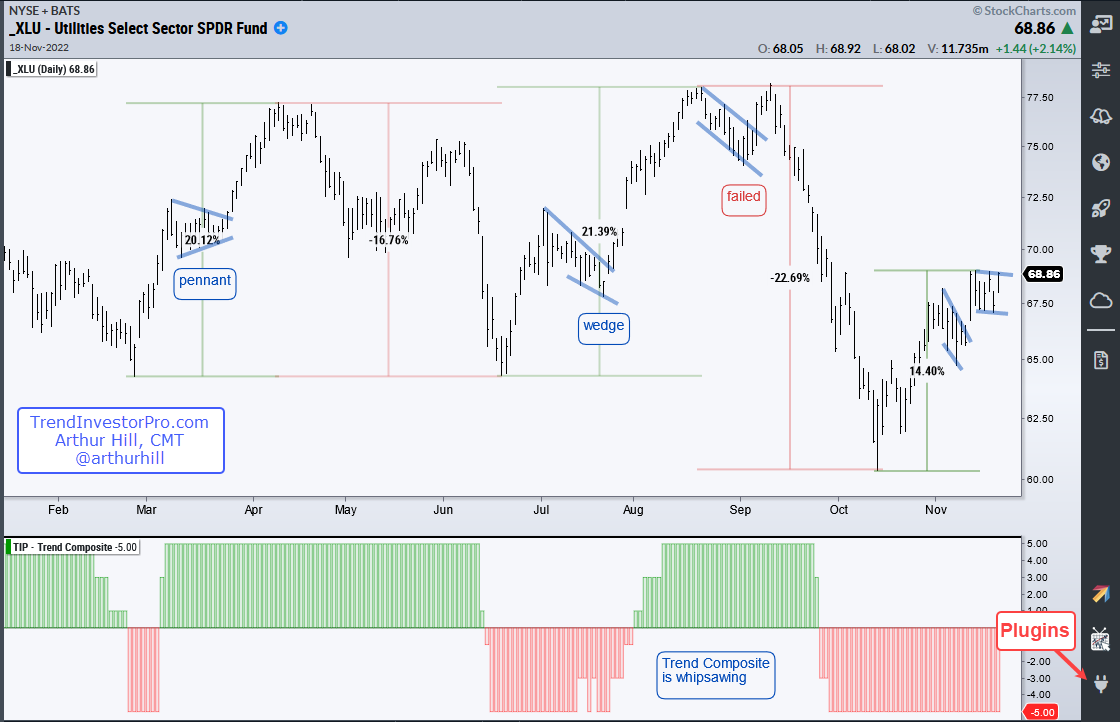
As the chart above shows, the March pennant and the July wedge led to big moves, but the early September flag breakout was a failure. Currently, XLU broke out of a falling flag with a surge last week Thursday (10-Nov) and formed another bull flag the last six days. A breakout would be short-term bullish. Note that swing trading strategies require more monitoring and traders often use profit targets to lock-in gains.
TrendInvestorPro tracks Trend Composite signals for the 274 ETFs in our MasterList and ranks these ETFs according to price performance. Our reports and videos highlight chart setups with dozens of ETFs featured each week. Click here for immediate access.
The Trend Composite, Momentum Composite, ATR Trailing Stop and eight other indicators are part of the TrendInvestorPro Indicator Edge Plugin for StockCharts ACP. Click here to learn more and take your analysis process to the next level.

