")
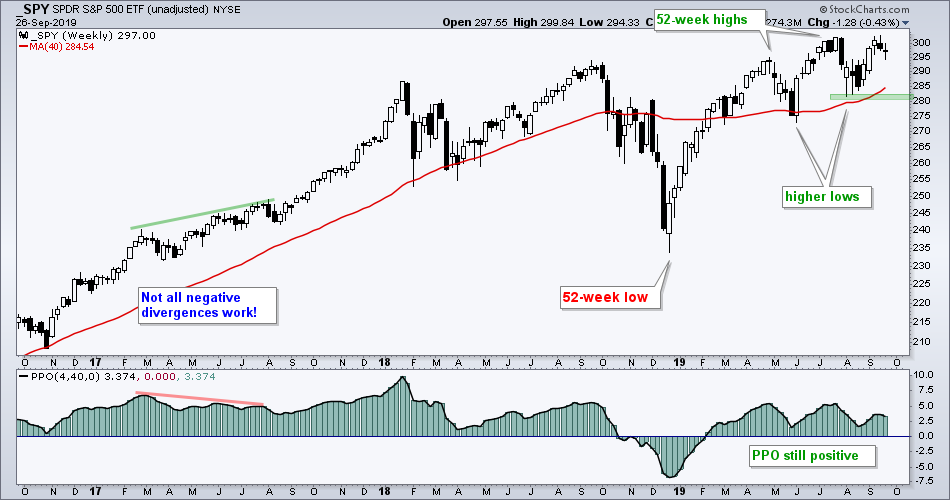
When looking at charts, it is also important to focus on what IS, not what MIGHT be. Let’s try this on the weekly chart for the S&P 500 SPDR. Here is what IS happening right now. SPY hit a new all time high in July, the ETF is above the rising 40-week SMA and the PPO(4,40,0) is positive. Furthermore, the index sports higher highs and higher lows in 2019. SPY is in an uptrend and this chart remains bullish. The August lows mark most recent important low and this is key support level to watch going forward.
I should probably just stop right there, but there are several possibilities out there to sow the seeds of doubt and confusion. SPY is trading near its July high so a Double Top is possible. The July high also marks the mother of all resistance levels (tongue planted firmly in cheek). Indecisive candlesticks formed the last three weeks so a reversal near the July high is possible. The PPO formed a lower high and momentum is waning. This uptrend is doomed, just not right now.
I know it is hard to unread something you just read, but forget the preceding paragraph. A Double Top would not be confirmed unless SPY breaks its August low. SPY surged 6% in three weeks so a little stalling is perfectly normal. The PPO may not be as strong as it was, but it is in positive territory so the momentum cup is half full, not half empty. A downtrend is impossible without a lower low and SPY remains well above the August lows.