")
Something must be right in the global equity markets because we are seeing new highs in a number of key indexes. The S&P 500 and Nasdaq 100 hit new highs to represent the US. The German DAX and French CAC hit new highs to represent Europe. The Nikkei 225 and Taiwan Index hit new highs to represent Asia, and the Bovespa hit a new high to represent Latin America.
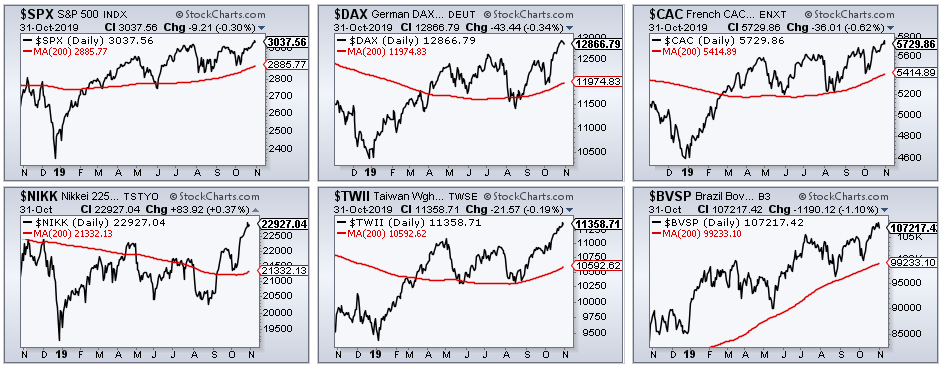
Sure, there are pockets of weakness and not every country index participated in the October surge. The Shanghai Composite was flat and remains below its September high, not to mention its April high. In Canada, the TSX Composite barely bounced in October, but did hit a new high in September and remains above its 200-day. Despite pockets of weakness, there is broad strength in global equities and this is positive for US stocks.
Here in the US, the stock market tide is bullish, but not lifting all boats. There are issues with the absolute number of new highs, the trading range in the Russell 2000 and relative weakness in small and mid caps. Nevertheless, there are still plenty of pockets of strength. We just have to find them! The Technology SPDR and Finance SPDR hit new highs last week, while the Healthcare SPDR came to life with the biggest October gain of the 11 sector SPDRs. These are the three biggest sectors in the S&P 500 and they account for 49% of the index weight.
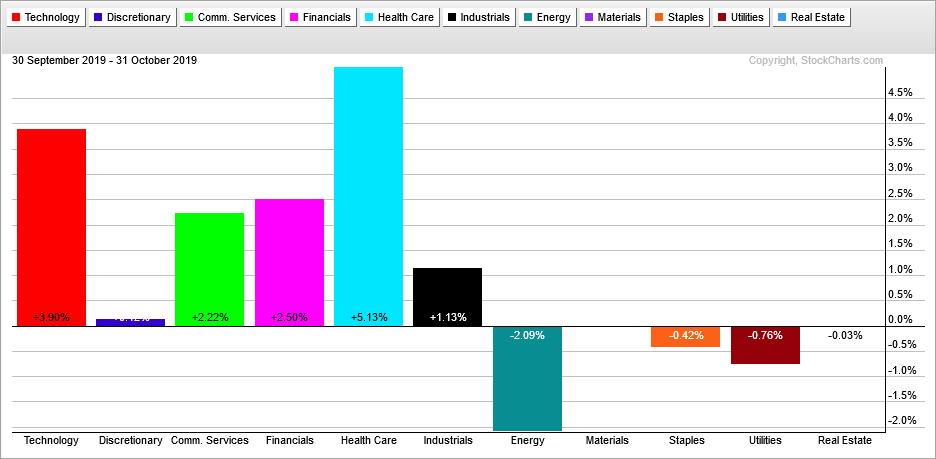
In fact, looking at the PerfChart above, we can see a clear preference for the offensive sectors over the defensive sectors this month. Technology, Communication Services and Financials led, while Staples, Utilities and REITs lagged. The Consumer Discretionary sector also lagged, but mixed performance is the story of this stock market right now. Overall, the shift towards the offensive sectors is net positive for stocks.
Programming Note: I will put out a video on Saturday morning and cover the 60 Core ETFs, including TLT, GLD and GDX.
New Highs for SPY and QQQ
The S&P 500 SPDR (SPY) hit a new high this week to affirm the long-term uptrend, which has been in force since mid February on the price chart. Price moved above the 40-week SMA and the PPO(4,40,0) turned positive. After hitting a new high in July, SPY embarked on a consolidation the next 13 weeks as an Ascending Triangle formed. This week’s breakout signals an end to this consolidation and a resumption higher.
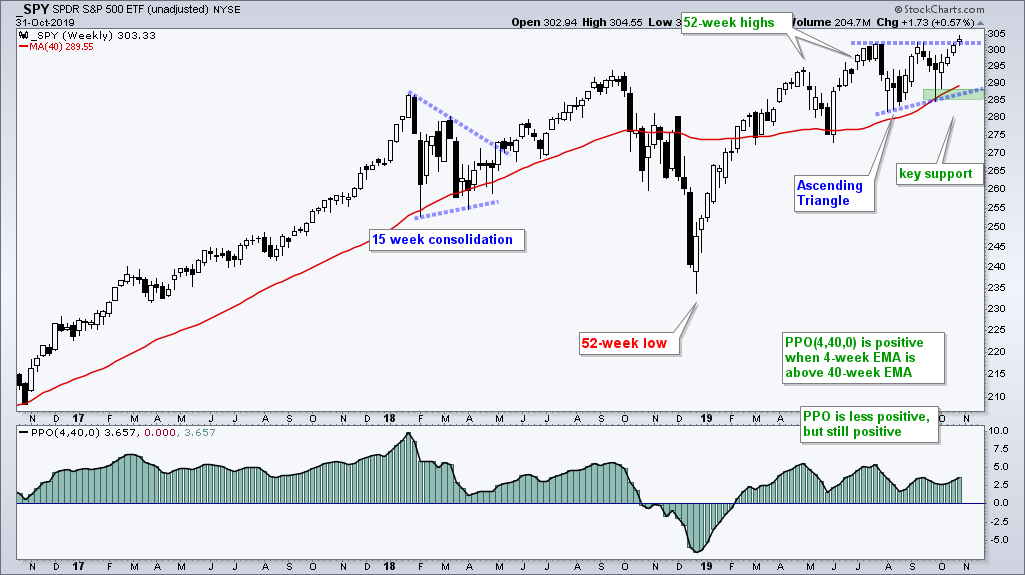
While no two corrections are exactly the same, corrections are part of the normal ebb and flow of an advance. Corrections can form as trading ranges or pullbacks. A trading range is a time-based correction and represents the pause that refreshes. A decline is a price-based correction that represents a pullback. Often, we get a little of both. The Ascending Triangle features a decline in August and a range the last three months. The correction in early 2018 featured two sharp pullbacks and a larger range.
Note that I would not turn bearish or get concerned if SPY pulls back after this breakout. A new high is a still new high and a pullback after the October run would be perfectly normal. In addition, I do not want to focus on every twist and turn, and start doing headline driven analysis with click bait titles. Take a step back, look at the bigger picture and focus on price movements that really matter.
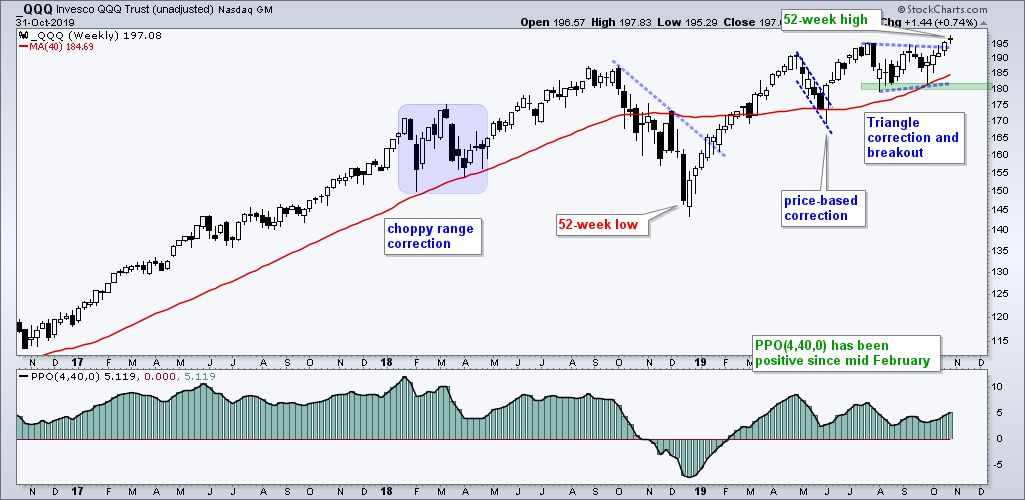
QQQ broke out of a triangle last week and hit a new high this week. This tech-laden ETF is keeping pace with SPY and this is positive for the broader market. Small and mid caps be damned! SPY is the 800-pound gorilla in the market and 85 of the Nasdaq 100 stocks are also in the S&P 500. QQQ is like the high-beta version of SPY. I would be concerned if the performance divergence between SPY and QQQ was as large as it is between SPY and IWM. QQQ is leading and this is bullish.
IJR Looks Stronger than MDY and IWM
The chart below shows the Russell 2000 ETF (IWM), the S&P SmallCap 600 SPDR (IJR) and the S&P MidCap 400 SPDR (MDY) to illustrate the mixed nature of the broader market. As the numbers suggests these three account for 2000+ stocks in the market or 1000 of the S&P 1500 Index. The other 500 stocks come from the S&P 500. These three ETFs did not break out to new highs in October and are still lagging SPY and QQQ overall.
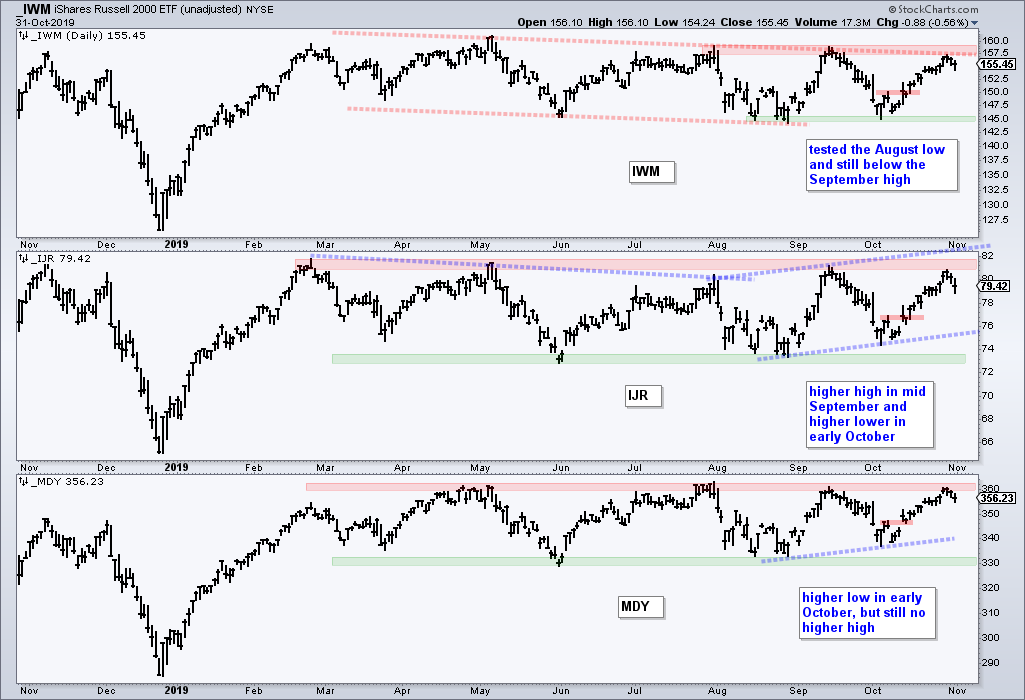
All three bounced in October and backed off resistance the last two days, but I would not call this a failure at resistance just yet. IWM is the weakest because it tested its August low in early October while the other two held above their August lows. IJR is the strongest because it forged a higher high from late July to mid September and a higher low from early August to early October. Thus, IJR could be in the nascent stages of an uptrend. We need breakouts in all three to show a broadening of the bull market.
Small-cap Breadth Flips Back to Net Bullish
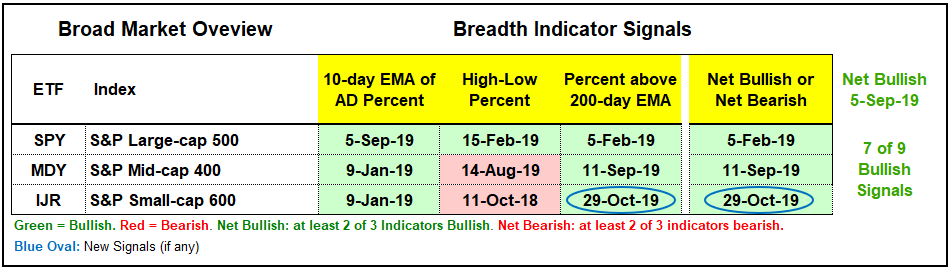
Small-caps came alive in October as the S&P 600 %Above 200-day EMA ($GT200SML) moved above 60%. With this latest bull signal, two of the three breadth indicators are on active bullish signals. The 10-day EMA of S&P 600 AD Percent ($SMLADP) triggered a bullish breadth thrust in early January and has yet to trigger bearish. S&P 600 SmallCap High-Low% ($SMLHLP) triggered bearish in October 2018 and has yet to reverse this signal with a move above +10%. The split in these two indicators is another reflection of the mixed market.
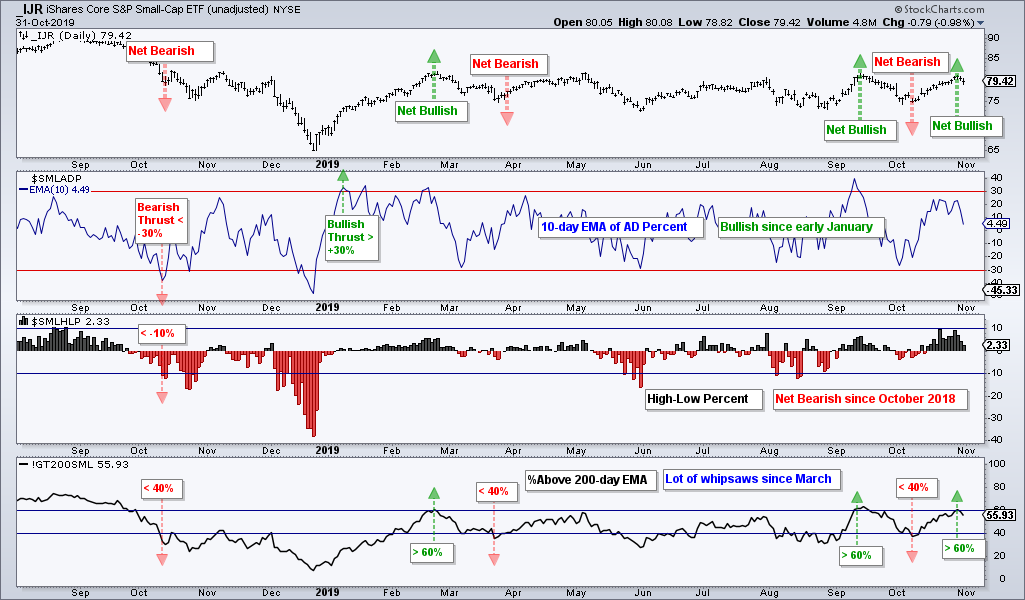
The %Above 200-day EMA indicator is causing all the whipsaws. Prior to the current bullish signal, the indicator moved above 60% in early September and then fell below 40% in early October. This tells me that there are plenty of small-cap stocks near their 200-day EMAs. A market bounce pushes these stocks above their 200-day EMAs, while a market dip pushes them back below. Many small-cap stocks are just not far enough above their 200-day EMAs to hold above then during the dips. There are plenty of trend-less stocks in the small-cap universe.
Index Breadth Model Improves
With a new signal in %Above 200-day EMA for small-caps, the Index Breadth Model now has seven of nine active bullish signals (78%). Lack of new highs continues to haunt this model, but we have yet to see an expansion of new lows. This is probably because the S&P MidCap and SmallCap Indexes have been range bound for several months now. Nevertheless, the weight of the evidence remains bullish until proven otherwise.
High-Low Lines Still Rising
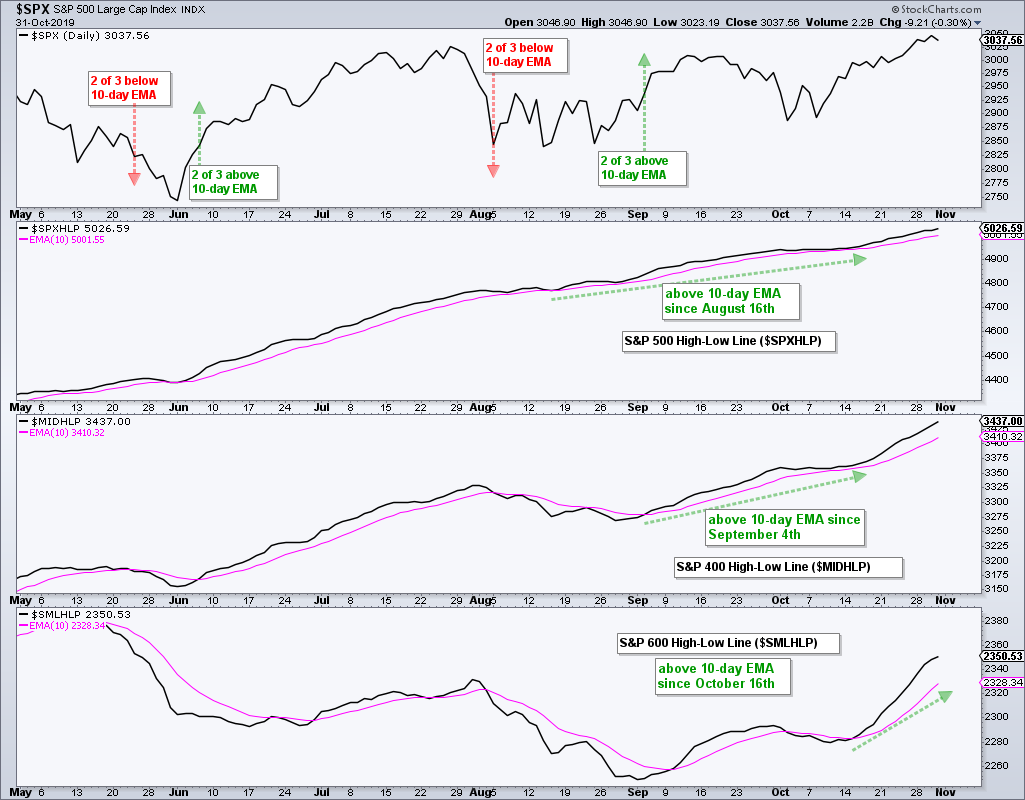
Even though the number of stocks making new highs remains uninspiring, there are still more stocks making new highs than new lows. This means the High-Low Lines are rising and this supports the bullish thesis. The $SPX High-Low Line has been above its 10-day EMA since mid August, the $MID High-Low Line has been above since September 4th and the $SML High-Low Line has been rising since mid October. Two of the three have been above their 10-day EMA (rising) since early September. The trouble starts when/if two of the three turn down and break their 10-day EMAs.
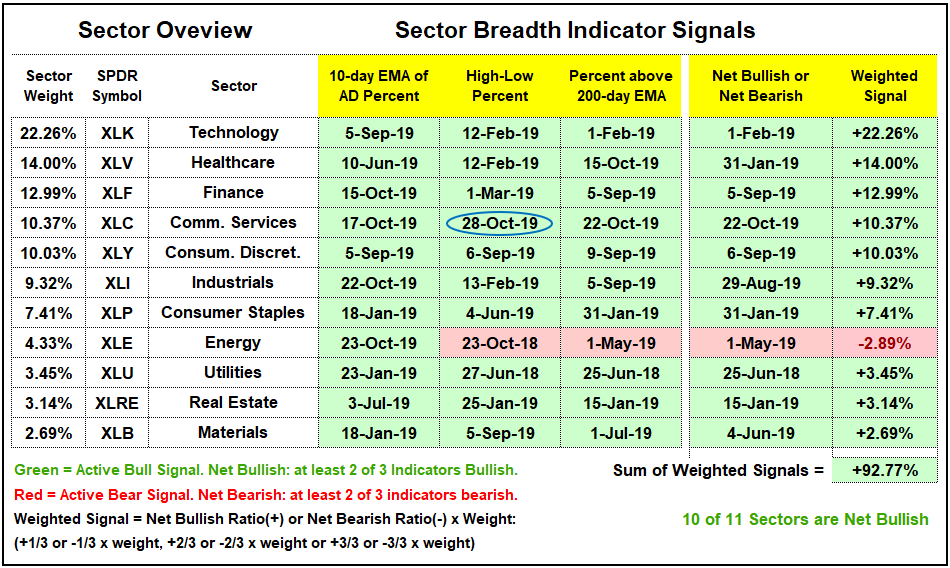
Sector Breadth Model Improves a Notch
Communication Services High-Low% ($XLCHLP) moved above +10% this week to trigger the only new bullish signal in the Sector Breadth Model. Actually, there is not much room for new bullish signals because 31 of 33 signals are bullish right now and 10 of 11 sectors are bullish. It is a sea of green for the S&P 500 with the Energy SPDR marking the only red spots. Outside of Utilities, REITs and Staples, the Technology and Healthcare sectors have the longest net bullish run. XLV has been net bullish since January 31st and XLK has been net bullish since February 1st.
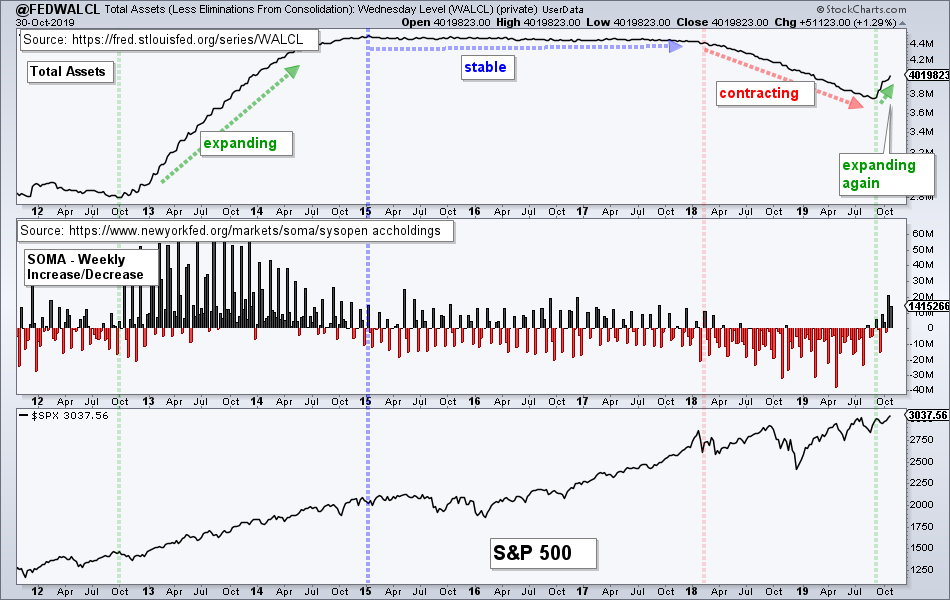
Fed Balance Sheet Expands Again
The Fed balance sheet increased again for the ninth week running. Fed assets are expanding and this is positive for stocks. At the very least, it is not a negative and we do not want to fight the Fed. The System Open Market Account (SOMA) increased as well for the six time in the last nine weeks. The increases over the last two weeks were the largest since February 2018. Thus, while an upturn in the 20+ Yr Treasury Bond ETF shows a flight to safety over the last two days, the increase in the balance sheet is net bullish for stocks.
Bottom Line: Bullish and Selective
The bulk of the evidence remains bullish for stocks, but not all boats are rising. Large-caps are clearly leading, while many small-cap and mid-cap stocks seem to be flat. The tape is bullish with SPY and QQQ hitting new highs and the offensive sectors taking the lead in October. The Fed is bullish with the balance sheet expanding over the last two months.
The trading ranges in the small-cap and mid-cap indexes and the lack of new highs in the broader market indicate that we need to be selective with stock and ETF picks. There are still strong uptrends, breakouts and mean-reversion plays to be had, but the success rate in a mixed market will also be mixed. We need to set our expectations accordingly.