")
Relative Performance and the 10yr Yield
The Market Regime is bullish, which means we are in a bull market. However, there are signs of underlying weakness over the last few days and this could give way to a pullback. Note that predicting a pullback within a bigger uptrend is challenging because the bigger uptrend is still the dominant force at work. Also note that a pullback within an uptrend is viewed as more of an opportunity than a threat. Sure, one pullback will ultimately extend and be the one that break’s the bull’s back, but the odds are against this scenario. In other words, the odds favor the bigger trend and a pullback that stops short of reversing the bigger uptrend.
Large-caps continue to lead with QQQ gaining around 1% on Thursday and SPY up .34%. The trouble starts when we move down in market cap. Mid-caps (MDY) were down .12%, small-caps (IWM) were down .42% and micro-caps were down 1% (IWC). We really do not need a breadth indicator to know that more stocks declined than advanced on Thursday. Nevertheless, we have breadth indicators and these confirm negative breadth within the S&P 500, S&P MidCap 400 and S&P SmallCap 600 on Thursday. The chart below shows Advance-Decline Percent for these three with red bars the last two days (red shading). NDX Advance-Decline Percent ($NDXADP) finished at zero, which means there were 50 advances and 50 declines.

Note that this chart is part of the Essential Breadth Indicator ChartList at StockCharts and this list is available to TrendInvestorPro subscribers. See this page for chart explanations, a detailed video and a link to a sign up form.
4-week HLP Turns Negative
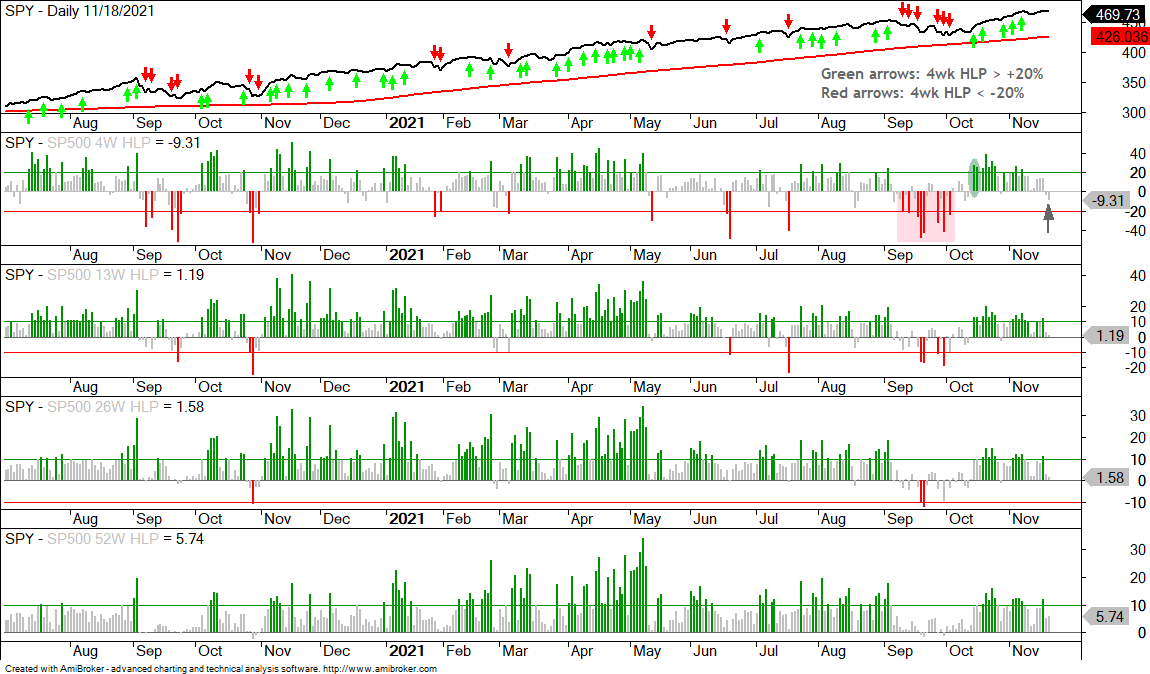
The next chart is not part of the chartlist above because StockCharts does not have these indicators. They are S&P 500 High-Low Percent covering 4, 13, 26 and 52 weeks. 4-week High-Low Percent is the percentage of four week highs less the percentage of four week lows. 4 weeks covers a month, 13 weeks covers a quarter, 26 weeks covers six months and 52 week covers the year. 4 and 13 week High-Low Percent are mostly used to identify tradable pullbacks and short-term upthrusts. 26 and 52 week High-Low Percent are better suited for trend. These two have a positive bias when exceeding +10% (green bars) and a negative bias when exceeding -10% (red bars).
The chart below shows that the September 2021 pullback was the deepest since September-October last year as 4-week High-Low Percent dipped below -20% several times (red bars). The indicator did not get back above +20% until October 21st (green bar/oval). Not all dips below -20% foreshadow a pullback, but such dips reflect an uptick in downside participation that needs to be countered with a move above +20%. Even though we have yet to see a tick below -20%, note that there were more 4-week lows than 4-week highs on Thursday (gray arrow), despite SPY closing at a new high. Upside participation is waning and this could lead to a pullback.
Thanksgiving Week
The equity markets will be closed on Thanksgiving Day (November 25th) and close at 1PM ET on Black Friday (November 26th). Trading volume is a little lighter the first three days of the week because many take the week off or travel ahead of the big day.
Seasonal patterns for Thanksgiving week favor the bulls, slightly. According to Fund Strat (Tom Lee), the S&P 500 has risen 76% of the time on Thanksgiving week since 1995. In general, Wall Street would be happy to see the markets do nothing Thanksgiving week and then resume normal activities the week after. Me too.
Note that I will take off next week and there will not be any commentaries on TrendInvestorPro. I will, however, update the ETF Trends, Ranking and Signals tables on Thursday and Saturday.
In the meantime, check out the Premium Page for in-depth articles and videos covering the StochClose strategies, exit strategies, seasonal patterns, breadth indicators and more.
Black Friday Specials
Black Friday week is perhaps the best week of the year if you are thinking of signing up to a charting service. StockCharts.com, TrendSpider and TradingView (affiliate link here) all run great promotions. Charting has become quite commoditized the last few years with many charting services becoming data resellers and advertising platforms. I used to peruse IBD (investors.com) for ideas on growth stocks, but their site has become unusable because of incessant pop-ups.
In addition to Amibroker, I find myself using TradingView more and more for the following reasons. First, default data is adjusted for splits and special dividends, but not ordinary dividends. Second, it is quite easy to add/remove stocks and ETFs on red, green, blue or purple watchlists. I keep my active positions on the green list, my working setups on the blue list and the hot momentum names on the red list. Third, TradingView is simple, clean and fast. And fourth, you can see the future earnings date right on the chart. This is handy if you want to avoid a new trade because the earnings report is too near.
TradingView runs a great Black Friday promotion every year and I signed up two years ago. Here is an affiliate link if you are interested in learning more.
Market Regime Notes
The Composite Breadth Model (CBM) remains bullish and has been bullish since May 2020 (see Market Regime page for charts covering the CBM, yield spreads and Fed balance sheet).
There was a bullish breadth pop with the SPY breakout on October 14th and a bullish Zweig Breadth Thrust on October 25th.
Large-caps continue to lead the market with SPY and QQQ hitting new highs this week, but mid-caps and small-caps are dragging their feet. Short-term breadth is also waning.
Investment grade and junk grade corporate bond spreads remain at low levels overall (since July) and there are no signs of stress in the credit markets.
The Fed balance sheet expanded by $12 billion and hit another new high this week.
10-yr Treasury Yield Trends Higher as TLT Consolidates
The 10-yr Treasury Yield is clearly in an uptrend as it retraced half of the August-March advance and turned up with a breakout in early August 2021. The August-March advance from .5 to 1.8 percent is part of the primary trend (up) and the decline back to the 1.2% area was a secondary downtrend (correction). The August breakout ended the correction and signaled a continuation of the primary uptrend. This argues for a move above 2% and is bearish for Treasury bonds. The blue lines define a rising channel with support marked at 1.4%.

The 20+ Yr Treasury Bond ETF (TLT) is less clear than the 10-yr Treasury Yield, but I must give it a bearish bias long-term and short-term. Long-term, the March-July advance retraced half of the prior decline. Think two steps down and one step up. TLT appeared to break down in the second half of September, but surged back above 150 in early November. This upswing reversed with a sharp decline the last seven days and I am drawing a triangle for the bigger pattern at work. This triangle is a consolidation after a 52-week low, which makes it a consolidation within a downtrend or a bearish continuation pattern. A break below the October low would signal a continuation lower.

Inflation is the hot topic right now and bonds typically loathe inflation. Inflationary pressures are usually bearish for bonds and argue for higher yields. Given all the inflation chatter, I am a bit surprised that TLT is above its October low and has not broken down. Similarly, the 10-yr Treasury Yield has yet to exceed its March high. Keep in mind that the markets are forward looking and pricing in events three to six months ahead. Inflation is the hot topic now, but will it be even hotter in three months? A breakdown in TLT would say YES. An upside breakout to the triangle would say NO.
Gold Breaks Out with Big Move
The Gold SPDR (GLD) broke above its summer highs with a big move last week and reversed its long-term downtrend. Big triangles sometimes result in reversals instead of continuations. The bias is the direction of the prior move, but sometimes the break goes the other way. Could TLT do the same? The GLD breakout is clearly to the upside and bullish until proven otherwise. GLD stalled after the breakout surge to form a high and tight flag. A breakout at 175 would be short-term bullish and signal a continuation higher. Those looking for a pullback opportunity can watch the breakout zone around 170, which turns first support. Also watch for the Momentum Composite to dip to -3 for a short-term oversold condition.

Dollar Extends on Wedge Breakout
The Dollar Bullish ETF (UUP) seems to like something out there because it surged to new highs here in November. The bigger trend was already up (green rising channel). Short-term, UUP pulled back with a small wedge and broke out on October 29th. This breakout ended the small pullback and signaled a resumption of the existing uptrend. The late October low marks support at 25 for now and I will likely raise this in the coming weeks.

Oil Pulls back within Uptrend
Oil is getting hammered on Friday morning (-3%) and could become short-term oversold this week. Overall, West Texas Intermediate ($WTIC) remains in a long-term uptrend. After a 34% advance from mid August to mid October, oil fell back the last few weeks with a short correction. WTI became short-term oversold on 4-November (red arrow) and bounced, but did not exceed the prior highs and trigger a short-term breakout. The DB Energy ETF (DBE) chart in the lower window shows a bull flag taking shape. This is a short-term downtrend within a long-term uptrend. A move above this week’s high would break flag resistance and signal a continuation higher.
