")
The S&P 500 has been trending lower since the peak in January 2022, but this decline could be a long correction after a massive advance. The pattern taking shape and the retracement amount are typical for corrections. Today’s article to highlight this setup and show the key level to beat going forward.
The price chart shows a massive advance into January 2022 and an extended decline the rest of the year. The long-term trend is down with a big falling wedge taking shape. Notice that this wedge retraced around half of the prior advance. The falling wedge is typical for a corrective pattern and 50% is the base case for a retracement. Charles Dow noted that corrections retrace one to two thirds of the prior advance with half being the base case. Think of its as two steps forward and one step backward.
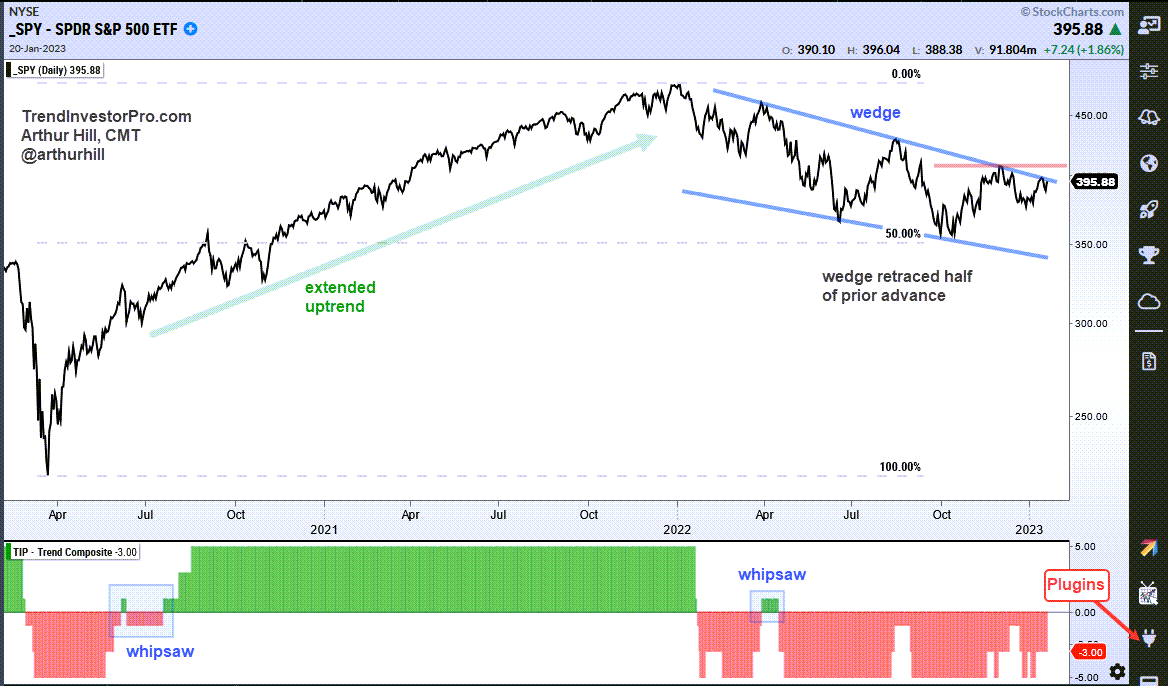
There is a bullish setup on the price chart, but the trend is down until proven otherwise. In other words, I am bearish until I see evidence to the contrary. There are two items to watch. First, a move above the December high (410) would trigger a wedge breakout and a higher high. Second, watch for the Trend Composite to turn positive. This indicator aggregates signals from five trend-following indicators. It has been bearish (negative) since mid April.
We unveiled a mean-reversion trading strategy for ETFs this month at TrendInvestorPro. This is a rules-based trading strategy complete with quantified performance metrics to set expectations. This strategy complements the trend-momentum strategy that uses the Trend Composite for signals. Click here for immediate access.
The Trend Composite, Momentum Composite, ATR Trailing Stop and eight other indicators are part of the TrendInvestorPro Indicator Edge Plugin for StockCharts ACP. Click here to learn more and take your analysis process to the next level.