The Market Regime remains bullish with SPY and QQQ hitting new highs on Thursday. The S&P MidCap 400 SPDR (MDY) and S&P 500 EW ETF (RSP) hit new highs Monday-Tuesday and then fell back pretty hard on Wednesday, before bouncing on Thursday. New highs are clearly more bullish than bearish. The noise level is above average this week because we are in the middle of earnings season and some biggies reported this week (Apple, Amazon, Microsoft, Alphabet, Mastercard, Ford, GM and a few hundred others). Apple and Amazon are trading lower after their reports on Thursday and this is weighing on the broader market Friday morning. One day does not a trend make. Also keep in mind that SPY (+6.8%) and QQQ (+7.3%) produced big gains in October so a little corrective price action would be perfectly normal.
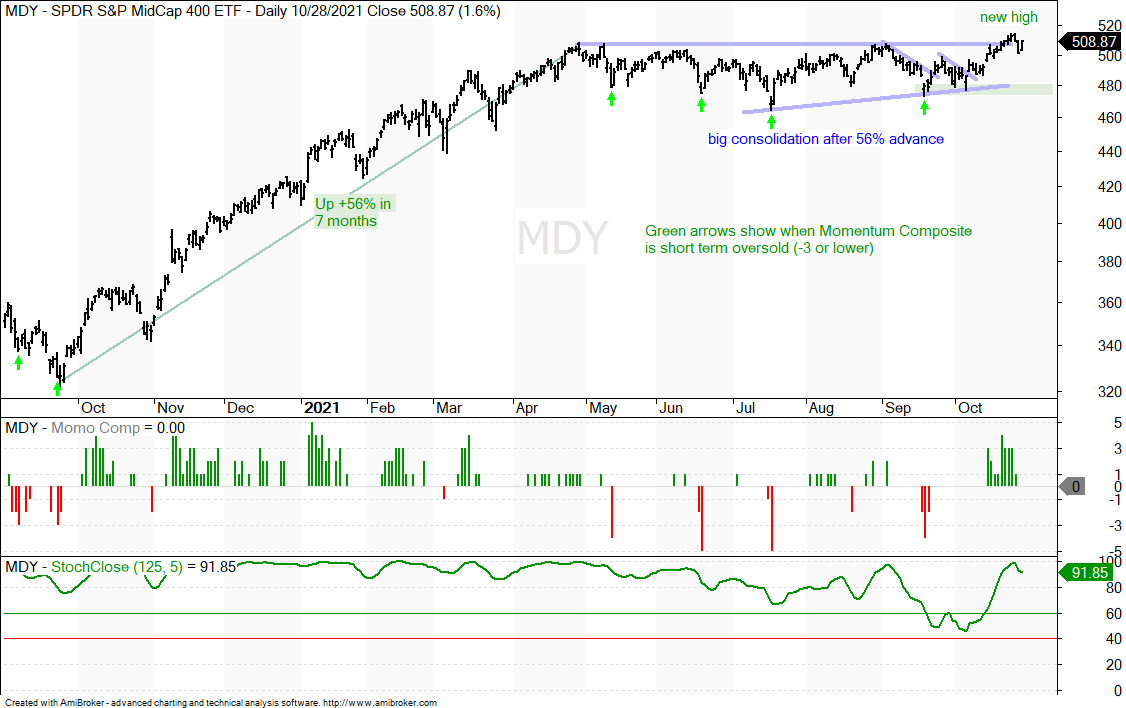
The chart below shows the S&P MidCap 400 SPDR (MDY) with a long triangle and a move above the upper line, as well as a 52-week high. This is clearly more bullish than bearish. Moreover, a triangle within an uptrend is typically a bullish continuation pattern. We could see some backing and filling with a move back into the triangle, but the cup is half full for mid-caps.
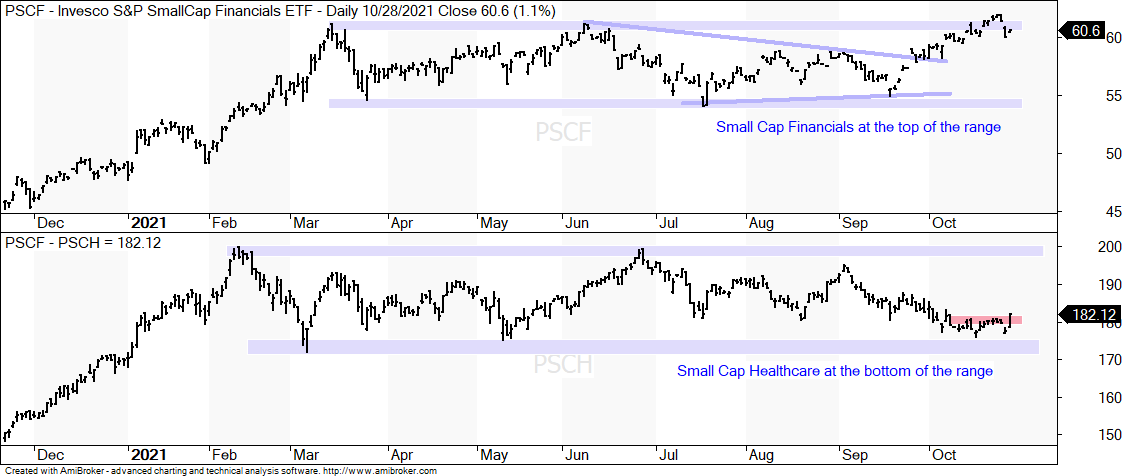
Small Cap Healthcare
I featured the Small-cap Healthcare ETF (PSCH) on Thursday (here) and noted that Healthcare is the largest sector (19.44%) in the Russell 2000 ETF (IWM). PSCH remains within a large trading range, but the ETF was trading near support and surged on Thursday to break short-term resistance. This could be a positive development for IWM. Note that financials is the second biggest sector (15.55%) and continued strength in the Small-cap Finance ETF (PSCF) is also important for IWM.
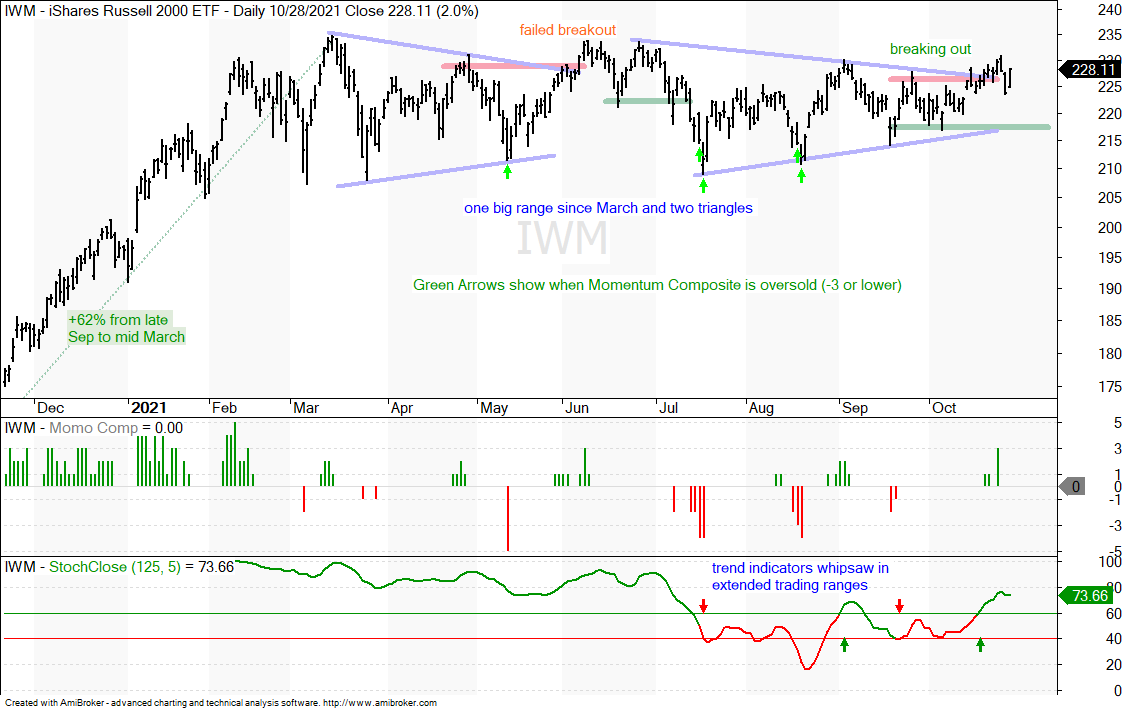
The next chart shows the Russell 2000 ETF (IWM) with a 62% gain from late September 2020 to March 2021 and then a long trading range since mid March. There are two triangles within this trading range. The first breakout attempt failed (June-July) and another breakout attempt is underway. IWM has been lagging SPY for months, but the cup is still half full with the triangle breakout working. Note that the red (resistance) and green (support) lines are based on closing prices. Nervous nellies can place a stop just below this week’s low. Otherwise, a close below 217 (green line) would negate the triangle.
Market Regime Notes
The Composite Breadth Model (CBM) remains bullish and has been bullish since May 2020 (see Market Regime page for charts covering the CBM, yield spreads and Fed balance sheet).
There was a bullish breadth pop with the SPY breakout on October 14th and a bullish Zweig Breadth Thrust on October 25th.
The percentage of SPX stocks above the 100, 150 and 200 day SMAs increased the last three weeks and exceeded their mid September peaks.
Investment grade and junk grade corporate bond spreads remain at low levels overall (since July) and there are no signs of stress in the credit markets.
The Fed balance sheet contracted by $9 billion, which is a tiny amount.
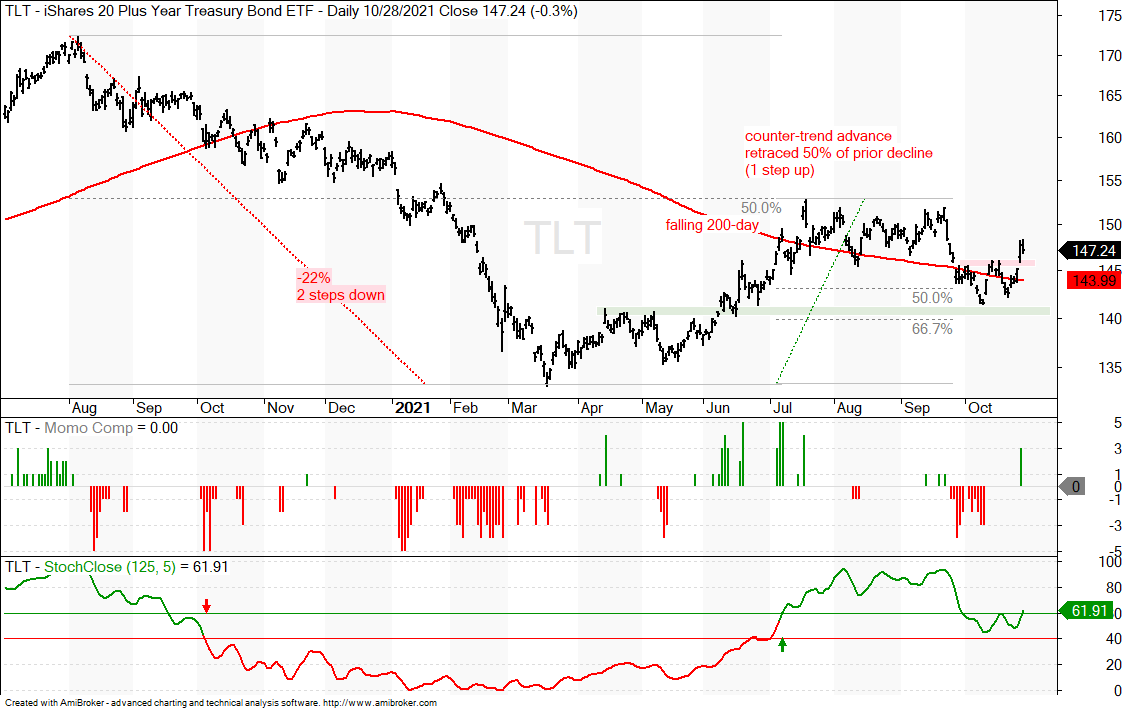
TLT Gives Mixed Signals, but TNX is Bullish
The 20+ Yr Treasury Bond ETF (TLT) is all over the place and I could make either case: bullish or bearish. On the bearish side, TLT retraced half of the 22% decline and then turned down the last few months. The 200-day is still falling. On the bullish, side, StochClose is green (uptrend signal) and TLT is back above the 200-day. The ETF retraced 50-67% of the March-July advance with the pullback into October and broke short-term resistance with a surge this week. Flip that coin!
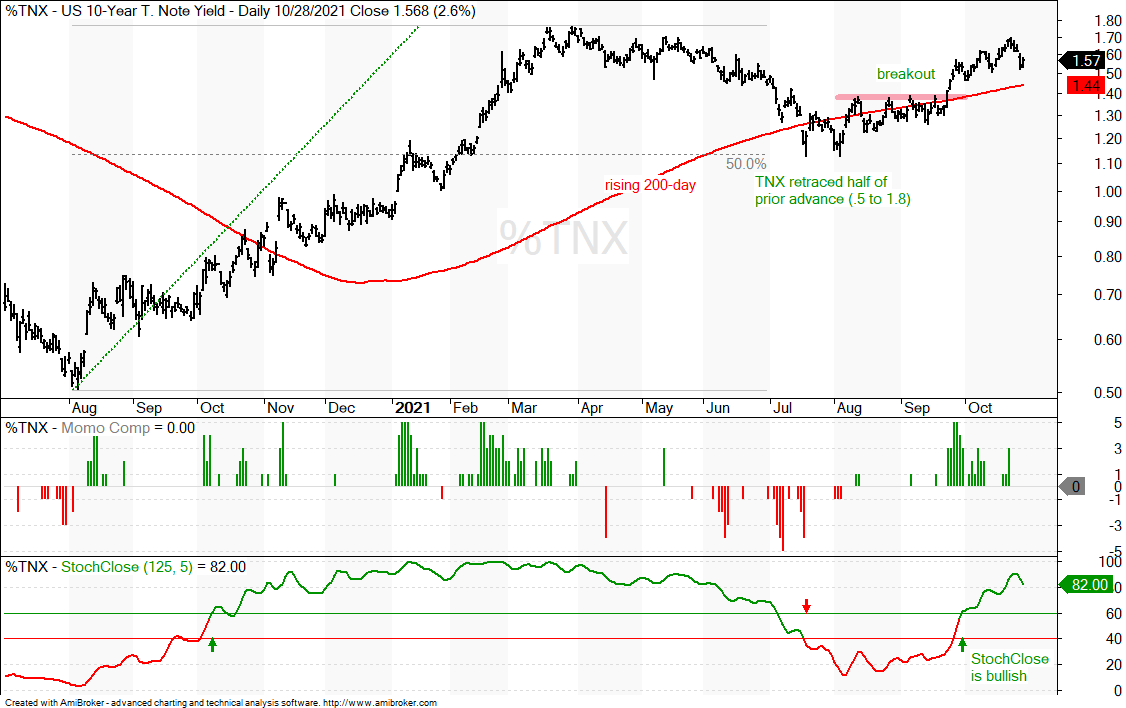
The 10-yr Treasury Yield is perhaps the tie break and I see a clear bullish case here. Keep in mind that Treasury bonds fall when yields rise so a bullish stance for the 10-yr Treasury Yield implies a bearish stance for TLT. The 10-yr retraced 50% of its August to March advance with the decline into July. It firmed in the 1.2% area for a few weeks and then broke back above the rising 200-day, and resistance at 1.4%. StochClose turned bullish with this breakout as well. Thus, my overall stance is bearish on Treasury bonds and bullish on Treasury yields.
Gold Challenges 200-day
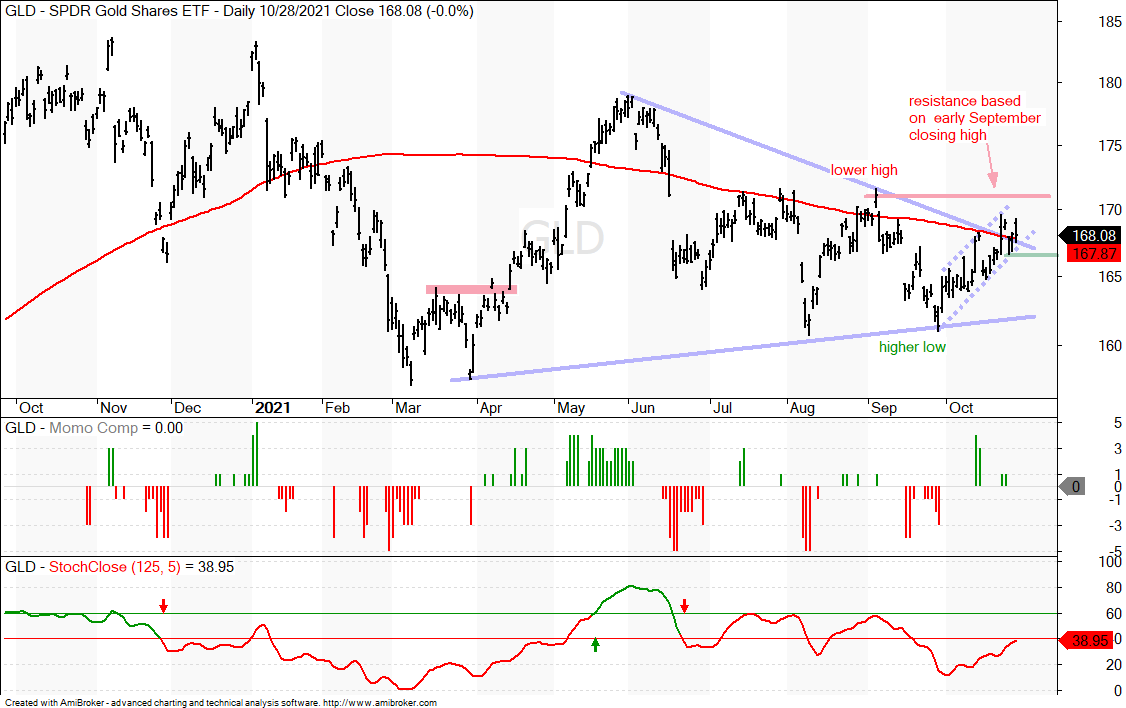
The Gold SPDR (GLD) is just as confused as TLT and I do not see a decent setup on the chart. GLD is just above its falling 200-day and trying to break out of a big triangle. As noted last week, triangles within downtrends are typically bearish continuation patterns, but large triangles can break either way. The higher low from March to September shows buying pressure coming in at a higher price level (bullish), while the lower high from June to September shows selling pressure coming in at a lower price level (bearish). This bullish versus bearish offset is why triangles are neutral until the decisive break. GLD is trying to break the upper line and 200-day, while the early September close marks resistance (red line). Even though this increases the chances of whipsaw, I usually follow the swings within the bigger pattern. The current swing is up (blue dashed lines) with this week’s low marking short-term support at 167.5.
Dollar Corrects with Bull Flag
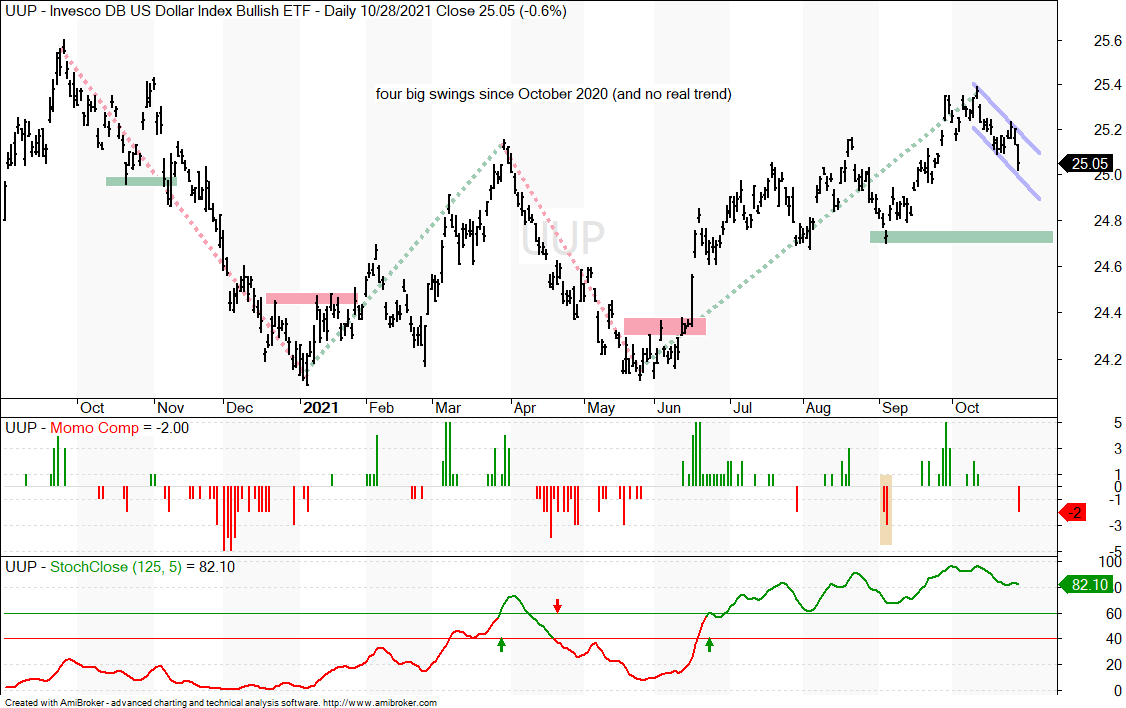
The Dollar Bullish ETF (UUP) is also a bit of a mess with four sizable swings the last 13 months (green/red dotted lines). The current swing is up (May to October) and the ETF is correcting with a short pullback the last few weeks. It looks like a bull flag is taking shape and the Momentum Composite hit -2 this week. A reading of -3 would show an oversold condition and provide the first setup alert to watch for a StochRSI pop.
Oil Edges Lower after New High
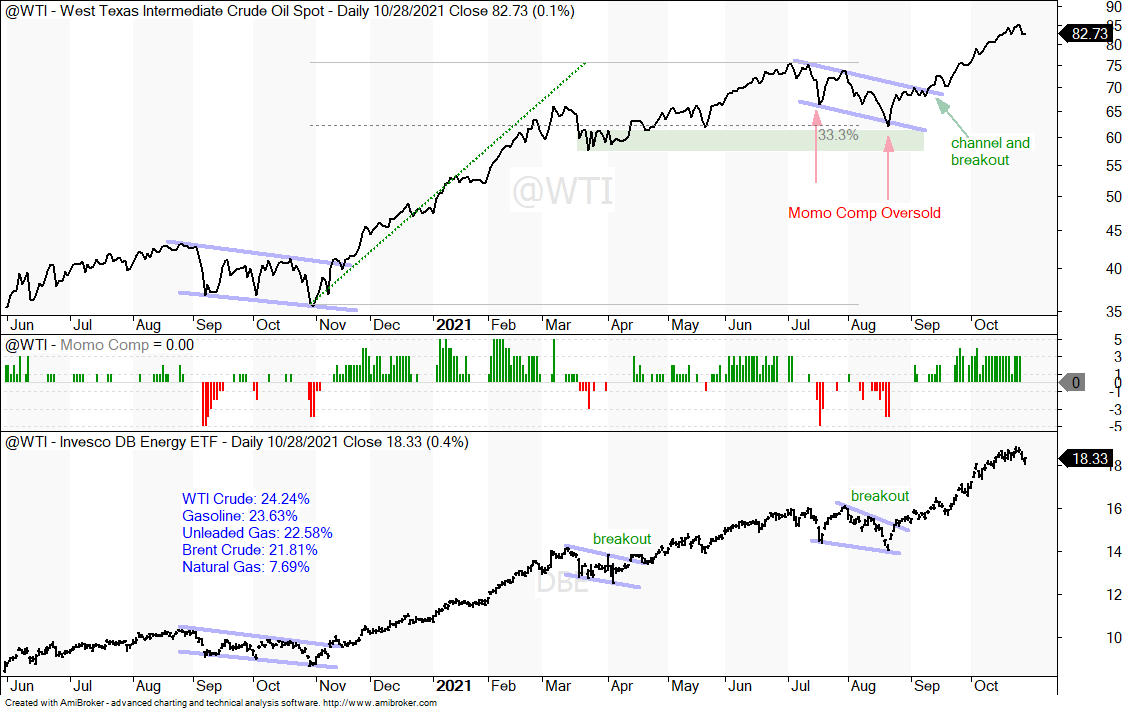
There is no change in oil as West Texas Intermediate hit a new high last week and fell back a little this week. The falling channel in July-August provided the last setup and the breakout led to new highs the last five weeks. Spot crude is up some 30% since mid August and one of the strongest commodities out there. There is no setup on this chart, just a strong and leading uptrend. The lower window shows the DB Energy ETF (DBE), which is around 92.3% oil complex and 7.6% natural gas. The price charts are pretty similar with consolidation breakouts in April and August, and a new high this week.
")