")
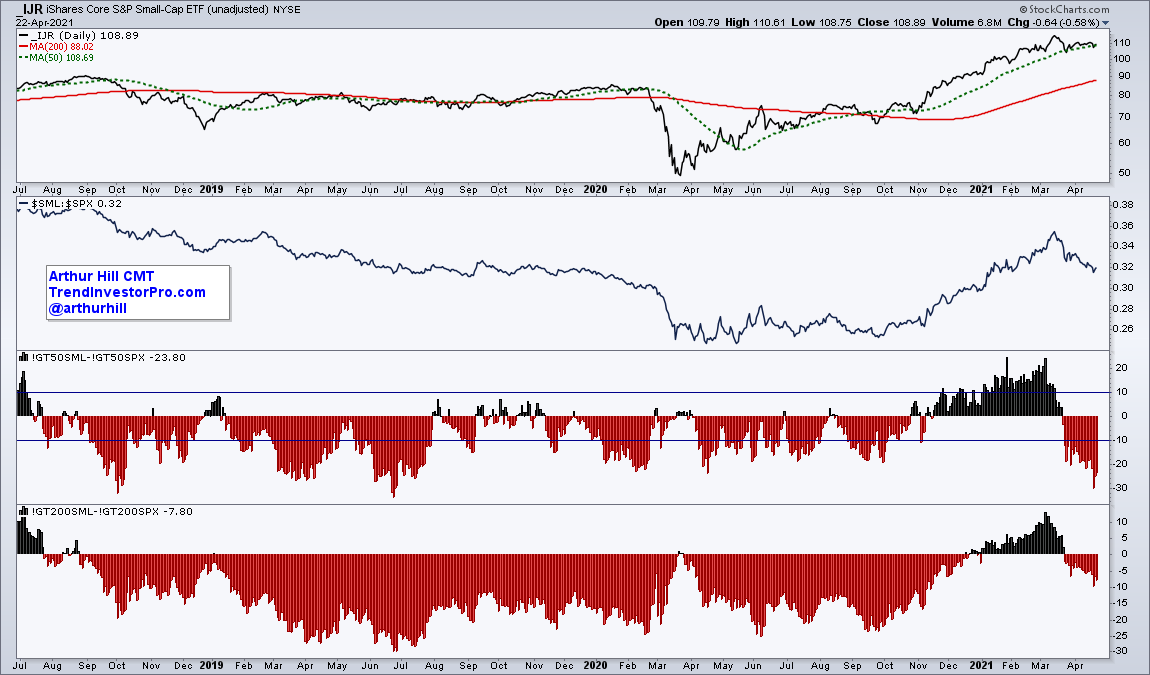
Small-cap breadth is seriously lagging large-cap breadth, but we have yet to see a bearish breadth thrust or a breakdown in the S&P SmallCap 600 SPDR (IJR), which is currently consolidating. This commentary will look at the breadth thrust signals and compare the percentage of stocks above the 50-day SMA for the S&P 500 and the S&P SmallCap 600.
The chart below shows the percentage of stocks above the 50-day SMA for $SML and $SPX in the middle windows. These indicators, which are part of my breadth model, are used to signal bullish and bearish breadth thrusts with moves above 85% or below 15%. The red and green boxes show signals over the last three years.
The difference between the two indicators is shown with the histogram in the lower window. Over the last three years, small-cap breadth outperformed large-cap breadth for two extended periods: early March to early July 2018 and late October to mid March (green shading). The green bars show when this differential exceeds +10% and the red bars show when it exceeds -10%.
Small-cap breadth lagged from mid July 2018 to late October 2020, but there were two impulse blips along the way: January 9, 2019 and October 2, 2019 (light blue shading). These blips did not last, but the sharp shifts to small-caps marked decent bottoms. Currently, the differential exceeded -10% on March 23rd and dipped below -30% this week. This shows exceptional relative weakness in small-caps and could foreshadow future underperformance.
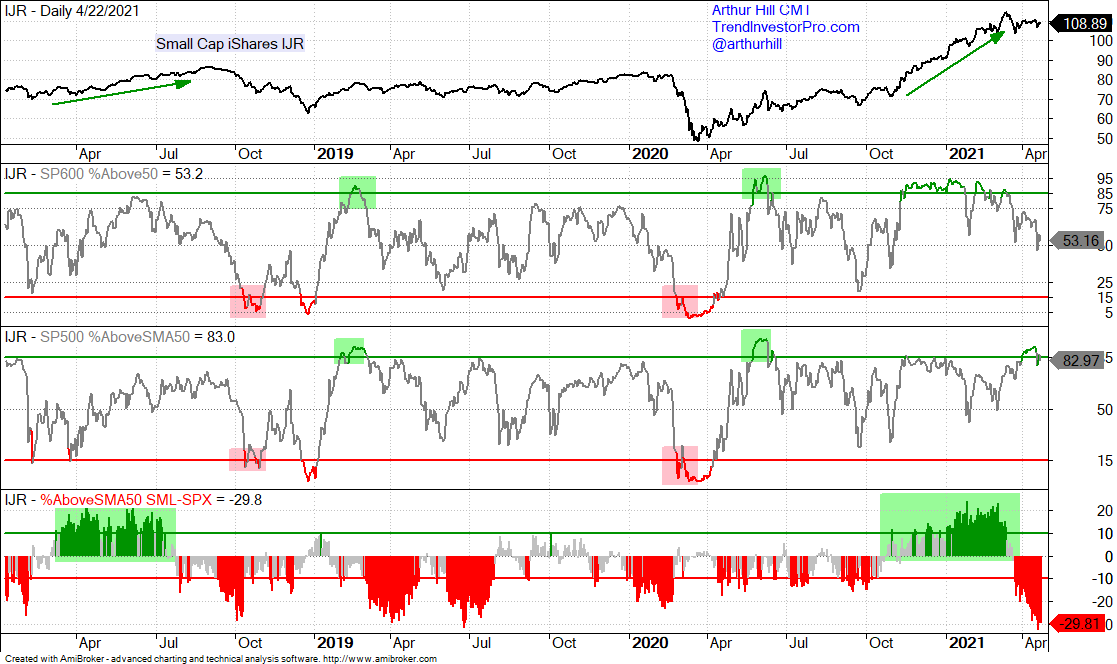
Note that you can chart similar indicators are StockCharts and I recently added these charts for the Essential Breadth Indicator ChartList, which has over 100 breadth charts and is available to TrendInvestorPro subscribers. The chart below shows the IJR, the $SML:$SPX ratio, %Above 50-day EMA differential and the %Above 200-day EMA differential.