The long-term trend for the Semiconductor ETF (SMH) remains up, but the ETF is coming under some selling pressure and underperforming the broader market. While this is not enough reason to turn long-term bearish, it does increase the odds of corrective period in the coming weeks.
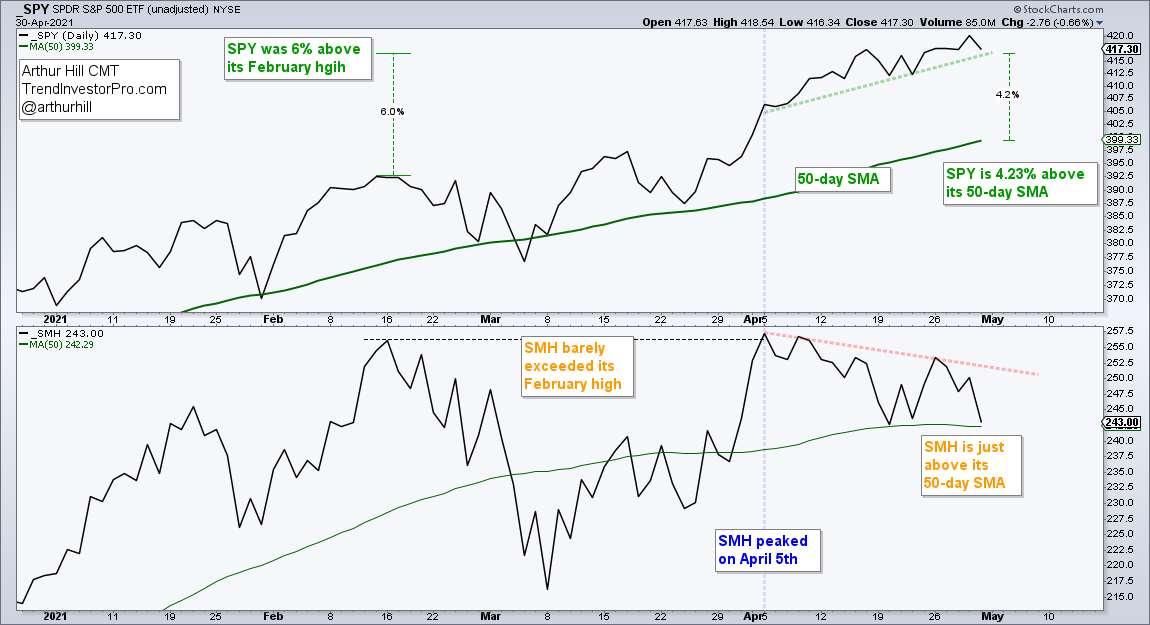
First, let’s compare performance between SPY and SMH from mid February to April. SPY was 6% above its mid February high with Thursday’s close, which was a fresh 52-week high. SMH, in contrast, barely exceeded its February high. Even though SMH was not keeping pace, it did manage a new high on April 5th so I let it go.
The vertical blue line on the chart above shows when SMH peaked on April 5th. SPY moved higher the last few weeks and is over 4% above its rising 50-day SMA. SMH, in contrast, moved lower the last few weeks and is barely above its 50-day SMA. This shows both absolute and relative weakness.
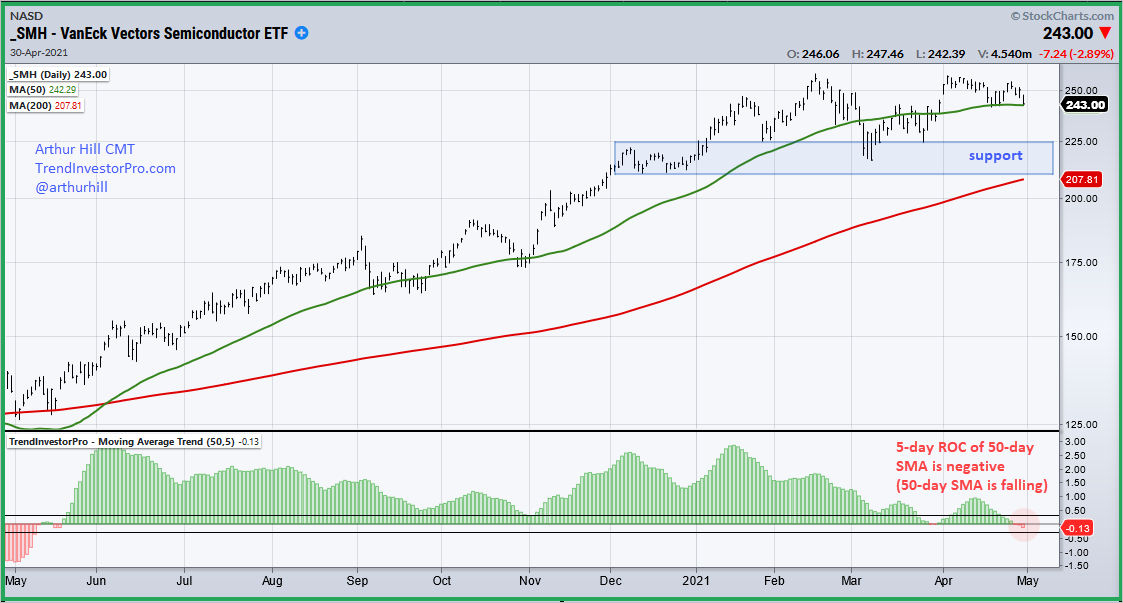
Also note that the 50-day SMA for SMH turned lower the last five days. The next chart shows the 5-day Rate-of-Change for the 50-day SMA in the indicator window. This indicator is part of the TIP Indicator Edge Plugin for StockCharts ACP. The indicator was positive when the 50-day SMA rose from May 19th, 2020 until March 26th, 2021. It went briefly negative in late March and more negative here in late April. A falling 50-day SMA further increases the odds for a correction and I would mark support in the 210-225 area.
TrendInvestorPro focuses on finding uptrends and trading in the direction of these uptrends. Each week we track trend signals and rank performance for 120 ETFs in our core list. We then highlight bullish setups within these uptrends. Click here to get immediate access to our ETF Reports, Market Timing Report and Weekend Video.
")