The stock market took on a more offensive tone over the past week with some of the beaten down groups outperforming. In addition, some of the defensive leaders underperformed and even corrected.
The Utilities SPDR, Consumer Staples SPDR and 20+ Yr Treasury Bond ETF softened as money moved out of some defensive areas. The Retail SPDR (XRT), Regional Bank ETF (KRE) and Biotech ETF (IBB), which have been trending lower, perked up and led, but just for a week.
Elsewhere, we are seeing continued leadership from the Home Construction ETF (ITB) and Homebuilders ETF (XHB), which are the two strongest ETFs in our basket. We also saw a successful support test from the five offensive sectors as they broke short-term resistance levels and these breakouts held.
There is not much change in the overall picture, but a new group emerged this week. These are ETFs that have been trending lower for months, but started showing relative strength the last eight weeks. We are also seeing some corrective patterns develop in some of the lagging tech-related ETFs.
Ranking and Grouping Summary
Note that I expanded my core ETF list to 60 by adding IEMG, EFA, BOTZ and a few others. There are another zillion ETFs to consider, but I want to keep the list manageable and limit duplicates. We do not need five Technology sector ETFs or ten bond-related ETFs. Less really is more when it comes to the size of your chart lists.
The number of groupings is not fixed, but I try to keep the number contained. The idea is to rank the ETFs by groupings from top to bottom. ETFs in Group 1 are clearly leading with the strongest uptrends, while ETFs in group 7 are clearly lagging with the strongest downtrends.
Group 1: Uptrends and Leading
ITB, XBH, SOXX, XLK, VIG, PFF
Group 2: Uptrends and Pulling Back or Consolidating
Note that I precede all my chart symbols with an underscore (_SPY) to chart unadjusted data, which is data without dividend adjustments. Dividend adjustments are good for seeing the total return picture, but I prefer unadjusted data for charting purposes. Dividend adjustments add the dividend back to historical prices. This literally changes the historical data with each dividend and creates an upward skew. Looking for an example? Compare XLU with _XLU over a 10 year period.
Group 1: Uptrends and Leading
ITB, XBH, SOXX, XLK, VIG, PFF
Three ETFs in my core list hit new highs this week and are the undisputed leaders right now: the Home Construction ETF (ITB), Homebuilders ETF (XHB) and Preferred Stock ETF (PFF). The chart below shows ITB surging 1.5% on Wednesday and 2.93% over the last two days. This is the biggest two day advance since August. It has been up, up and away since the Ascending Triangle breakout in mid August.
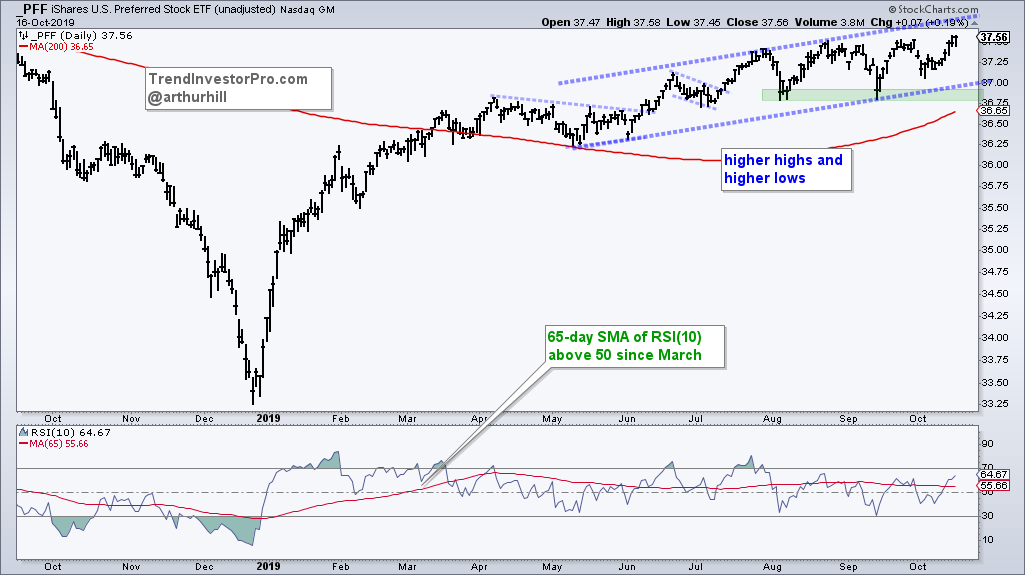
The next chart shows PFF moving above its 200-day SMA in March and working its way higher since April. There is not a lot of upside momentum behind the move, but there is a clear progression of higher highs and higher lows. PFF is one of a handful of ETFs that hit new highs this week. Note that I am charting unadjusted data (_PFF) to remove the dividend adjustments and focus solely on price action.
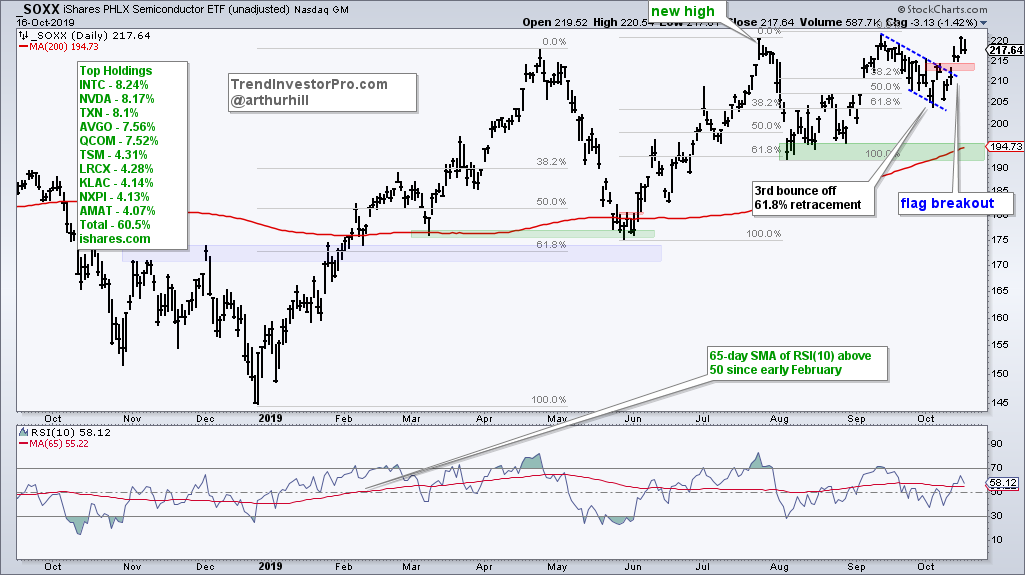
The Semiconductor ETF (SOXX) broke out of its flag formation with a surge the last four days. The ETF is near a new high and clearly a leader in the market right now. Short-term, I would watch 210. A move below this level would negate the flag breakout, but not affect the overall uptrend.
The Technology SPDR (XLK) poked its head above the triangle trendline on Tuesday, but fell back on Wednesday. The triangle is a consolidation within an uptrend, which makes it a bullish continuation pattern. Note that XLK held well above its August low and outperformed the market in early October. The ETF is now within 1% of a new high and still outperforming.
Group 2: Uptrends with Pull Backs or Consolidations
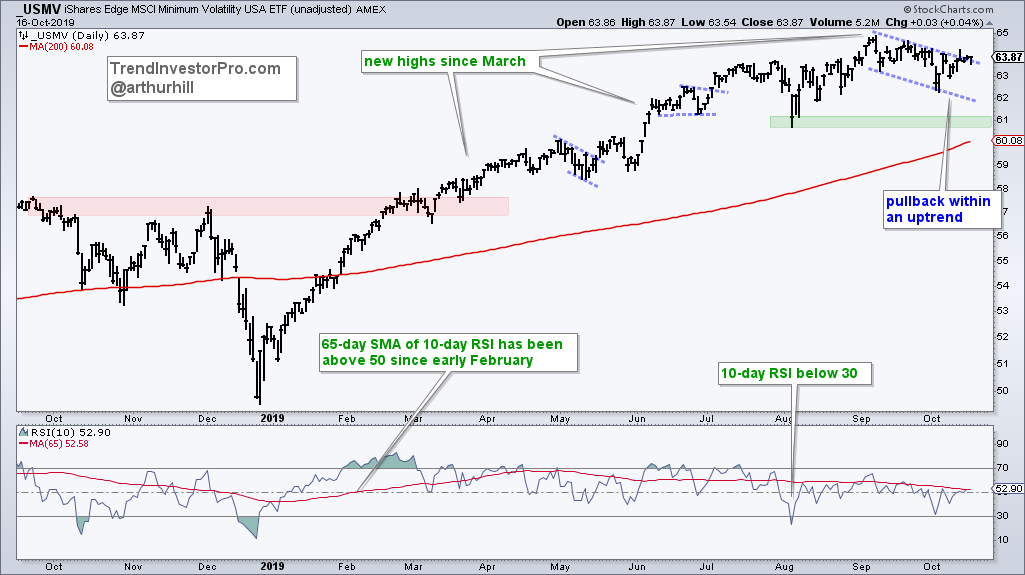
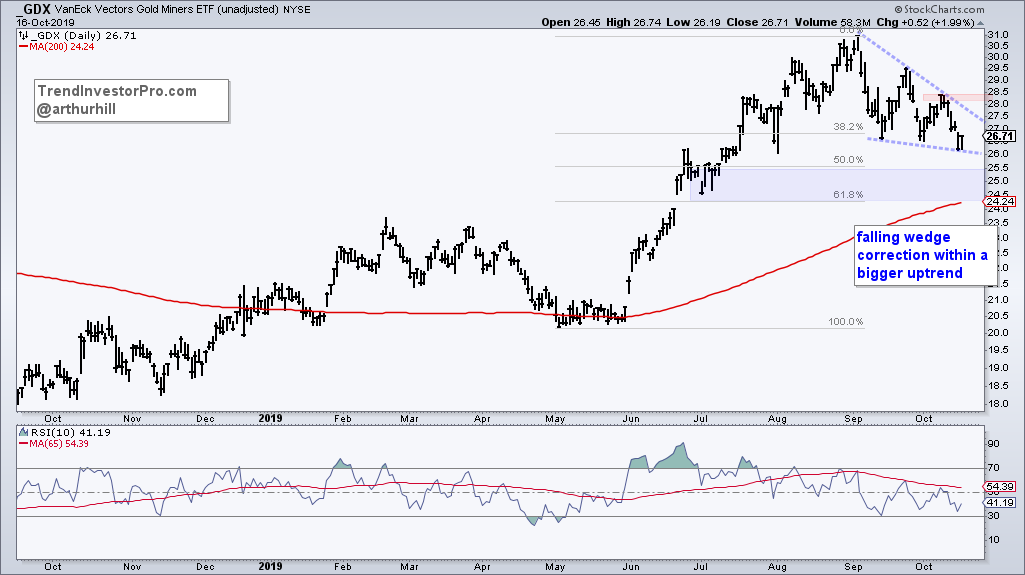
With 15 names, group 2 is the biggest right now. This group represents ETFs that were leading in September, but either consolidated or pulled back in September-October. They are still in uptrends and still near the top in terms of price performance. Thus, the pullbacks or consolidations are deemed corrections within a bigger uptrend. A continuation higher is expected at some point. ETFs with flat consolidations, such as IYR and USMV, are holding up better than ETFs with pullbacks, such as GDX and GLD.
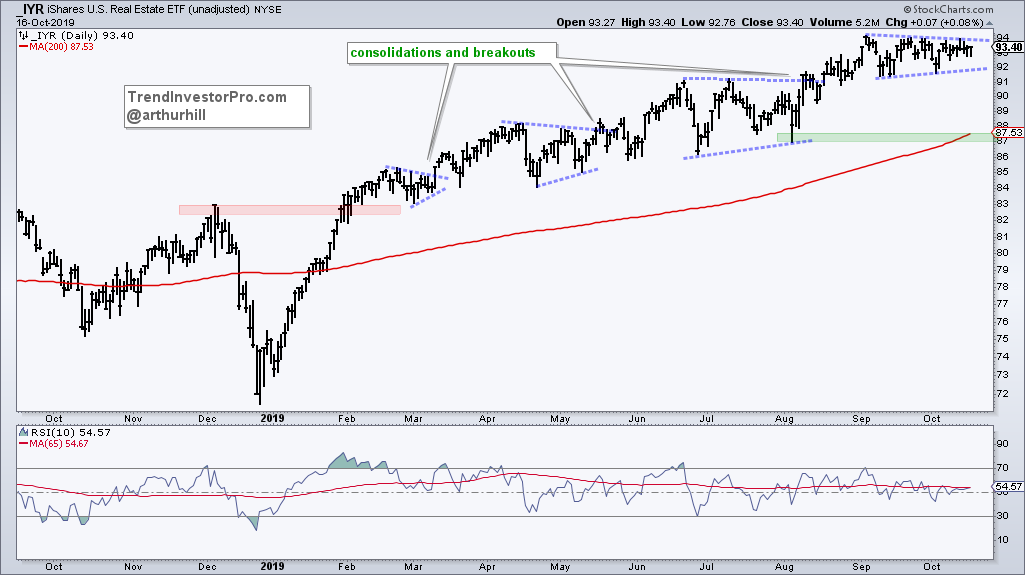
The first chart shows the REIT ETF (IYR) hitting new highs in early September and then forming a tight triangle. The advance since early February is littered with consolidations along the way and this is just one more. While a break below 91 would be short-term negative, it would not be enough to derail the overall uptrend. Key support is set at 87 for now.
The S&P 500 Minimum Volatility ETF (USMV) has a falling flag correction over the last five weeks.
The Aerospace & Defense ETF (ITA) fell pretty hard into early October, but RSI(10) dipped below 30 to become short-term oversold within a bigger uptrend. ITA is in the midst of an oversold bounce within a bigger uptrend.
The Gold Miners ETF (GDX) and Gold SPDR (GLD) sport deeper pullbacks than the first three. These two peaked on September 4th and fell the last six weeks. GDX formed a falling wedge and GLD formed a falling flag, both of which are considered bullish continuation patterns (corrections within a bigger uptrend). Notice that GLD held up a little better than GDX over the last few weeks because it formed a higher low this week. Mean-reversion players would be active now anticipating a breakout, while breakout players would be waiting for the breakout.
Bonds are a tough call right now because the 20+ Yr Treasury Bond ETF (TLT) is in a long-term uptrend and short-term downtrend after the recent down turn. After hitting a new high in early September, the ETF fell back to become oversold in mid September, got a big bounce into early October and then fell back over the last eight days. Overall, I view the price action since the early September high as some sort of corrective process within a bigger uptrend. A wedge, channel or even a triangle could evolve over the coming days or weeks.
Group 3: Uptrends and Bouncing off Consolidation Support
Many in this group were at a moment of truth and they passed the test. In particular, SPY, QQQ and four offensive sectors held above key support areas and broke short-term resistance levels. More importantly, these short-term breakouts are holding.
The first chart shows SPY successfully testing the August low in early October and breaking out with a surge the last six days. This little breakout and gap are holding with 292 marking the first level to watch for a short-term reversal. Overall, we have a higher low from August to October and equal highs in July and September. Adding a couple of lines, we can see an Ascending Triangle taking shape, which is a bullish continuation pattern. A break above the highs would signal a continuation higher and target a move to the 322 area. Traditionally, the height of the pattern (~20) is added to the breakout for a target. However, take targets with a grain (bucket) of salt.
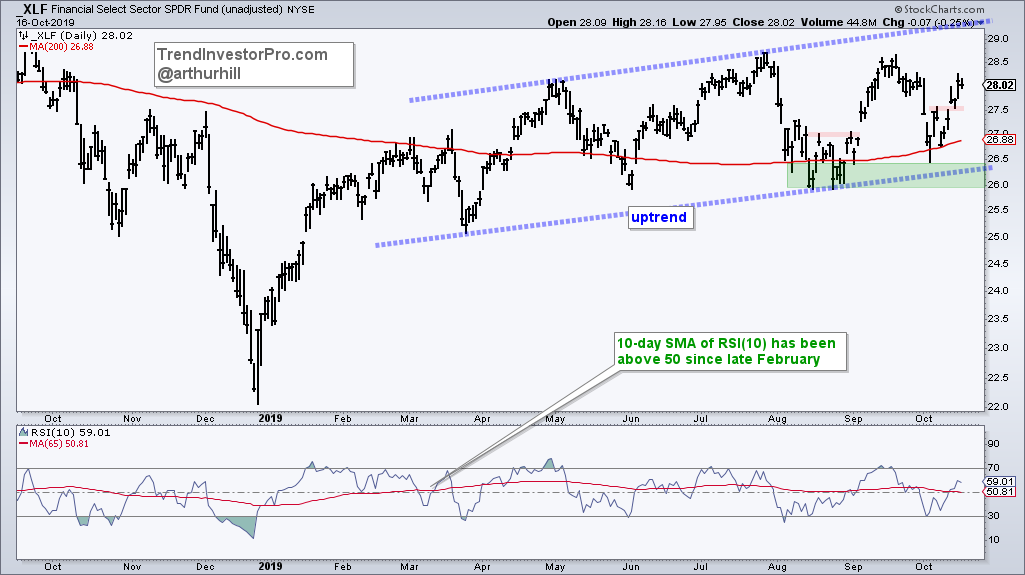
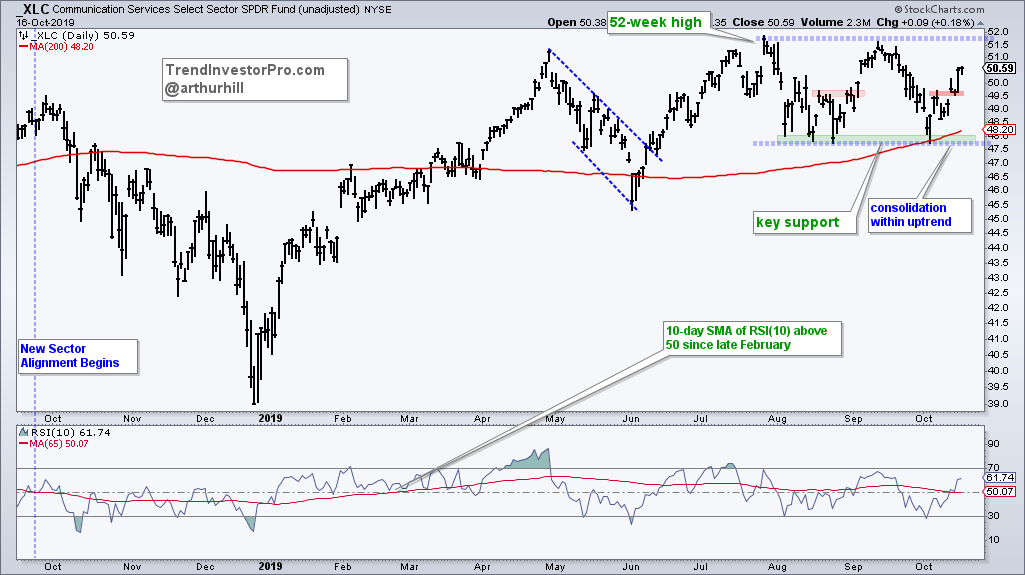
The Consumer Discretionary SPDR (XLY), Finance SPDR (XLF), Industrials SPDR (XLI) and Comm Services SPDR (XLC) are still in uptrends overall because they all held their August lows and broke short-term resistance (red lines). All four have consolidated the last few months with trading ranges of some sort, but there is still an upward bias at work since February. The August-October lows mark key support going forward. Last Friday’s gaps mark short-term support to watch for a failed breakout.
Group 4: Downtrends, but held above August Lows
BOTZ, XRT, KBE, KRE, REM, IEMG, EFA
There is a new group in town! These are ETFs that are still in downtrends overall, but held above their August lows in early October and are showing relative strength the last seven to eight weeks. ETFs in this group have been lagging for some time, but they could be poised to reverse their bigger downtrends.
The first chart shows the Retail SPDR (XRT) hitting a new low in August and then surging above the 200-day SMA in mid September. The break above the 200-day did not hold as the ETF fell back into early October. While SPY and IWM came close to their August lows, XRT held well above its August low and this showed relative strength. XRT broke out of a flag with a surge the last four days and this signals a continuation of the Aug-Sep advance.
The next chart shows the Robotics & Artificial Intelligence ETF (BOTZ) holding well above the August low in October and breaking out of a pennant. Overall, notice how the ETF reversed near the 61.8% retracement in August and moved back above the 200-day SMA recently. The big falling channel looks like a big correction after the December-April surge and a breakout is in the making.
The next chart shows the Core Emerging Markets ETF (IEMG), which charges a lower management fee than EEM. Yes, I know Vanguard charges even less. Maybe one day I will switch to Vanguard funds. In any case, IEMG surged in September, fell back into October and held well above the August low. The ETF broke out of a falling flag with surge the last five days and is poised to break out of a bigger falling channel.
Group 5: Relatively New Downtrends
FDN, FINX, HACK, SKYY, IGV, IPAY
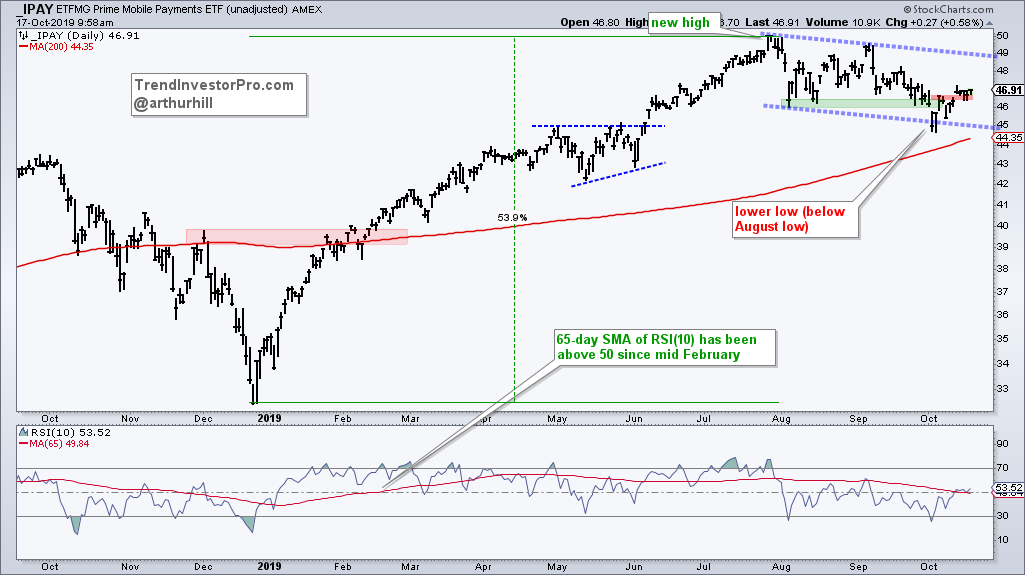
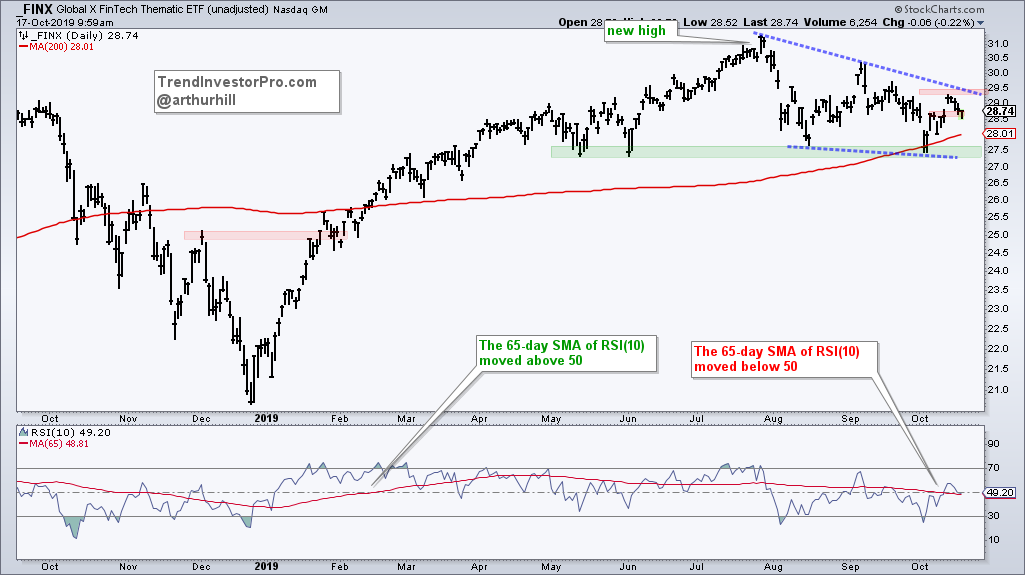
Who would have thought that the big tech-related ETFs would be in group five (sans semis). While I realized these are tempting plays and some have potentially bullish corrective patterns at work, the fact is they all formed lower highs from August to September and broke their August lows. They underperformed in September and led the way lower into October, which is why they are so far down the list. IGV, IPAY and FINX seem the best of this group because they are still above their rising 200-day SMAs.
The first chart shows the Mobile Payments ETF (IPAY) hitting a new high near 50 in July and then falling below 45 in early October. The break below the August low did not last long as the ETF quickly rebounded. Perhaps it was just an overshoot and perhaps this is a correction after the 54% advance before it. It is encouraging that IPAY broke above the 7-Oct high and this breakout is largely holding. A close below 46 would negate this short-term breakout and call for a re-evaluation.
The next charts show the FinTech ETF (FINX) and Software ETF (IGV) with falling wedge patterns since late July. IGV broke above the upper line and then fell back hard on Wednesday. A follow through breakout at 200 is needed to complete the reversal. FINX has yet to break out of its wedge formation and needs to close above 29.5 to break the wedge line.
Group 6: Multi-month Downtrends or Ranges
MDY, IWM, IJR, XLV
The ETFs in group 6 are pretty much trendless. The chart below shows the Russell 2000 ETF (IWM), S&P SmallCap 600 SPDR (IJR) and S&P MidCap 400 SPDR (MDY) trading within ranges for several months now. IWM tested its August low in early October, while MDY and IJR held just above their August lows. All three broke short-term resistance with upturns the last four days. These upturns simply represent short-term uptrends within trading ranges. Keep in mind that ETFs in trading ranges for several months are lagging groups 1, 2 and 3.
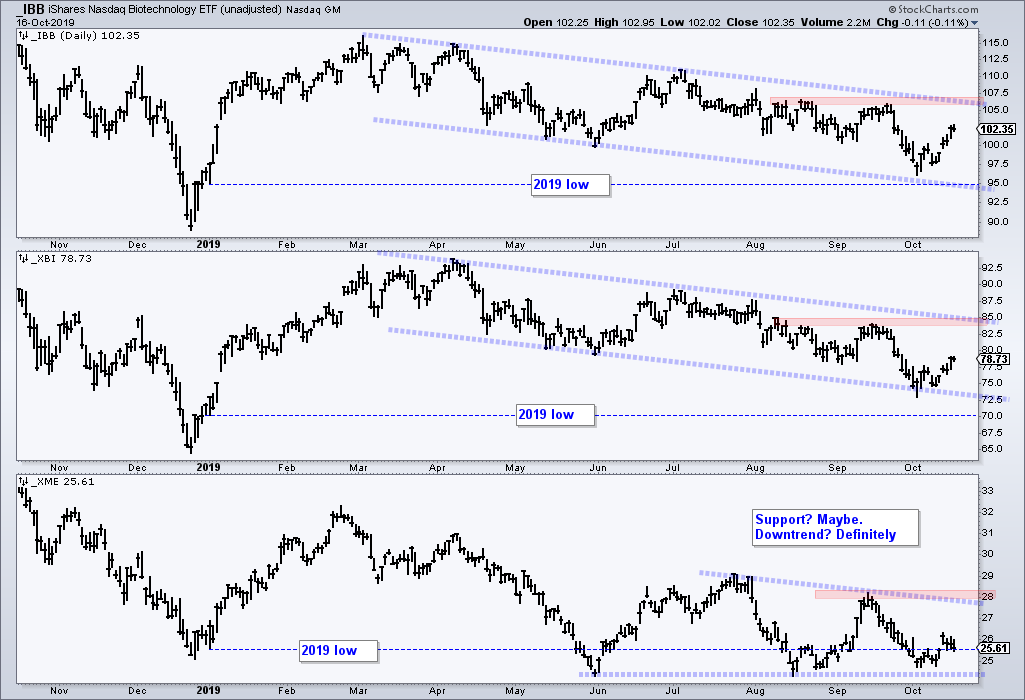
The Biotech ETF (IBB) and Biotech SPDR (XBI) are up rather sharply in October, but they are still in downtrends overall. The blue trendlines define this downtrend with lower lows and lower highs. The October bounce started from a lower low and prices remain well below resistance. At this stage, I want to see breakouts and trend reversals before putting these biotech ETFs on my watchlist for pullbacks.
Bottom Line
It will be interesting to see if the shift from defensive groups to the lagging offensive groups can continue. So far, the Utilities, Staples and REIT ETFs are undergoing mild pullbacks or consolidations within their bigger uptrends. Retail, Regional Bank and Emerging Markets ETFs are showing signs of life since August and trying to turn the corner.
Overall, I remain most impressed with the Technology, Housing and Semiconductor ETFs. It is pretty much impossible to have a bear market when these three are leading. Even with these offensive oriented groups leading, we are still seeing an appetite for yield because the Preferred Stock ETF and Dividend Appreciation ETF are also leading.
")