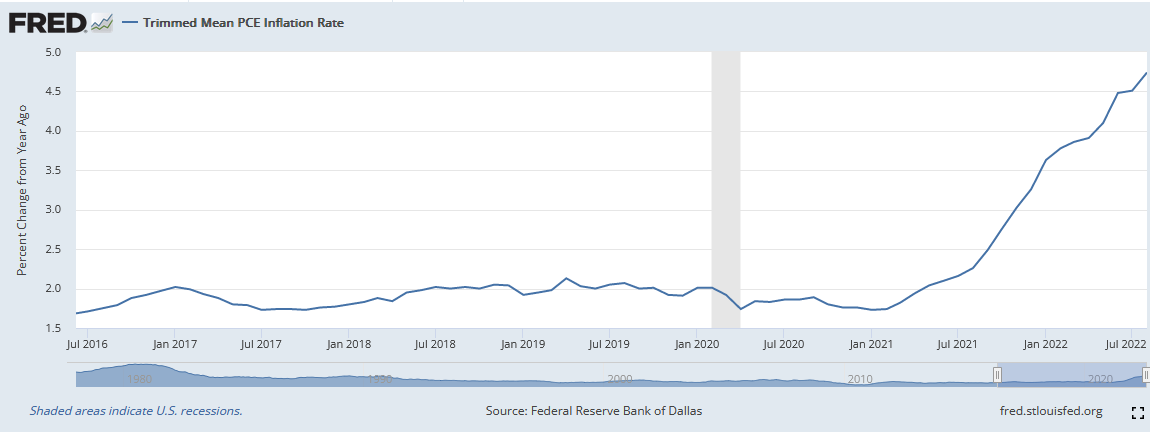
The S&P 500 SPDR (SPY) is up around 7% the last two weeks and we are starting to see short-term overbought indications. Overbought, keep in mind, is a double-edged sword. Overbought suggests that the advance is getting over extended and the bigger downtrend could take over soon, but it also takes strong buying pressure to become overbought. In addition, overbought conditions can extend, as they did from mid July to mid August. We are still in a bear market overall, but the current price swing is up and there are some bullish seasonal patterns at work. The bear market forces are pushing down, while the price swing and seasonal patterns are pushing up. No wonder price action has been choppy in October. Throw in earnings season and an inflation-related data release on Friday, and we have a recipe for more volatility in stocks, bonds and the Dollar.
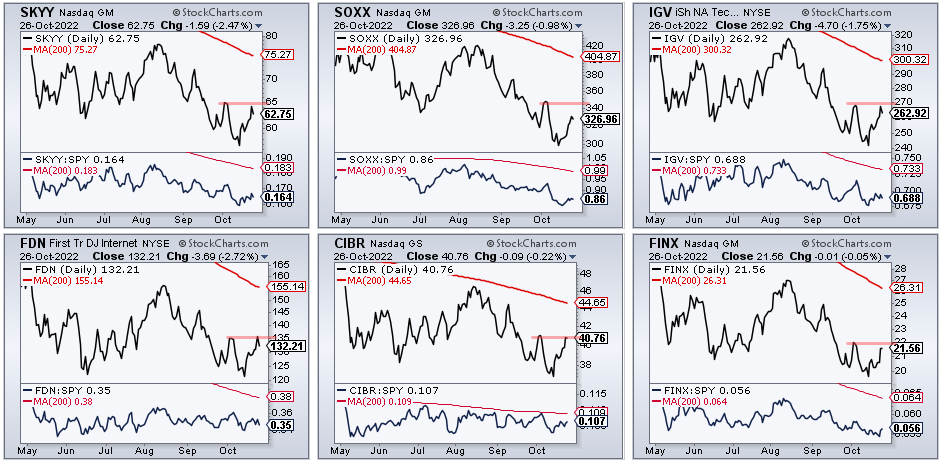
It is worth noting that most tech-Related ETFs continue to lag and technology is still the biggest sector in the S&P 500 (26.6%). The CandleGlance charts below show six tech ETFs hitting new lows in mid October (leading lower) and still below their early October highs. The indicator windows show the price relative (e.g. SKYY:SPY ratio). All are below their falling 200-day SMAs, which means these ETFs are underperforming SPY. Relative weakness in tech is weighing on the S&P 500.
About the ETF Trends, Patterns and Setups Report
This report contains discretionary chart analysis based on my interpretation of the price charts. This is different from the fully systematic approach in the Trend Composite strategy series. In this ETF Trends, Patterns and Setups report, I am looking for leading uptrends and tradable setups within these uptrends. While I use indicators to help define the trend and identify oversold conditions within uptrends, the assessments are mostly based on price action and the price chart (higher highs, higher lows, patterns in play). Sometimes the chart assessment can be at odds with the indicators.
This Week's Commentary Schedule
Tuesday – 25 October: Market-ETF Report and Signal-Rank Table Update
Wednesday – 26 October Market-ETF Video and Market Regime Update
Thursday – 27 October: Market-ETF Report and Signal-Rank Table Update
Saturday – 29 October: ETF Signal and Rank Table
The Momentum Composite aggregates signals in five momentum-type indicators to identify short-term overbought and oversold conditions. This indicator is part of the TIP Indicator Edge Plugin for StockCharts ACP
Medium-term and Short-term Seasonal Patterns
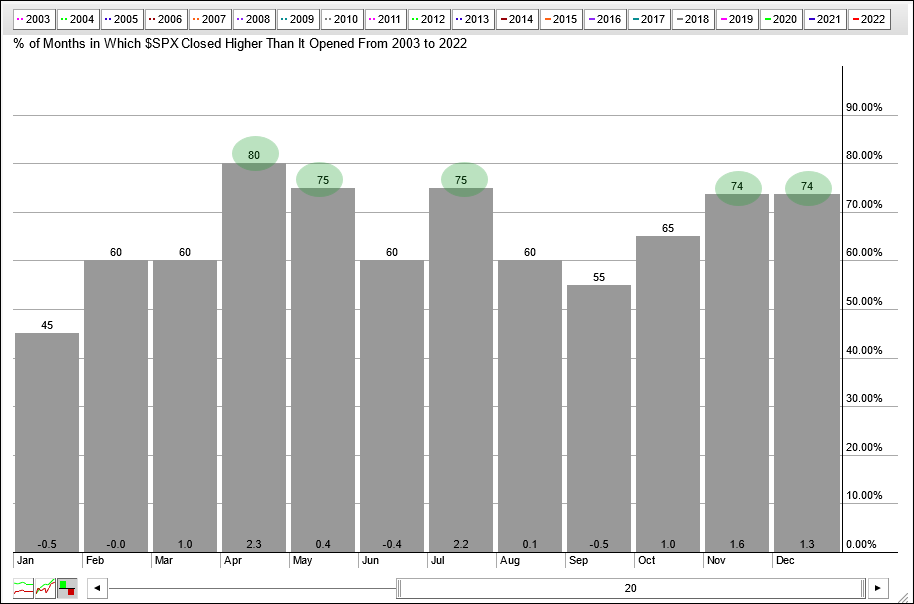
There are some seasonal tendencies in play over the next two weeks and over the next two months. Most of us are aware of the bullish seasonal patterns for yearend (October, November and December). I am also aware, but prefer to put more emphasis on the bear market environment.
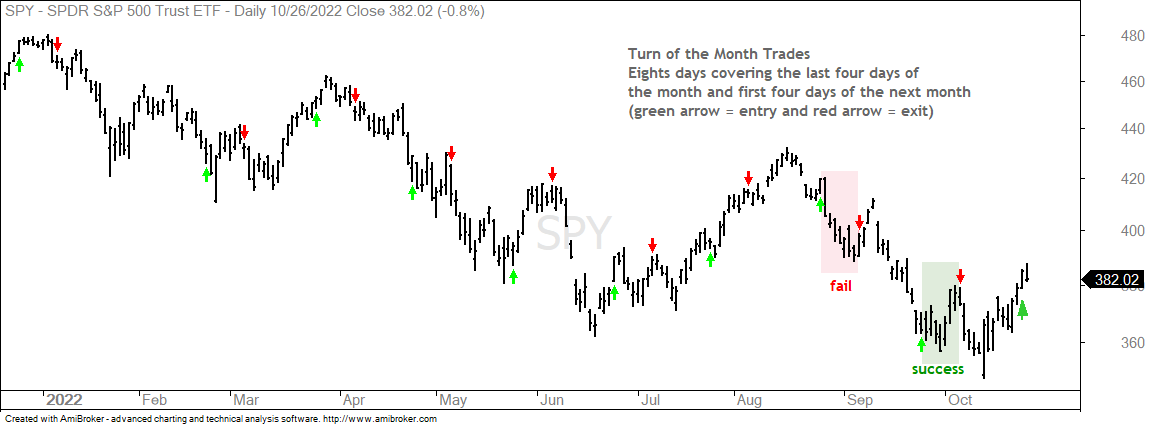
The turn of the month also shows a positive tendency. This period covers eight days: the close five trading days before the end of the month and the close on the fourth trading day of the next month. Most recently, this was from the September 26th close to the October 6th close (he eight trading days were September 27th, 28th, 29th and 30th, and October 3rd, 4th, 5th and 6th). The chart below shows some of the more recent signals.
Since 2000, SPY advanced 67.6% of the time during this eight day period and the average gain is 2.18%. This also means SPY fell 31.4% of the time during this eight day period and the average loss was 2.25%. Even though the average gain and loss are pretty much equal, the system is profitable over the long run because of the relatively high win rate (67.6%). 2022 performance is a little different with 4 winners and 5 losers (44.44% win rate). The average gain was 3.07% and the average loss was 2.44%. Thus far in 2022, the chance of a gain during this eight day period is less than 50%.
You can learn more about exit strategies in this post, which includes a video and charting options for everyone.
Channeling the April-June Decline (SPY)
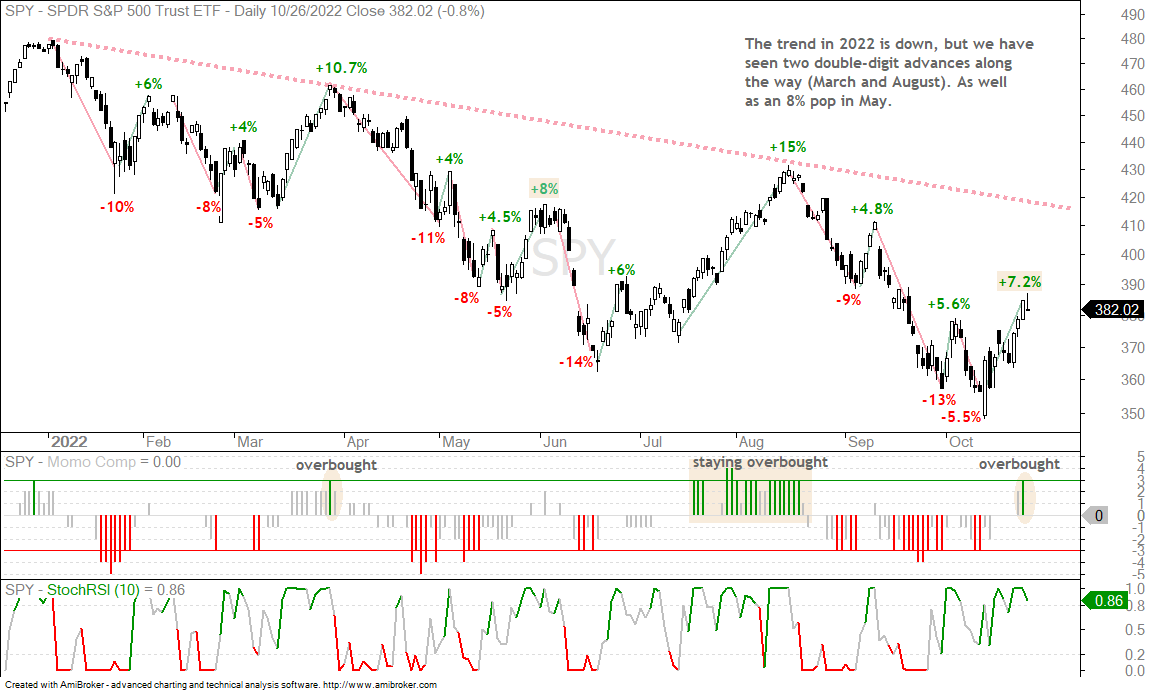
The next chart shows SPY with some of the bigger price swings this year. Using closing prices, there have been over a dozen price swings of at least 5% this year. The overall trend in 2022 is clearly down, but we have also seen two double-digit advances along the way. The most recent upswing was around 7.2% and this created a short-term overbought condition. There are also some parallels with swings during the April-June decline (-11%, +4%, -8%, +4.5%, -5% and +8%). The decline since mid August also has six swings: -9%, +4.8%, -13%, +5.6%, -5.5% and +7.2%). The last upswing into early June was 8% and the current upswing is around 7.2% (yellow shading).
The indicator window shows the Momentum Composite becoming overbought with a reading of +3 (yellow shading). The indicator did not become overbought in early June, but the June decline was quite dramatic. At this stage. SPY is overbought and has yet to reverse. The bottom indicator window shows StochRSI and a move below .20 would show a momentum downthrust. This would be short-term bearish and could jump start the next leg lower, though I am not sure if one could make money with such a signal because volatility is running high and counter-trend bounces are sharp.
The Trend Composite aggregates signals in five trend indicators: Bollinger Bands (125,1), Keltner Channels (125,2), 5-day Rate-of-Change of 125-day SMA, StochClose (125,5) and CCI-Close (125). The Trend Composite and ten other indicators are part of the TIP Indicator Edge Plugin for StockCharts ACP
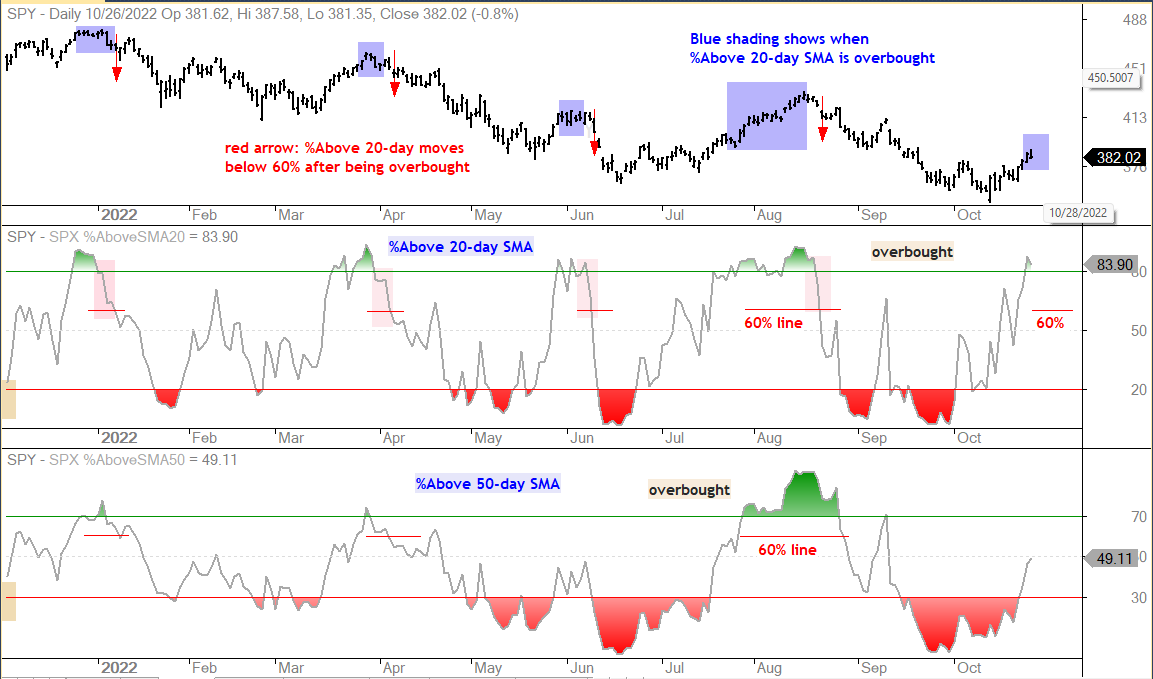
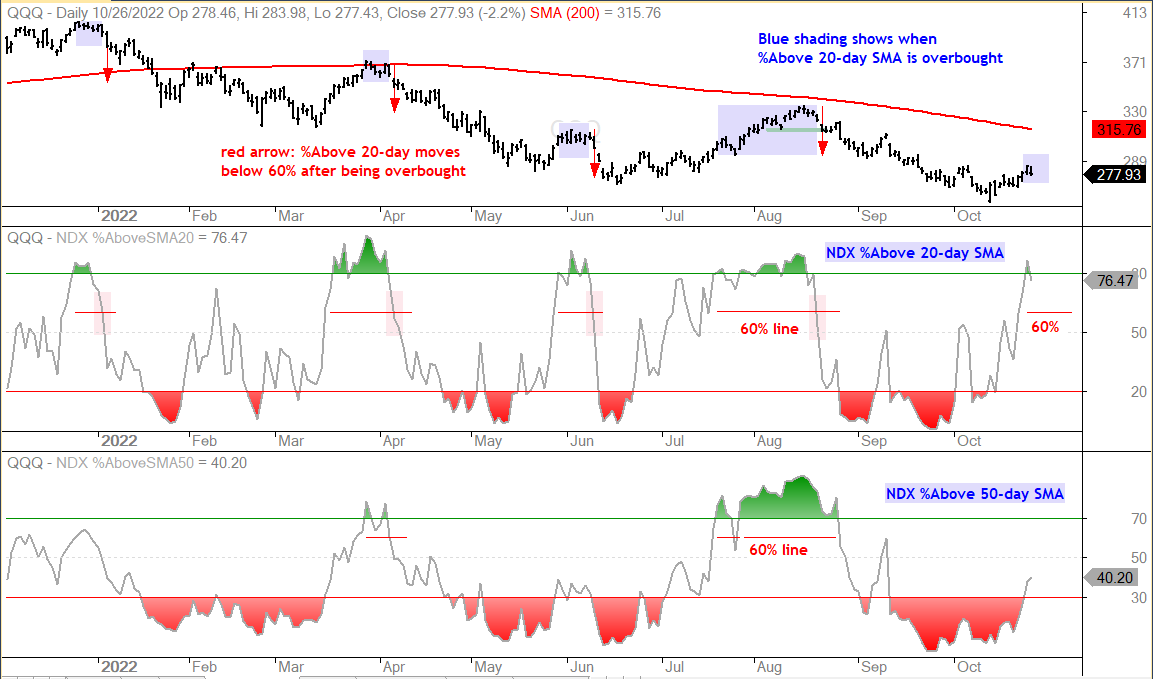
%Above 20-day SMA Indicators Overbought (SPY, QQQ)
The next chart shows the SPX %Above 20-day SMA becoming overbought with a move above 80% on Tuesday (middle window). This indicator became overbought in late December, late March, late May, mid July and now late October. The blue shading on the price chart shows these periods as well. SPY can become overbought and remain overbought, such as the period from mid July to mid August. Sometimes overbought conditions last a week or two and then we see a move below 60%, which ends overbought conditions and signals a downturn. These signals are marked with the red arrows on the price chart. As with StochRSI signals, they can lag a bit because a downturn is required for a trigger. The second chart shows the NDX %Above 20-day SMA with similar characteristics.
You can learn more about my chart strategy in this article covering the different timeframes, chart settings, StochClose, RSI and StochRSI.
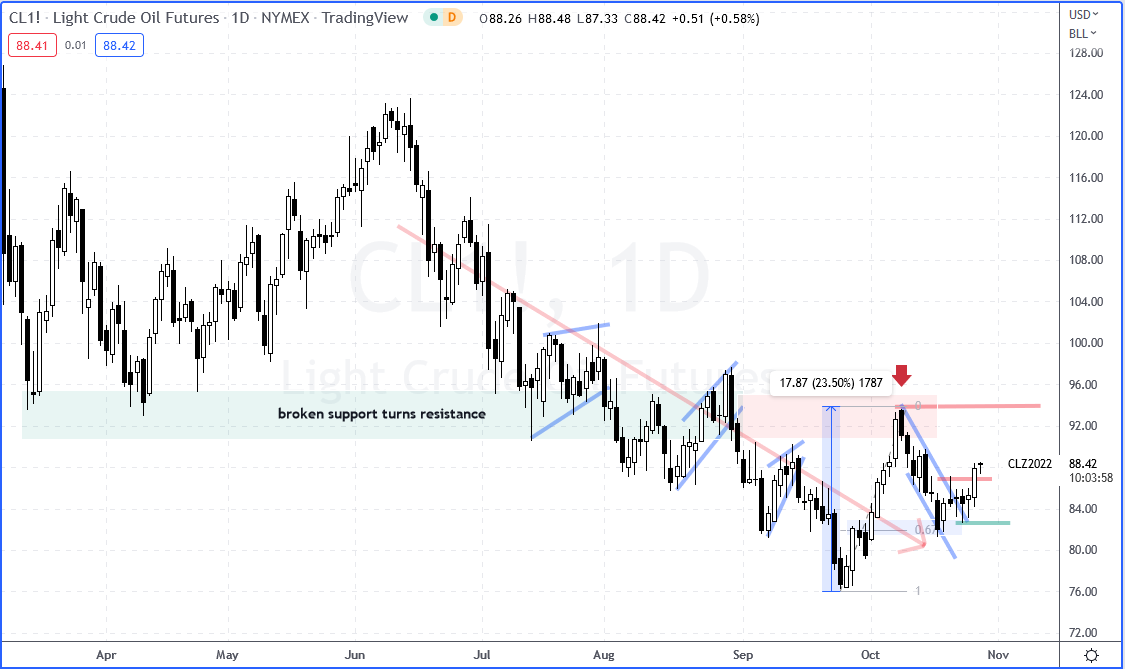
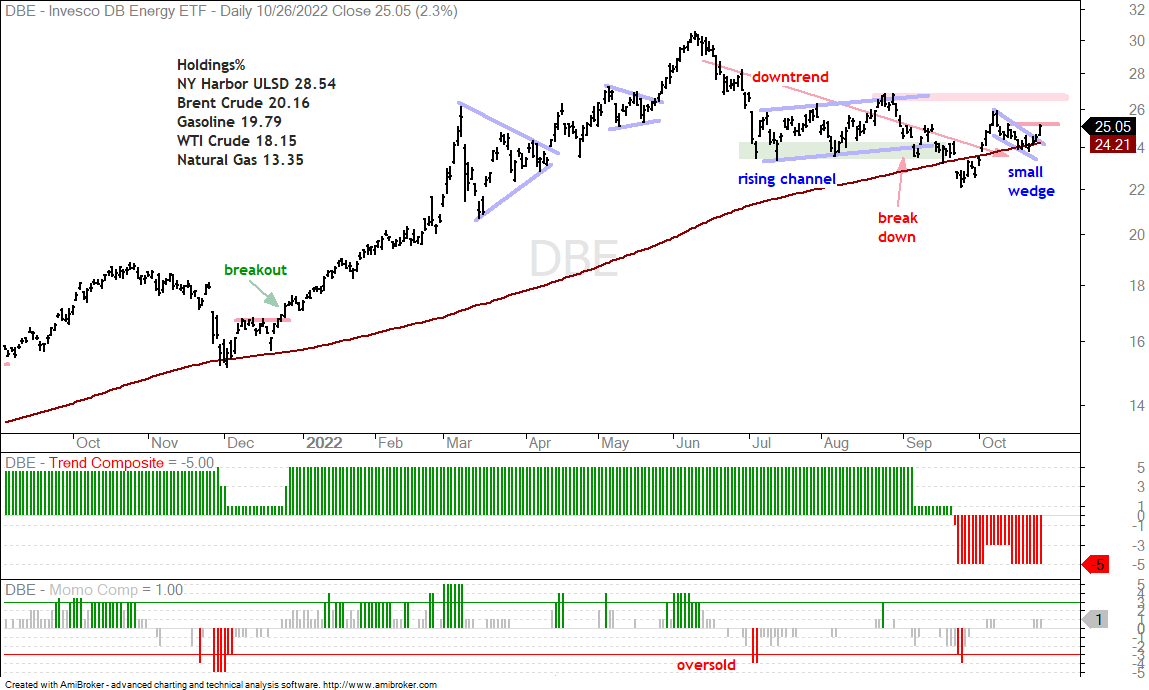
Oil Surges for Short-term Breakout (CL1!, DBE)
Light Crude Futures (CL1!) surged 3% on Wednesday and broke short-term resistance. Oil advanced over 20% into early October and then retraced around 2/3 of this advance with a decline back to the short-term breakout zone (blue shading). The amount and return to the prior breakout are normal for pullbacks within uptrend. Even though the trend since summer is down (red arrow-line), the short-term setup and breakout are bullish. The late October lows mark first support and a close below 82.5 would argue for a re-evaluation.
The next chart shows the DB Energy ETF (DBE) surging above the upper line of a small falling wedge. The trend since summer is also down, but there is a short-term breakout working as the ETF bounces off the rising 200-day SMA.
Here is an article from Reuters on copper stocks at the LME. This article shows just how foolhardy and confusing it can be to quantify the fundamentals.
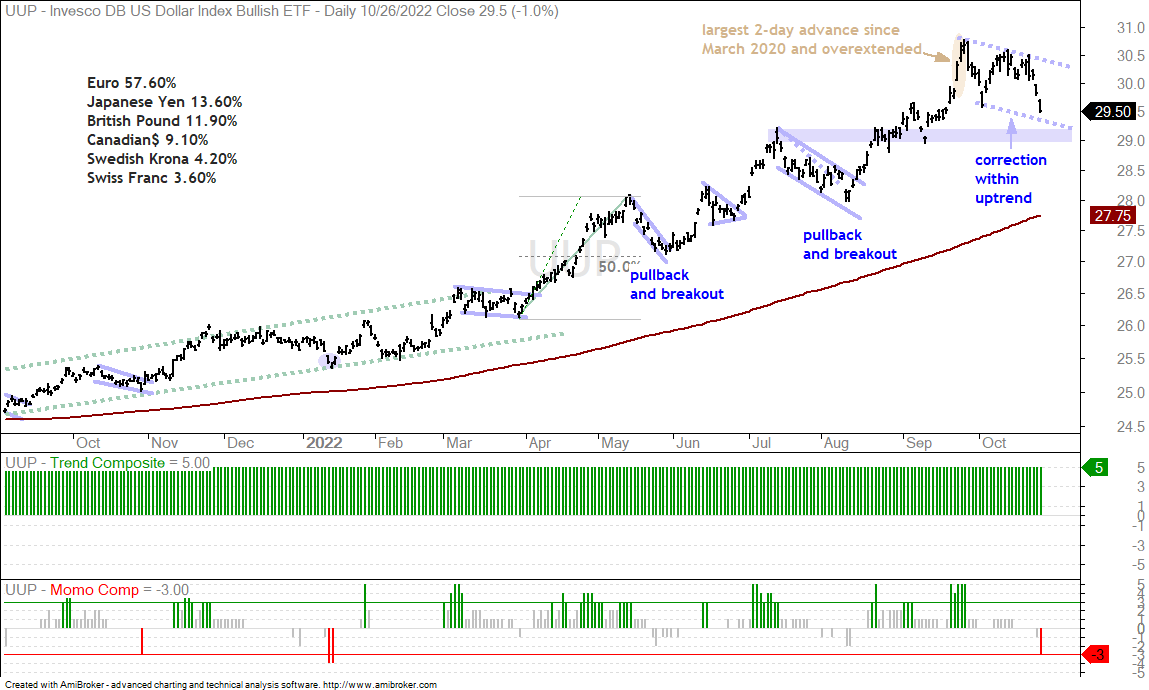
Dollar Becomes Oversold near Support (UUP)
The Dollar Bullish ETF (UUP) fell sharply the last four days and this pushed the Momentum Composite to oversold levels (-3 or lower) for the third time in 13 months (red bars in bottom indicator window). The long-term trend is clearly up because UUP hit a new high a month ago. As such, I view this as a correction within the bigger uptrend. With UUP oversold and near support, chartists should watch for signs of firming and a possible bounce in the coming days.
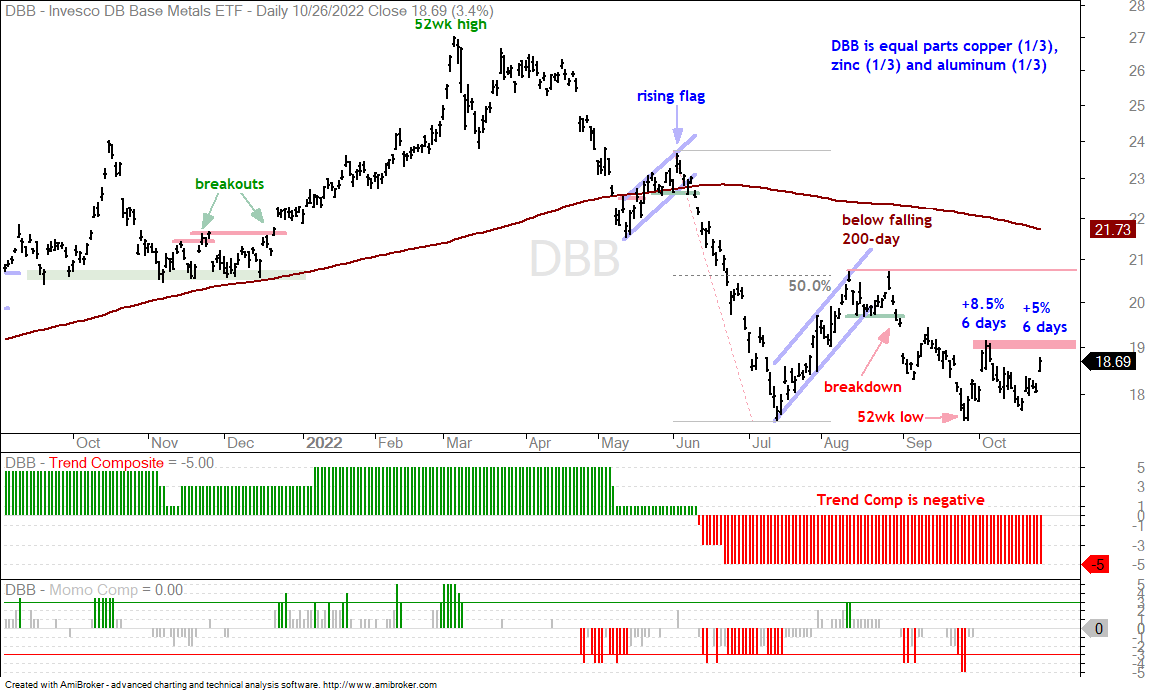
DB Base Metals ETF Surges within Downtrend (DBB)
In a possibly related move, industrial metals surged on Wednesday and the DB Base Metals ETF (DBB) is up 5% over the last six days. UUP is down 2% during this period. Note that UUP is up .50% in early trading on Thursday. This is an impressive bounce for DBB, but it is still within the context of a bigger downtrend. Bottom pickers will note that the ETF successfully tested the July low and a Double Bottom is taking shape. It is still quite early to call for a double bottom because a break above the August highs is needed to confirm the Double Bottom. At the very least, DBB needs to break the early October high to show follow through and an increase in buying pressure.
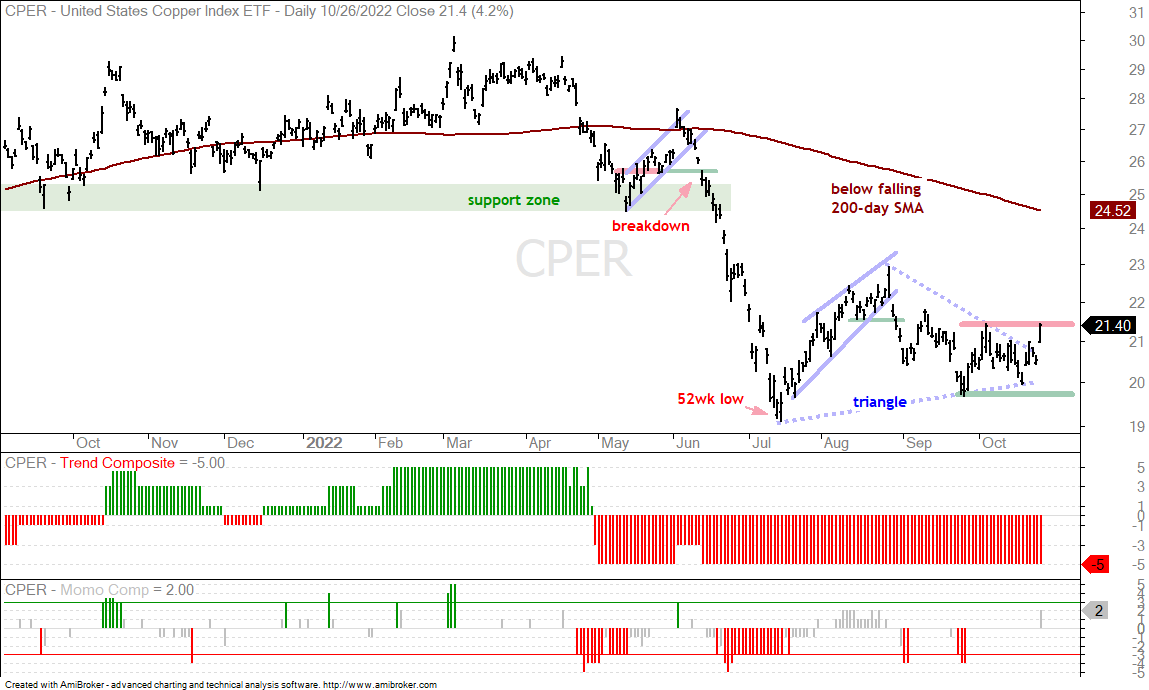
Copper Leads the Charge (CPER, COPX)
DBB is equal parts Aluminum (AL1!), Zinc (ZINC1!) and Copper (COPPER1!). Aluminum was up 5.6% on Wednesday, while Copper gained 2% and Zinc was up 1.25%. The next chart shows the Copper ETF (CPER) surging 4.2% and challenging the early October high. Copper held above its July low in September and a triangle formed over the last few months. These are typically continuation patterns and the prior decline from April to July makes it a bearish continuation pattern. Sometimes, just sometimes, triangles break the other way and turn into reversal patterns. Follow through with a close above 21.5 would trigger a short-term breakout. Keep in mind that this is a bottom picking play and risk of failure is above average because we are in a global bear market.
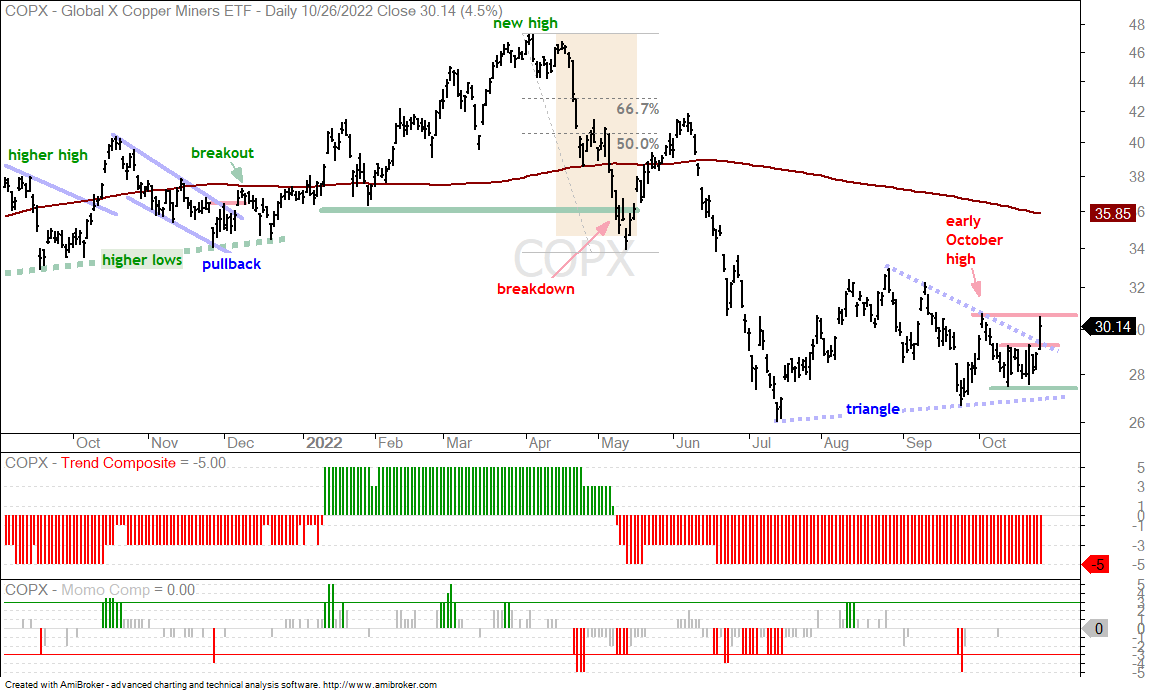
The Copper Miners ETF (COPX) surged along with copper and broke the triangle line. The early October high marks the second red resistance line and this jibes with resistance set on copper. Both need to break their early October highs to start the trend reversal process. Technically, a new uptrend would not signal until there is a higher high (above the August high).
")