Today’s commentary covers gold, silver, bonds, the 10-yr yield and the bank ETFs. The Gold SPDR is just below a key resistance level as the Silver ETF swings lower. The 20+ Yr Treasury Bond ETF retraced around half of its decline and the 10-yr yield remains in a clear downtrend. I will show the key level to watch because a breakout in the 10-yr yield could be bullish for the bank ETFs, KRE and KBE.
Gold hits Make or Break Level
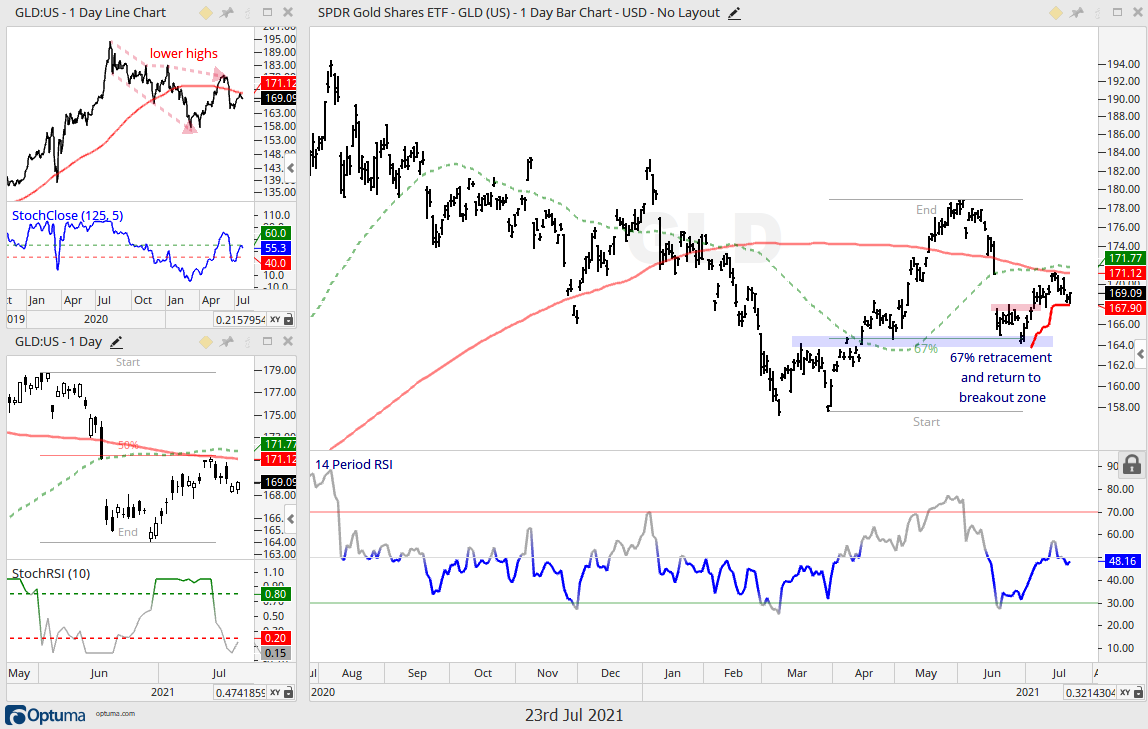
The Gold SPDR (GLD) bounced in July and hit a make or break resistance zone. Overall, the long-term trend is down for GLD. Price is below the 200-day, the 200-day is falling and StochClose is bearish. Price is also moving from the upper left to the lower right of the chart. Shorter term, GLD bounced off the 67% retracement line and broken resistance in July (blue zone) and this bounce is largely holding. The short red line marks the ATR Trailing Stop for this short-term breakout. Long-term, the 50-day SMA (green dashed line) and 200-day SMA mark resistance in the 171-172 area. GLD needs a follow through breakout here to suggest that a bigger trend change is afoot.
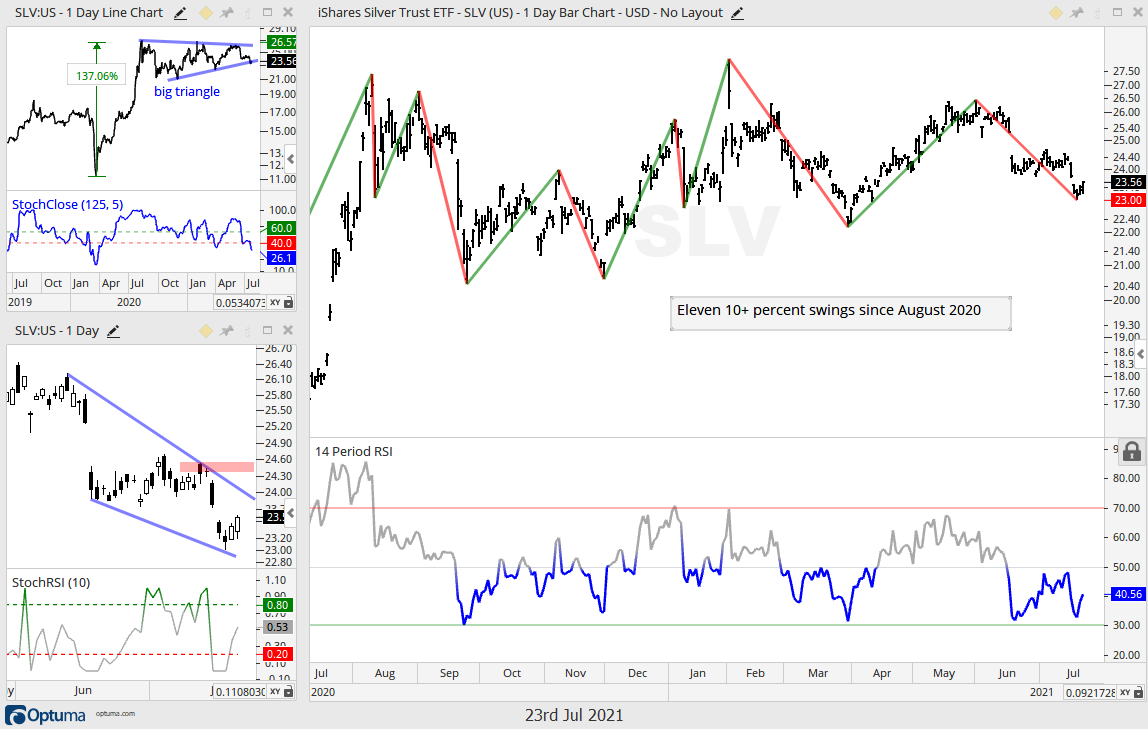
GLD is struggling and the Silver ETF (SLV) chart is a mess. I took off the 50 and 200 day SMAs because moving averages are of little value in trading ranges. The red/green lines on the bar chart show eleven swings that were 10 percent or more since August 2020. That averages out to almost one 10 percent swing per month. The current swing is down and SLV is just below the lower trendline of the big triangle on the line chart (upper left). The candlestick chart defines this downswing and a break above 24.60 would trigger a short-term reversal.
TLT Exceeds 200-day as 10-yr Yield Battles 200-day
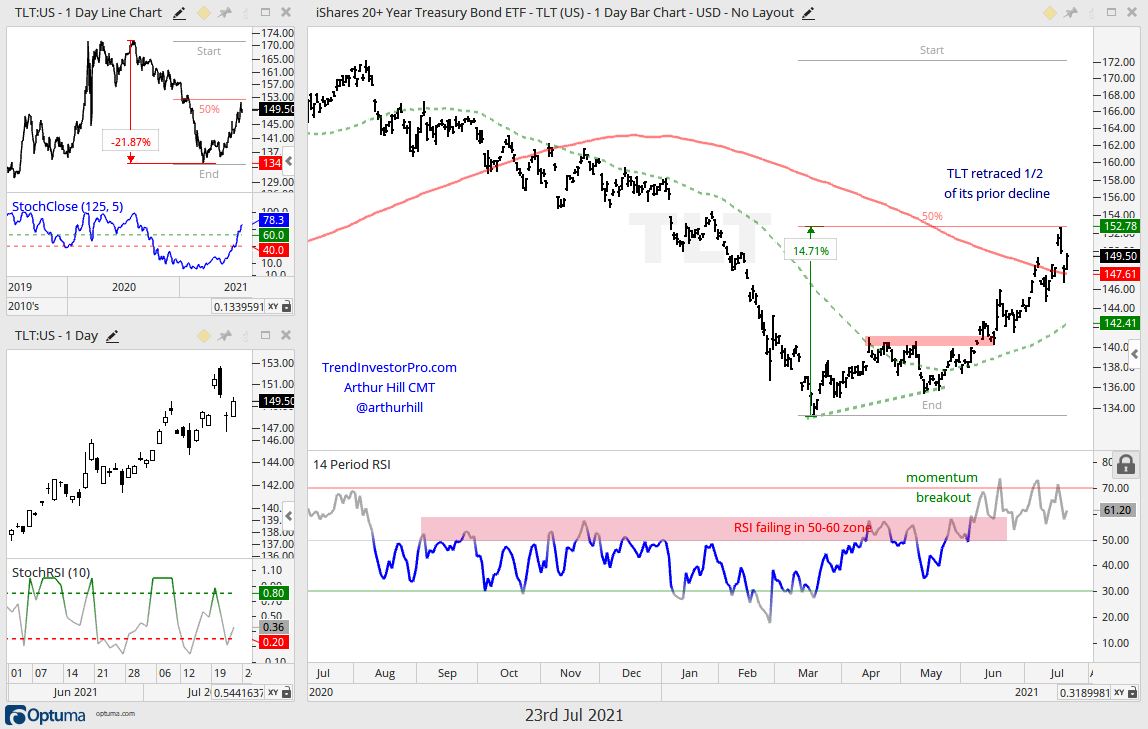
The 20+ Yr Treasury Bond ETF (TLT) is on a tear with a double digit advance off the March low. TLT broke above its 200-day SMA this month and StochClose moved above 60 to trigger bullish. StochClose is a trend following indicator and this means most signals occur after significant price moves. TLT is definitely extended right now, but still strong, despite Tuesday’s outside reversal and Wednesday’s down gap (see candlestick chart).
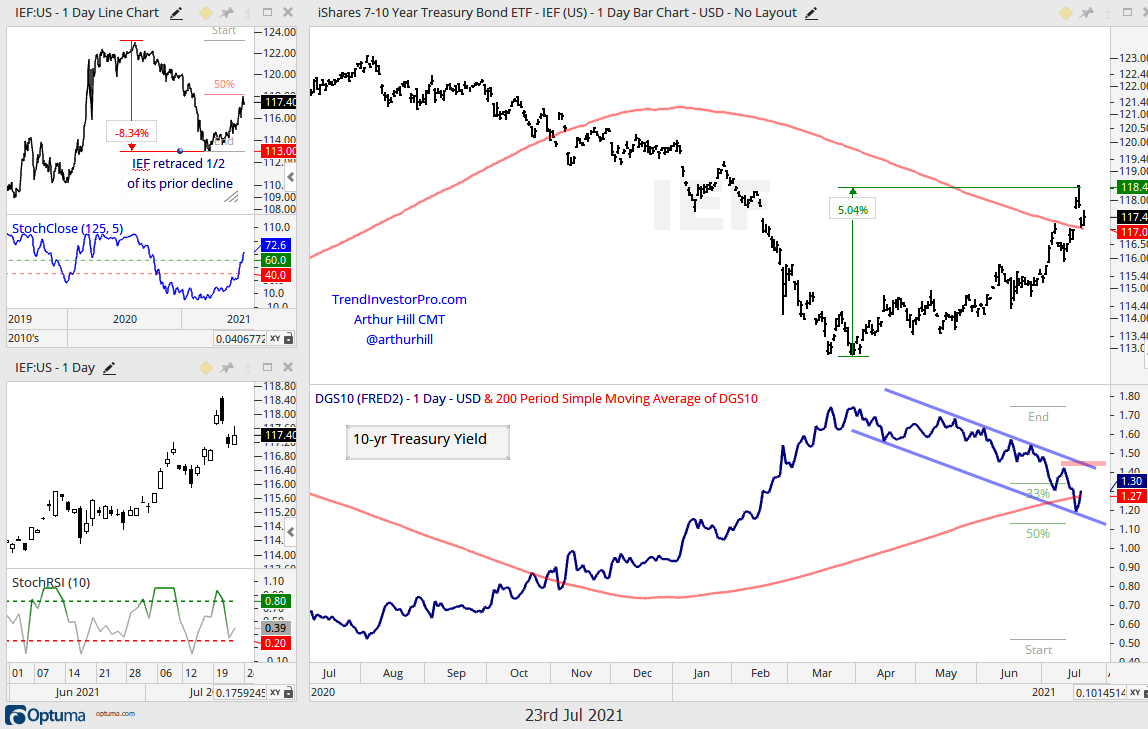
The next chart shows the 7-10 Yr Treasury Bond ETF (IEF) in the top window and the 10-yr yield in the lower window. I don’t have a great read on TLT and IEF, but I do have a key level to watch for the 10-yr Yield. The yield moved from .50% to 1.7% from August 2020 to March 2021. The yield then fell to the 1.20% area and retraced almost half of the prior rise. The trend is down for yields with the falling channel defining this downtrend. A break above 1.45% would reverse the downtrend in yields and argue for a continuation of the August-March advance. This would be bearish for bonds.
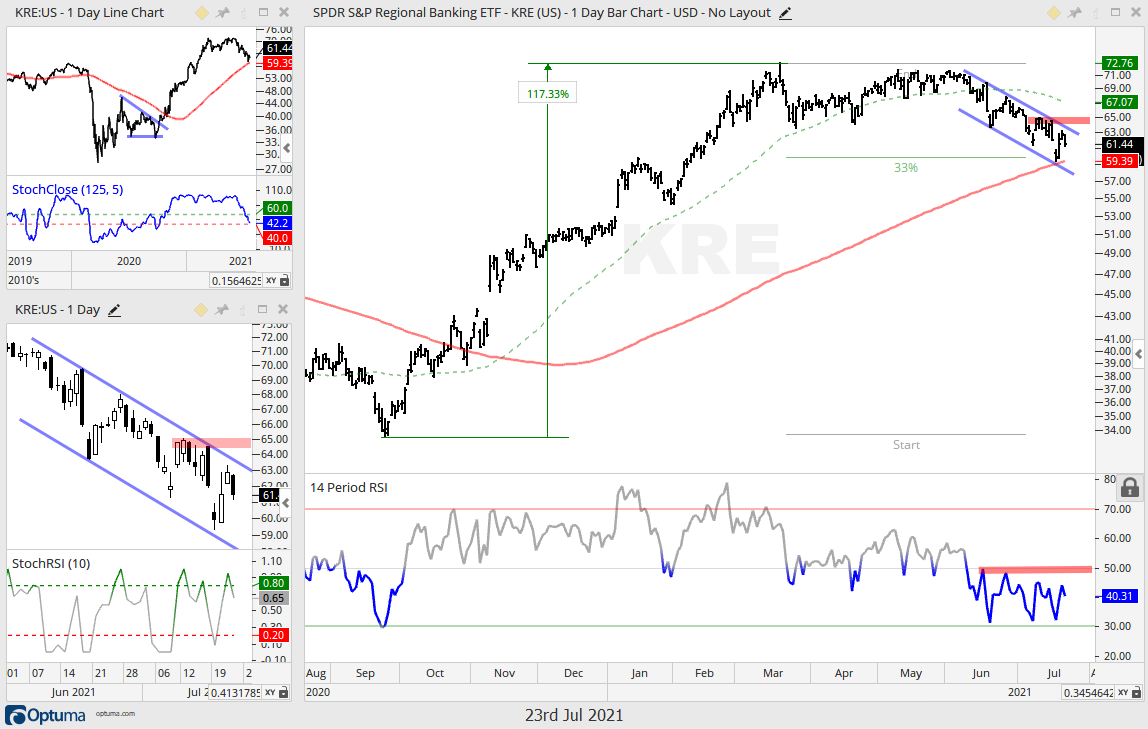
Bank ETFs Follow the 10-yr Yield Lower
Correlation does not always mean causation, but there is no denying the positive correlation between the 10-yr yield and the Regional Bank ETF (KRE). Both advanced from September to March and declined from March to July. As such a breakout in the 10-yr yield could be bullish for banks. In a separate, but possible related note, I covered the surge in Reverse REPOs and plunge in the Treasury’s General Account in the market regime update.
The chart shows KRE with a market leading surge of 117%. The ETF then traded sideways for a few months and moved lower the last five weeks. KRE tested the rising 200-day SMA as it retraced around a 1/3 of this advance. A return to the 200-day and 1/3 retracement are normal for corrections within bigger uptrends. I am marking resistance at 65 and a breakout here would provide the first sign that the correction is ending. The indicator window shows RSI gyrating between 30 and 50 since mid June. A break above 50ish would put RSI in the upper half of its range and be bullish for momentum. The second chart shows the Bank SPDR (KBE) with similar characteristics.
")