Breadth not Ideal, but Net Bullish – Homebuilder Breakout could Bode well for 2026
- Arthur Hill, CMT
")
Welcome to the Chart Fix!
Market breadth is not very strong, but it is strong enough to support a bull market. At the very least, key breadth metrics are not net bearish. Today’s Chart Fix shows how to quantify signals using new highs, new lows and the percentage of stocks with golden crosses. We then dissect the breakout in the Homebuilders ETF, which could hold the key to broadening leadership in 2026.
- New Highs Fail to Inspire, but Outpace New Lows
- Percent of Stocks with Golden Cross Stays Bullish
- Homebuilders ETF Breaks Out – Now What?
Recent Reports and Videos at TrendInvestorPro
- Small-caps Lead, Space Sets Up, Telecom Breakout
- Stock Setups: First Solar, Quanta and Arista Networks
- Copper and Base Metals Set Up Bullish
- Breadth Supports the Bull Market (%Above 200-day)
- Click here to take a trial and gain full access.
New Highs Fail to Inspire, but Outpace New Lows
Breadth is not what is was in 2024, but it is still net bullish. Chartists can measure internal strength using 52-week highs and lows. Stocks making 52-week highs are in strong uptrends and leading the market. Stocks recording 52-week lows are in strong downtrends and weighing on the market. The middle window in the chart below shows new highs and lows in the S&P 500. New highs exceeded 50 just twice since the April lift off (July 23rd and September 30th). 50 is ten percent of 500. This is uninspiring, considering that new highs exceeded this 10% threshold dozens of times during the 2024 advance. This was a bull run that lifted most stocks. In contrast, the current bull run is more selective.
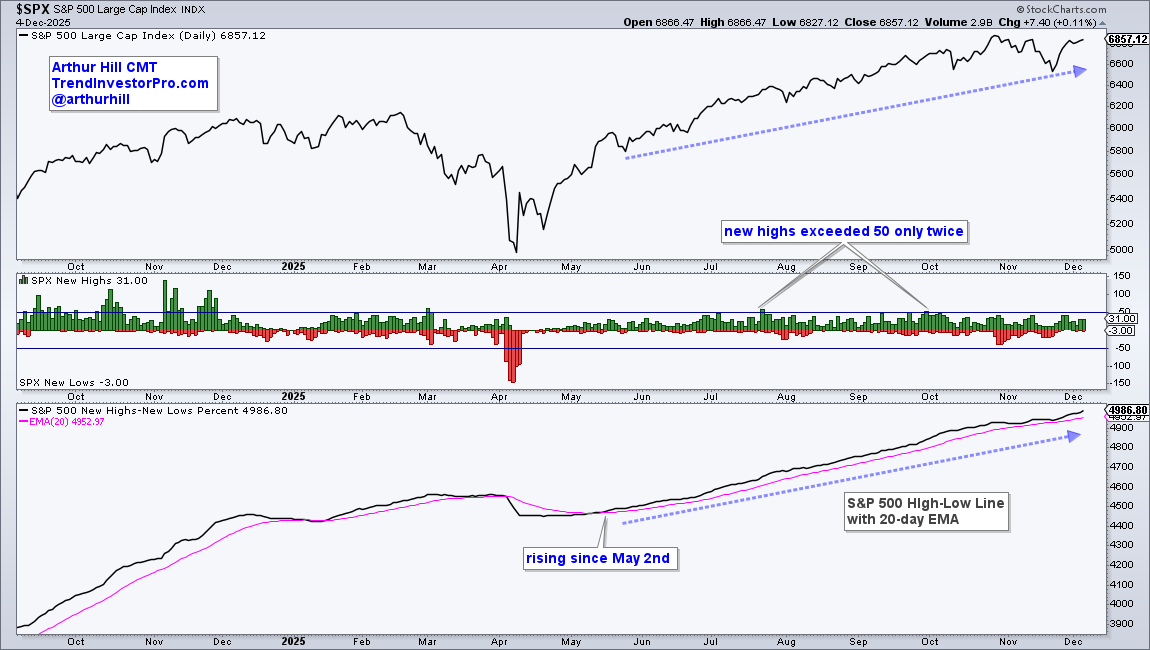
Even though new highs are uninspiring, new highs are still outpacing new lows. This matters. The bottom window shows the High-Low Line, which is a cumulative measure of net new highs (new highs less new lows). This line rises as long as new highs outnumber new lows, which is net bullish for stocks. The S&P 500 High-Low Line turned up in early May and remains above its 20-day EMA (rising). Watch this line for signs of weakness within the S&P 500. A move below the 20-day EMA would mean new lows are expanding and this would be negative.
Looking for indicators with an edge? Check out the TIP Indicator-Edge Plugin for StockCharts ACP. Click here to learn more.
Percent of Stocks with Golden Cross Stays Bullish
The next chart shows SPY with the 200-day SMA and the percentage of S&P 500 stocks with a golden cross (!GCISPX). A golden cross means the 50-day EMA is above the 200-day EMA. This indicator was above 70% for almost all of 2024. It dipped to 69.74-69.8 percent for three days in July 2024. This is what a broad bull market looks like. The trouble arrived when the indicator broke below 60% in March and SPY broke its 200-day SMA that same month.
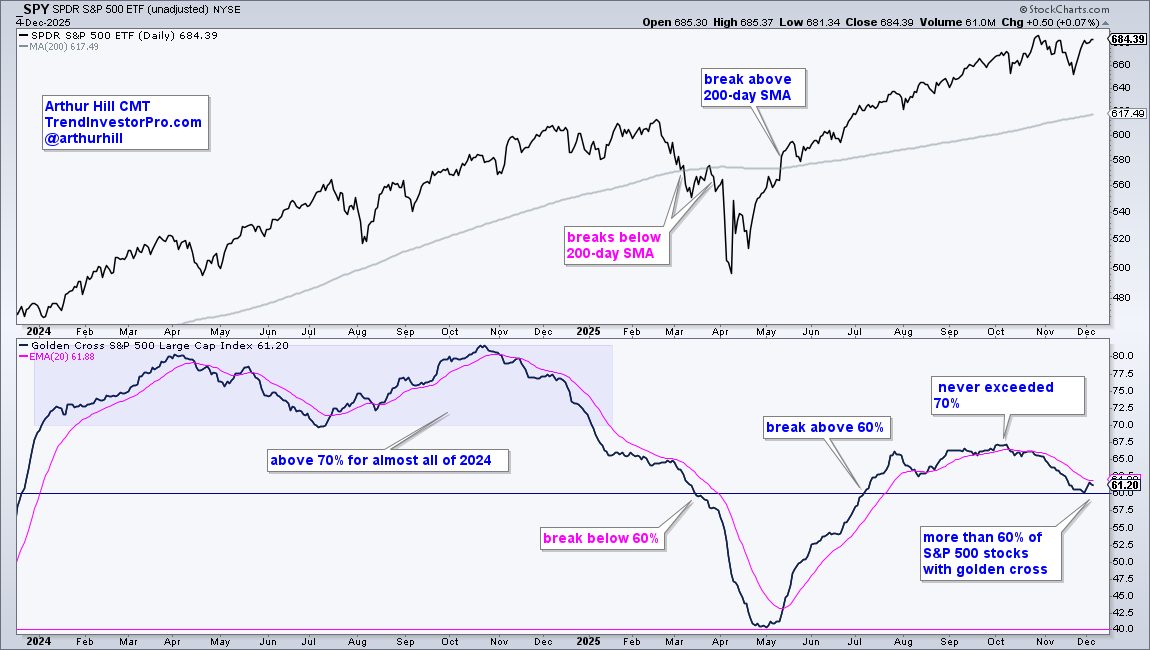
After plunging to the 40% area in late April, the indicator surged above 60% in early July. This shows a strong increase in upside participation as the vast majority of S&P 500 triggered golden cross signals. This indicator held above 60% since this cross, but never managed to get back above 70%. The high was 67.20% in October. Once again, this is not a broad bull market that lifts most stocks. Instead, it is a selective bull market. Nevertheless, it is still a bull market because the vast majority of S&P 500 remain with golden crosses. A move below 60% would show deterioration that could lead to a market correction.
Homebuilders ETF Breaks Out - Now What?
Will upside participation expand within the S&P 500? That’s the big question heading into 2026. Early signs are positive as we recently noted breakouts in ETFs related to banks, housing, retail, consumer discretionary and small-caps. It is important that these breakouts hold – and that we see follow through. TrendInvestorPro covered these breakouts in our report/video on Tuesday and will continue to monitor price action.
The chart below shows the Homebuilders ETF (XHB) with a bullish wedge breakout in late November. Overall, ITB surged from April to August with a break above its 200-day SMA. The ETF then fell back to the 40-wk with the decline into November. This decline also retraced 50-61.8 percent of the prior advance and returned to the prior breakout zone (blue shading). Technically, this looks like a normal, albeit deep, correction within a bigger uptrend.
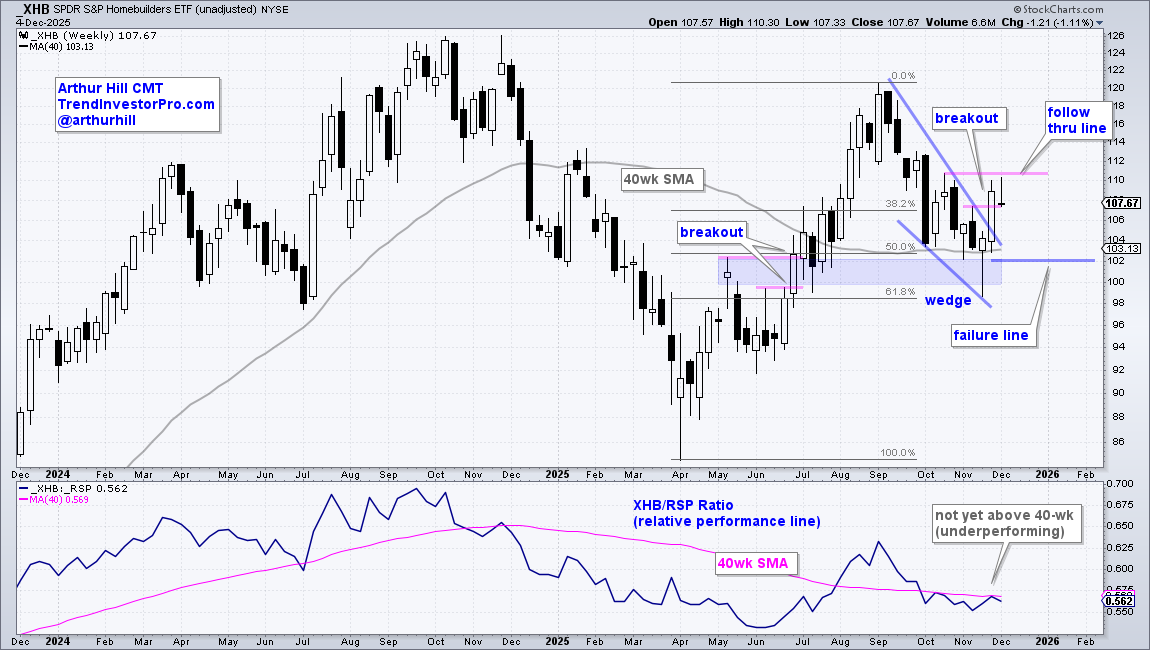
XHB ended this correction with a break above the wedge line and early November high (breakout). This is a positive development for a key group in the stock market and economy. Now what? The follow through line is set at 111 and a weekly close above this level would confirm the breakout. I am also watching the price-relative (XHB/RSP ratio) for a break above the 200-day to show relative strength. The failure line is set at 102. A close below this level would erase the breakout surge and break the 200-day SMA. This would be most negative.
Recent Reports and Videos at TrendInvestorPro
- Small-caps Lead, Space Sets Up, Telecom Breakout
- Stock Setups: First Solar, Quanta and Arista Networks
- Copper and Base Metals Set Up Bullish
- Breadth Supports the Bull Market (%Above 200-day)
- Click here to take a trial and gain full access.