The next report will be on Wednesday, January 29th.
Today’s report covers the sell off in AI infrastructure stocks and related ETFs. Monday’s decline were excessive, and perhaps an over-reaction, but they did some damage on the charts. NVDA broke its 200-day SMA and the two semiconductor ETFs broke support. Despite a big decline in NVDA, MAGS is holding support with help from other components. We will then look at three ETFs that represent different areas of AI (infrastructure, physical, software).
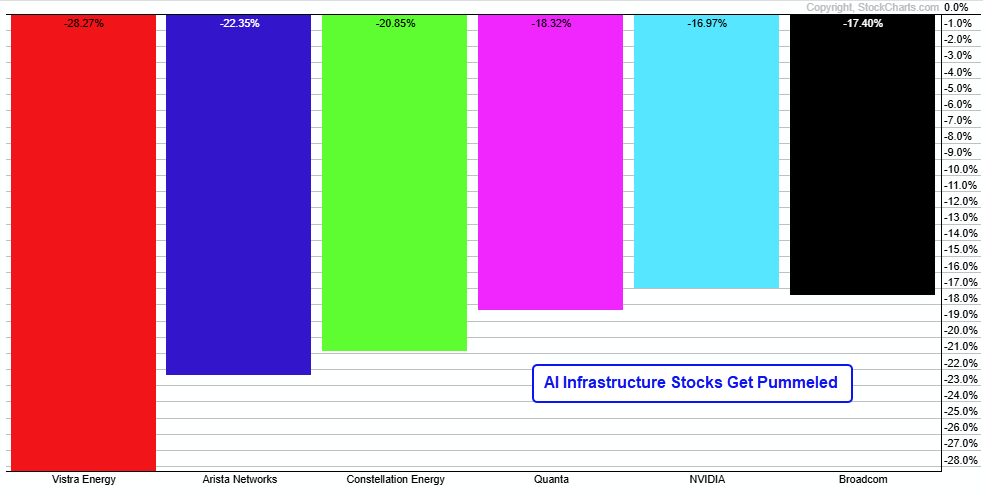
AI Infrastructure Stocks Get Pummeled
NVDA Breaks 200-day SMA
MAGS Falls back after Flag Breakout
ARTY Bears the Brunt of Selling Pressure (plus BOTZ, AIQ)
SMH and SOXX Break Support
AI Infrastructure Stocks Get Pummeled
The AI sell off was largely concentrated in the AI infrastructure stocks. DeepSeek sparked this selloff because they built an AI model that performs well with less money. I am an AI layman, but as far as I can tell, we are talking about an LLM (Large Language Model). LLM’s and training models are so 2024. It seems to me that the future of AI is physical and inference. Per Nvidia: “Physical AI enables autonomous machines like robots and self-driving cars to perceive, understand, and perform complex actions in the real (physical) world.” This is where we need the heavy lifting from AI infrastructure. Note that lower infrastructure spending benefits the users of AI and perhaps increases demand.
Here are two videos covering AI and DeepSeek.
Stacy Ragson of Bernstein
Doug Clinton of Deepwater
The market can remain irrational a lot longer than we can remain solvent. (Lord John Maynard Keynes).
Nobody, and I mean nobody, knows how AI will play out. Monday could be an overreaction. It may indeed be year three of a three to five year run that began in 2023. However, there can still be setbacks and sentiment resets in long-term secular trends. A setback would be a correction or multi-month downtrend within a secular up trend. A sentiment reset occurs when Wall Street becomes excessively bearish.
As a technical analyst, I base my assessments on price action and the price chart. What is the chart telling me? I gauge the long-term trend, the patterns at work and the setups in play. These assessments change when new information becomes available (new price bars). With Monday’s decline, we have new information and some break downs working (NVDA SMH, SOXX). There are also some charts with normal throwbacks after breakouts in mid January (BOTZ, AIG).
NVDA Breaks 200-day SMA
The chart below shows Nvidia (NVDA) ending a two year run above the 200-day SMA. NVDA bottomed in October 2022, but it was still down 50% for the year. The stock then surged 240% in 2023 and 170% in 2024. It is down 11.82% year-to-date in 2025. With a 17% decline on Monday, the stock broke support from the November low and closed below the 200-day SMA. The triangle breakout in early October failed. The failed breakout, support break and close below the 200-day indicate that NVDA is moving into a downtrend. At the very least, there is no setup on this chart and it is time to wait for the next opportunity.
Note that the first break of the 200-day SMA is not always a clean affair. NVDA doubled in 2021 and then broke the 200-day SMA in January 2022. However, the stock did not immediately trend lower. Instead, it battled the 200-day SMA for two months and then made a decisive break in April 2022. This break coincided with a bear market. The combination of a bear market and break of the 200-day SMA was lethal. We are still in a bull market environment, but there is clearly a rotation underway. Money is moving out of AI infrastructure and into the more mundane areas (finance, industrials, healthcare).
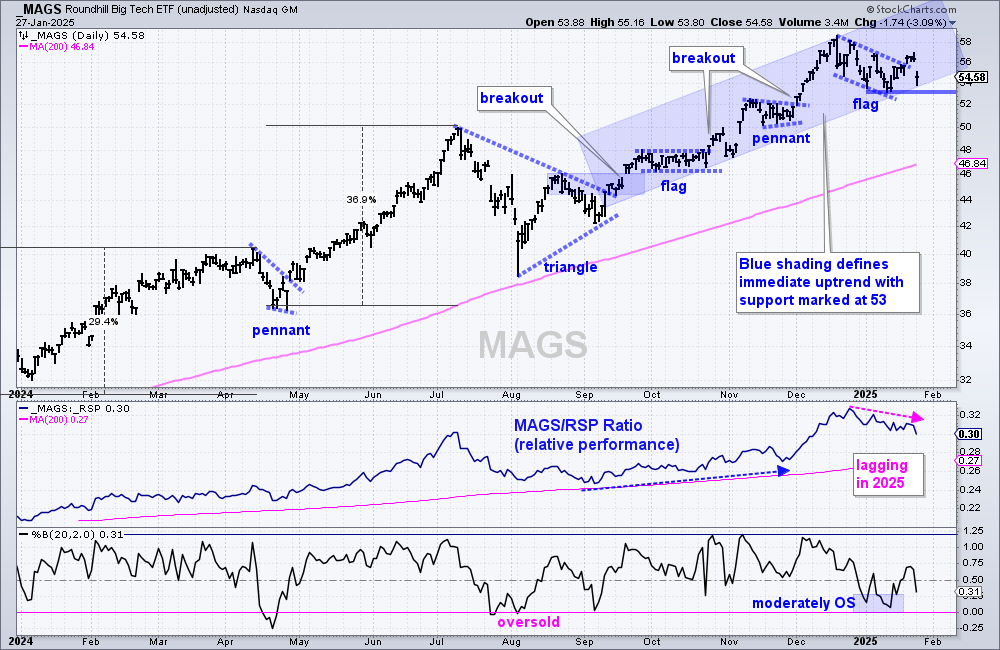
MAGS Falls back after Flag Breakout
The decline in Nvidia weighed on the Mag7 ETF (MAGS), but the other six stocks were mixed on the day. Amazon (AMZN), Apple (AAPL), Meta (META) finished higher, while Microsoft MSFT), Alphabet (GOOGL) and Tesla (TSLA) finished lower. Short-term, MAGS boke out of a flag last week and fell 3% on Monday. The breakout did not hold, but the immediate trend is still up with support marked at 53. A break here would reverse this upswing and argue for a correction. The lower window shows the MAGS/RSP ratio falling in January as MAGS underperforms the broader market.
Long-term, MAGS is in a long-term uptrend as it hit a new high in December and remains well above the rising 200-day SMA.
Note that MAGS is an equal-weight ETF and the seven holdings are rebalanced quarterly. These include NVDA, AMZN, AAPL, GOOGL, META, MSFT and TSLA.
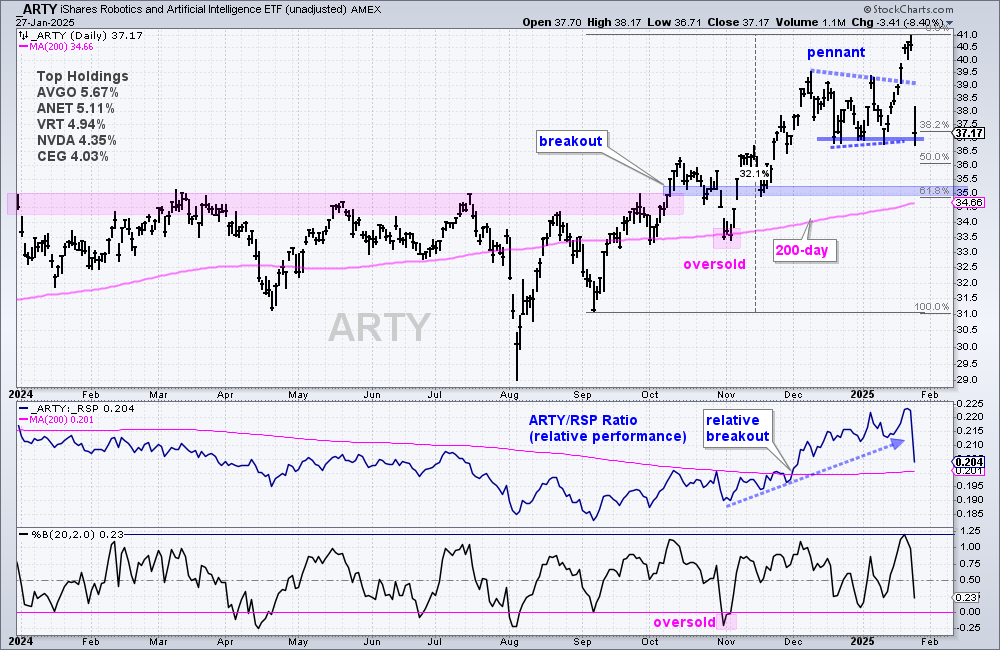
ARTY Bears the Brunt of AI Selling Pressure
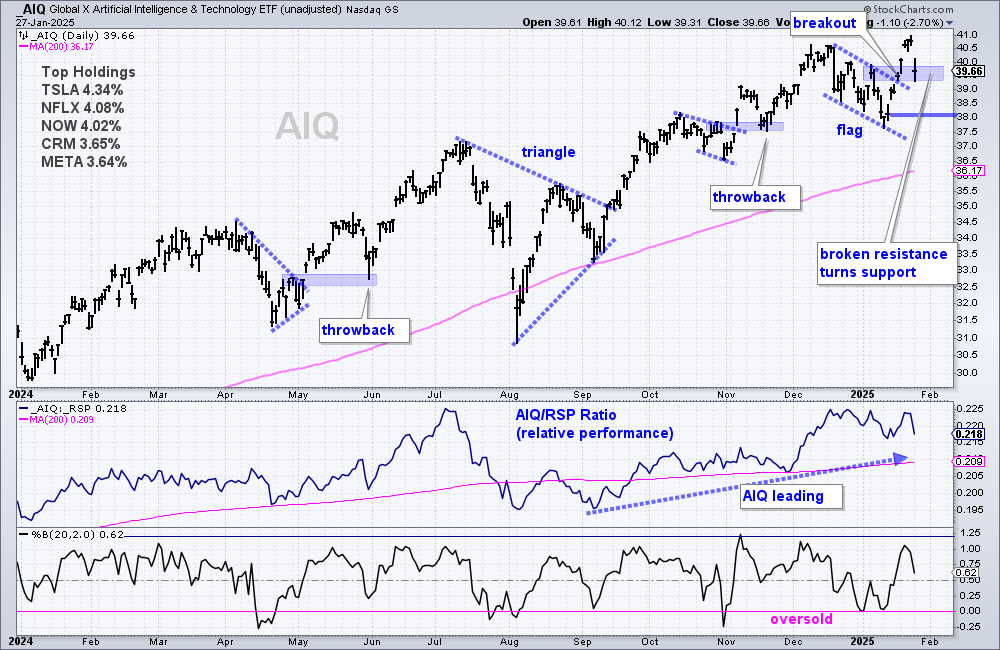
I track three AI related ETFs in my ETF ChartList and these three cover different aspects of AI. The Robotics AI ETF (ARTY) is largely focused on AI infrastructure (AVGO, ANET, VRT, NVDA, CEG). The Global Robotics & AI ETF (BOTZ) is international with an emphasis on physical AI. The Global AI & Tech ETF (AIQ) is also international with an emphasis on software and applications (TSLA, NFLX, NOW, CRM, META).
The first chart shows ARTY getting hit the hardest as it plunged to support from the December-January lows. ARTY moved from a pennant breakout and upside leadership, to a failed breakout and support test. It is short-term oversold after Monday’s rout and ripe for a bounce. Technically, it is still in a long-term uptrend as it hit a new high last week and remains well above the rising 200-day SMA. Should ARTY fall further, I would mark the next bullish setup zone in the 35 area. This zone stems from the 50-61.8 percent retracements and support from the mid November low (blue shading). The rising 200-day SMA also comes into play here as support. A decline to this area and an oversold condition with Percent-B dip below zero would produce a trading setup.
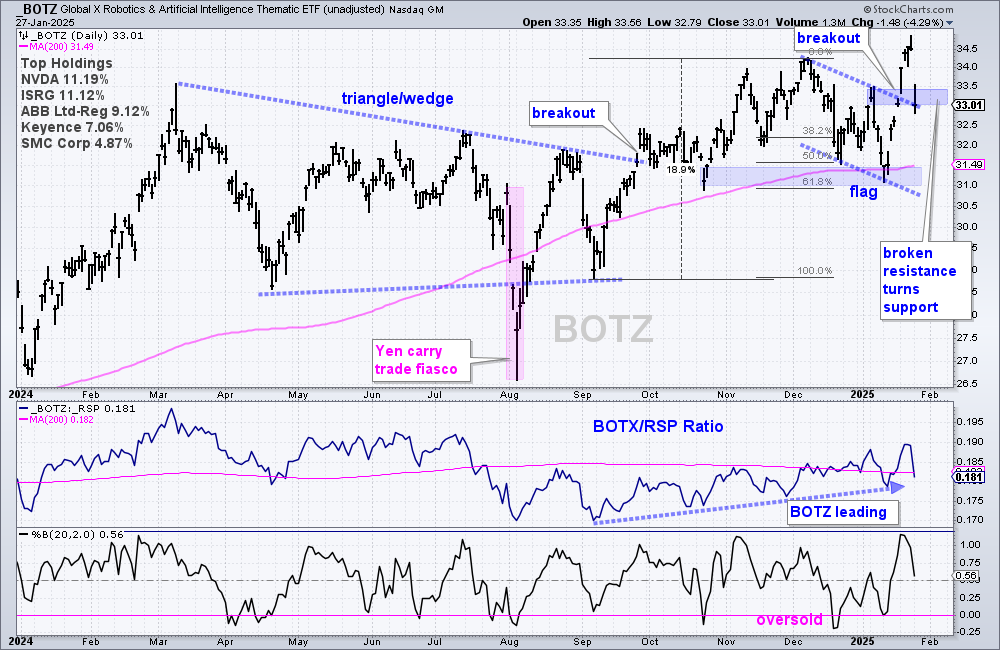
The next chart shows the Global Robotics & AI ETF (BOTZ) with a flag breakout and a hard throwback on Monday. The breakout zone (blue shading) turns first support and this is an area to watch for firming. Long-term: BOTZ is in a long-term uptrend with a new high in January and price above the rising 200-day SMA.
The next chart shows the Global AI & Tech ETF (AIQ) breaking flag resistance on 21-Jan and hitting a new high last week. AIQ fell back on Monday and is testing the breakout zone, which turns into first support. The flag breakout is still there and still bullish. The breakout zone is an area to watch for firming and a bounce after a throwback. Notice that there were hard throwbacks in late May and mid November. Long-term: AIQ hit a new high in late January and is above the rising 200-day SMA (long-term uptrend).
SMH and SOXX Break Support
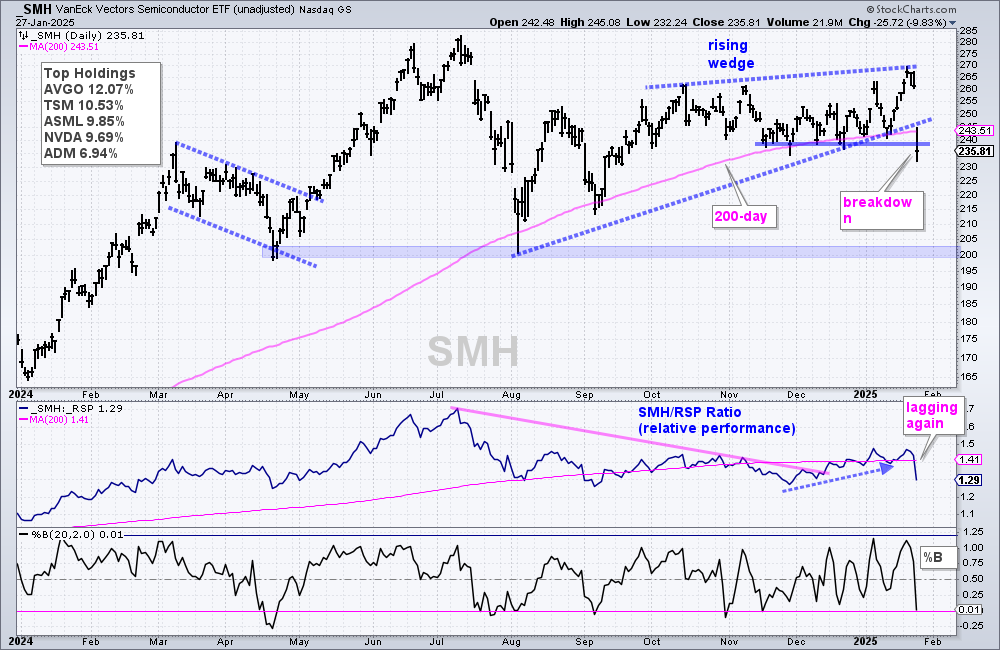
SMH broke wedge support to signal a continuation lower. The next chart shows the Semiconductor ETF (SMH) breaking support with a gap down and 10% decline. If this is an over-reaction, then SMH needs to quickly firm and recover this support break. Overall, the chart looks bearish as SMH broke rising wedge support with a gap-plunge. SMH did not challenge its July high and formed a lower high from July to January. This wedge break signals a continuation lower and targets a move towards the 200 area.
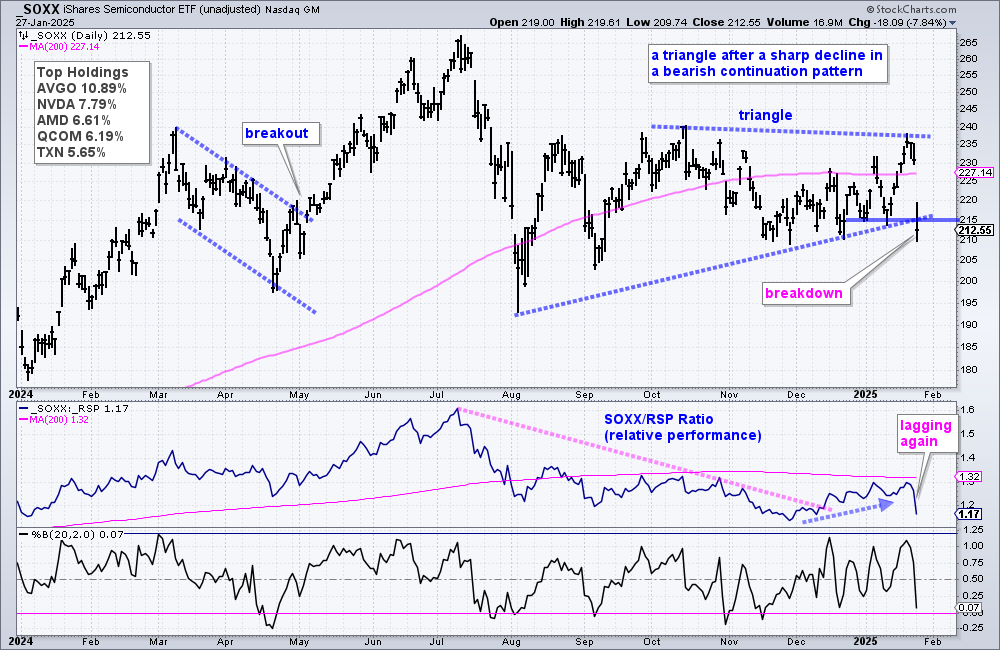
SOXX broke triangle support to signal a continuation lower. The next chart shows the Semiconductor ETF (SOXX) falling sharply in July and never fully recovering as it moved into a sideways consolidation. A consolidation after a sharp decline is typically a bearish continuation pattern. SOXX broke down with Monday’s decline and this signals a continuation lower.
")