")
The next report will be on Tuesday, January 28th.
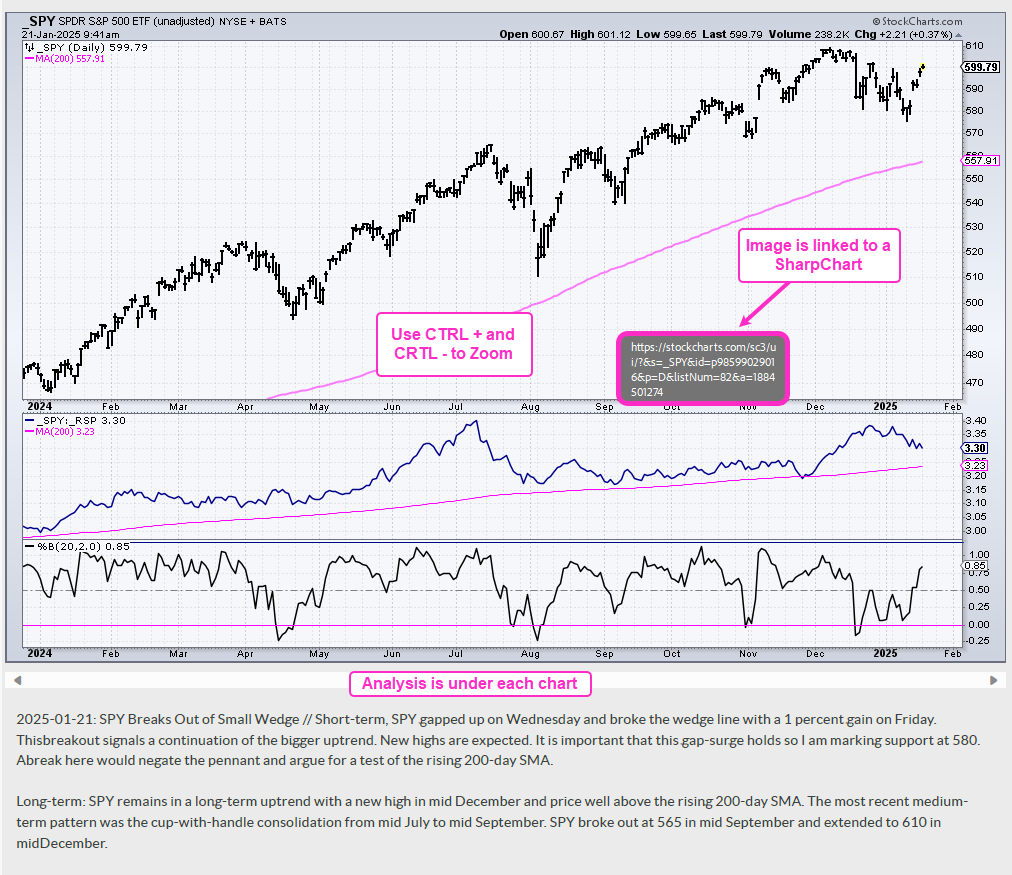
The breakouts are expanding as tech-related stocks surged this week. Last week we saw breakouts in some of the more mundane groups (industrials, finance, utes). Today’s report will focus on ETFs related to tech, the Mag7, AI, cloud, cybersecurity, semiconductors and biotech. With the exception of biotech, many of these ETFs led the market from September to November and then corrected into January. Their corrections ended with surges and breakouts over the last six days. We will mark the breakout points, set re-evaluation and, when appropriate, point out throwback zones to watch should we see a pullback.
- XLK with Support Breakout and Big Oversold Bounce
- XLC Breaks Out of Small Wedge
- MAGS Breaks Flag Line
- AIQ Breaks Out of Flag and Hits New High
- ARTY Breaks out of Pennant and Hits New High
- BOTZ Breaks Out of Falling Flag and Hits New High
- CLOU Breaks out of Small Wedge
- SKYY Breaks Wedge Line and Exceeds December High
- CIBR Extends Higher after Pennant Breakout
- SMH Surges off Support and Hits Multi-month High
- SOXX Maintains Upswing since early January Breakout
- IGV Breaks Free with Gap-Surge
- IBB Attempts to Firm Near Bullish Setup Zone
- XBI Forms Deep Falling Wedge and Underperforming
Some setups also feature Bullish Setup Zones (see report here)
If viewing the PDF in a browser, right click on charts to open in a new tab or window.
Use CRTL and the Plus or Minus keys (+ -) to zoom. 125% works best for me.
Send feedback to support(at)trendinvestorpro.com or use the contact form.
Working with PDF Files
Why the shift to PDF? Working with ChartLists at StockCharts and PDF files is an effective and efficient manner to track and analyze a chart group (ETFs, stocks, Market Regime). It saves an enormous amount of “posting” time, which is the time required to copy/paste the text and charts for each section. With a ChartList, I simply print the charts and analysis to one PDF. This also serves as a good archive.
The charts in the PDF files are linked to a corresponding SharpChart at StockCharts. There are two ways to open the PDF file: through your browser or through an application like Adobe Acrobat. When viewing the PDF through your browser, the best way to open a chart is to right click on the image and choose open in new tab/window. When viewing the PDF through Acrobat, you can open a chart in your default browser by simply clicking on the image.
The example below is a screen shot from the PDF.
Send feedback to support(at)trendinvestorpro.com or use the contact form.