Today’s report will start with a stock market overview with analysis of the big three (SPY, QQQ, IWM) and three key industry group ETFs (SOXX, XRT, ITB). Housing is holding up, but the other five broke down and the weight of the evidence is bearish for stocks. We will then turn to bonds, which are following stocks with a break down, and the 10-yr Yield, which broke out. This did not help the Dollar as it extended lower. Gold and silver liked what they saw with the Dollar. We will then turn to oil, energy-related ETFs, base metals, grains and livestock.
About the ETF Trends, Patterns and Setups Report
This report contains discretionary chart analysis based on my interpretation of the price charts. This is different from the fully systematic approach in the Trend Composite strategy series. In this ETF Trends, Patterns and Setups report, I am looking for leading uptrends and tradable setups within these uptrends. While I use indicators to help define the trend and identify oversold conditions within uptrends, the assessments are mostly based on price action and the price chart (higher highs, higher lows, patterns in play). Sometimes the chart assessment can be at odds with the indicators.
Programming Change this Week
Note that this week’s commentary schedule is a little different. I will cover the commodity related ETFs and a few others on Thursday. This week’s video will be on Friday, instead of Wednesday.
Tuesday – 20 Dec: Market Regime Update (CBM -3)
Tuesday – 20 Dec: ETF Report and Signal-Rank Table Update
Thursday – 22 Dec: ETF Report and Signal-Rank Table Update
Friday – 23 Dec: Market Regime and ETF Video
Saturday – 24 Dec: ETF Signal-Rank Table Update
Holiday Break
I will take a break between Christmas and New Year so there will not be any reports next week (December 26th to 30th). This is the time to put the market aside and spend time with loved ones. The normal schedule will resume on Tuesday, January 3rd. Merry Christmas and Happy New Year!!
SPY Remains with Breakdown and Long-term Downtrend
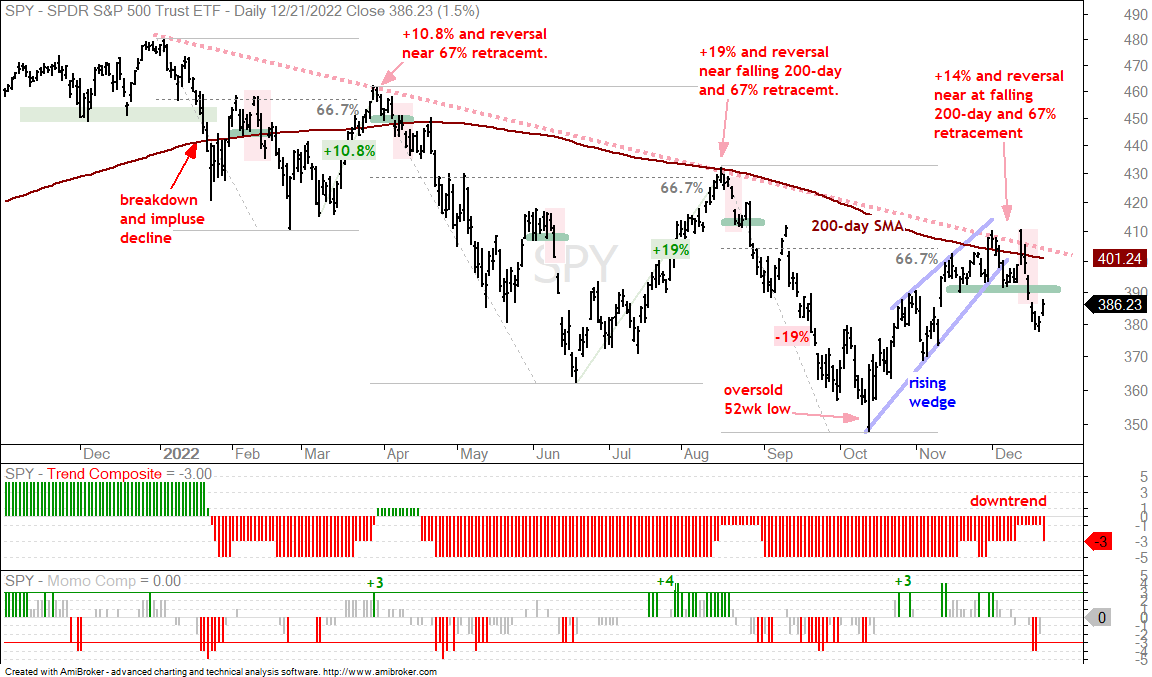
As noted in Tuesday’s Market Regime report, the Composite Breadth Model moved to -3 and stocks are back in bear market mode. The surges in March and August pushed the Composite Breadth Model to +1, but these signals resulted in whipsaws as the market turned lower in April and the second half of August. SPY did not turn bullish in August or late November because it failed near the falling 200-day SMA and formed lower highs each time. The ETF also reversed after retracing 67% of the prior decline each time.
The long-term trend is down and SPY reversed its short-term uptrend with a support break at 390 last Thursday. This breakdown signals a continuation of the bigger downtrend and I expect a test of the October low in 2023. As far as picking a bottom, I will watch for three things: a break below the October low, a selling climax and a big surge in the VIX. Seasonally, February is one of the weakest months of the year and it could happen then.
QQQ, IWM, XRT and SOXX Break Down
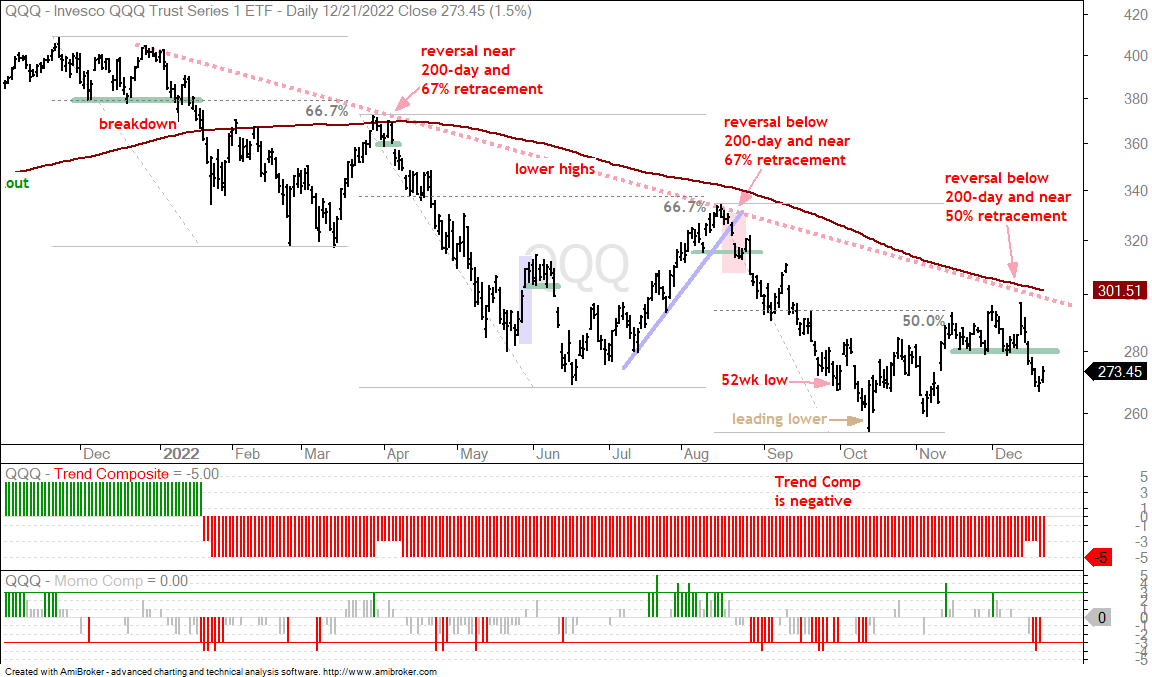
The next chart shows QQQ with a series of lower highs and lower lows throughout 2022. Lower highs form when buying pressure fizzles below the prior high. Lower lows form when selling pressure pushes prices below the prior low. Overall, we have weakening buying pressure on each bounce and strengthening selling pressure on each decline. Most recently, QQQ broke support with a sharp decline on Thursday. This reverses the short-term upswing and signals a continuation of the bigger downtrend.
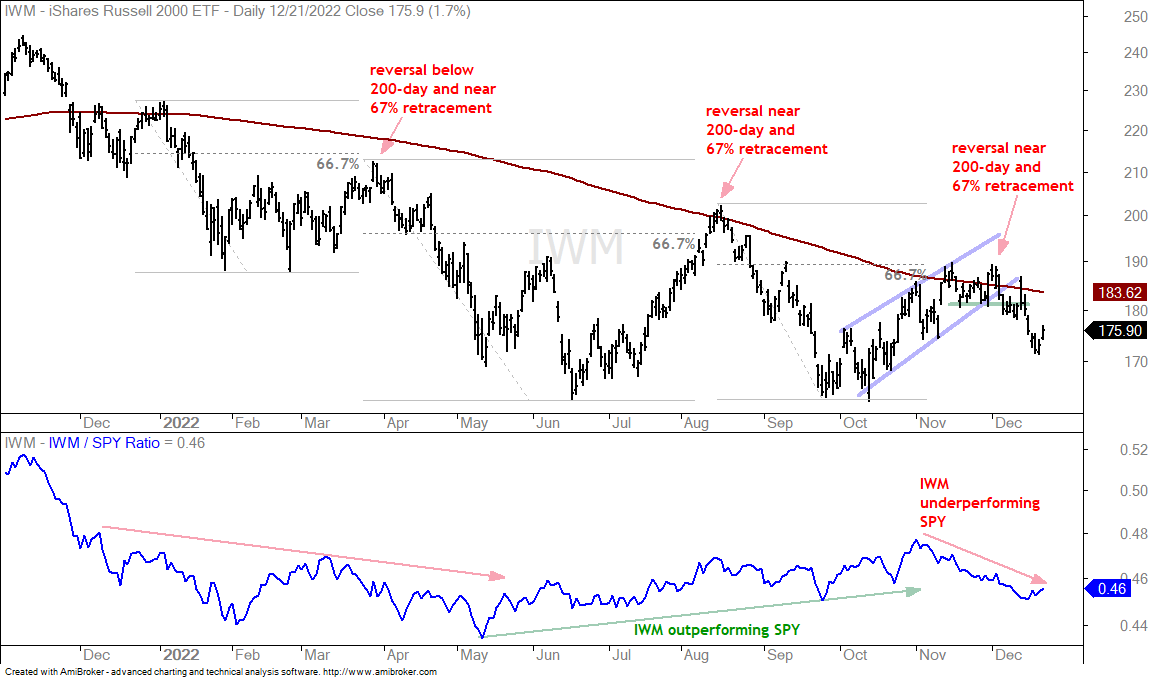
The next chart shows IWM breaking short-term support on December 6th, seven days before SPY and QQQ broke down. IWM is leading lower in December and I expect a new low in the coming weeks.
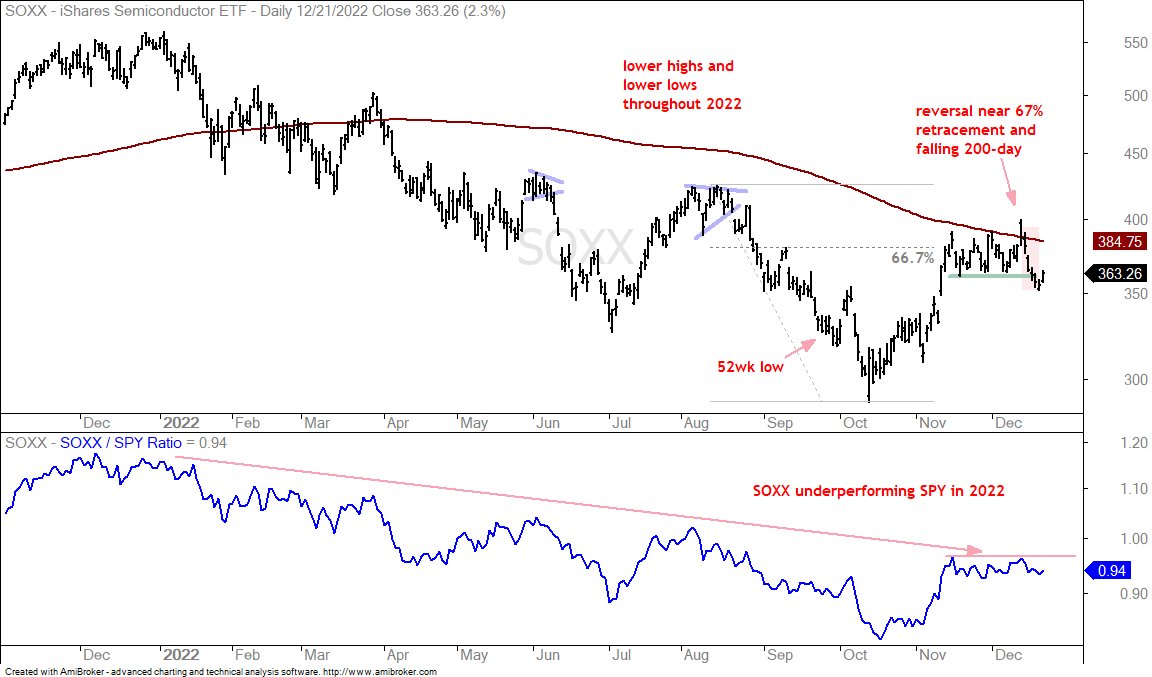
The next chart shows the Semiconductor ETF (SOXX) surging to the falling 200-day SMA, stalling for a few weeks and breaking short-term support last week. The short-term uptrend reversed and this means the long-term downtrend is poised to continue.
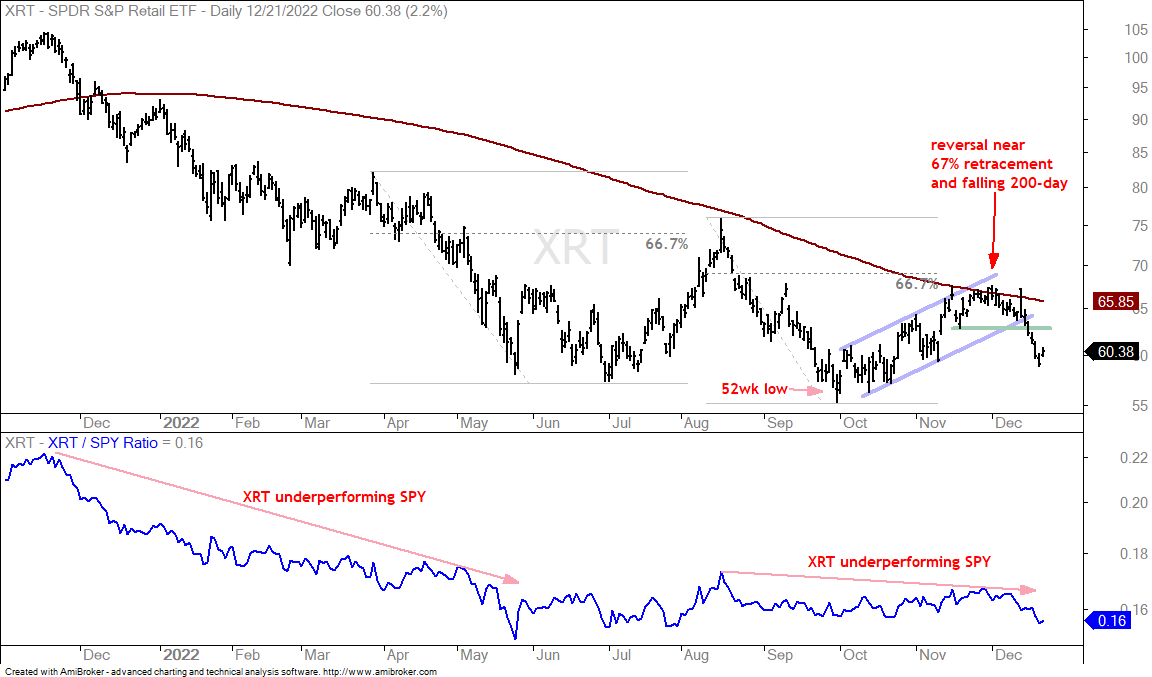
The next chart shows the Retail SPDR (XRT) with a reversal near the falling 200-day SMA and 67% retracement. The ETF broke short-term support last week and this signals a continuation of the bigger downtrend.
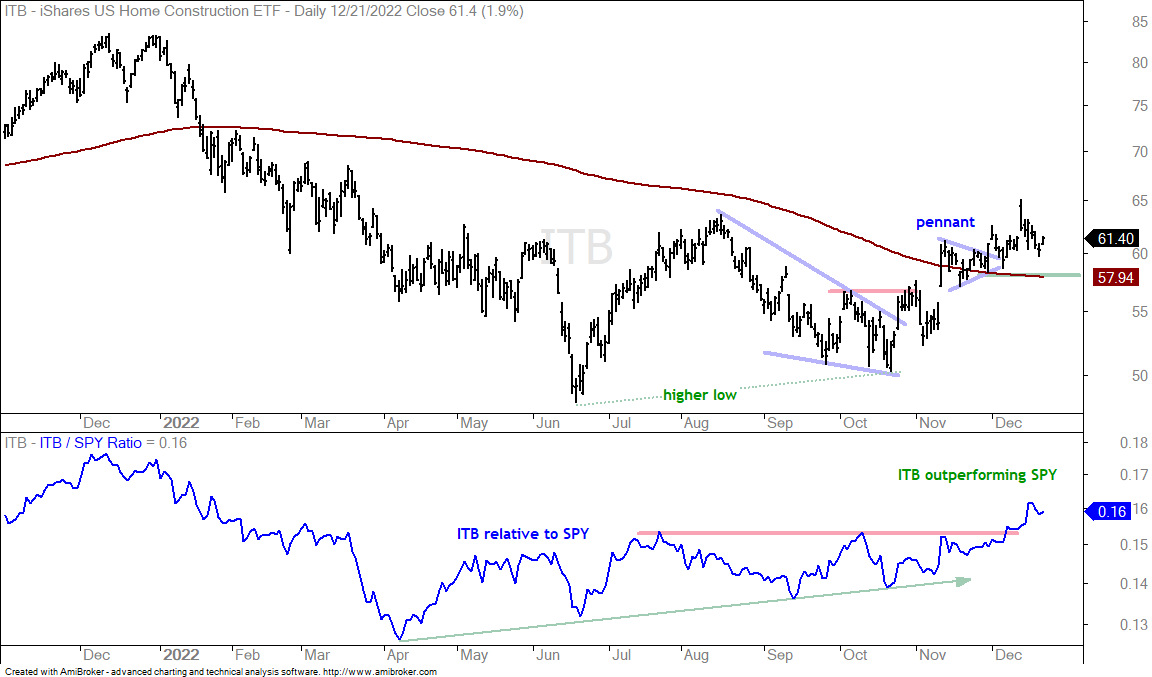
The next chart shows the Home Construction ETF (ITB) holding up better than the ETFs above. ITB is above its 200-day SMA and above its late November lows (58). The ETF broke out on October 28th and then surged above the 200-day SMA on November 10th. ITB has since worked its way higher and outperformed SPY the last few weeks. I will set upswing support at 58 and a break here would be bearish.
Large-caps (SPY), small-caps (IWM) and large-techs (QQQ) are in long-term downtrends and all three recently broke short-term support to reverse their short-term uptrends. Semis (SOXX) and retail (XRT) are also in long-term downtrends and also broke short-term support. Semis are important to the tech sector and tech is the biggest sector in the S&P 500. Retail spending is a key driver for the economy and consumer discretionary sector. By extension, the breakdowns in SOXX and XRT are negative for the broader market. Housing (ITB) is holding up for now, but it cannot power the market on its own. Thus, the weight of the evidence is bearish for the stock market and most stock-based ETFs will likely feel the pressure.
Bonds Break Down as Yields Break Out (TLT, $TNX)
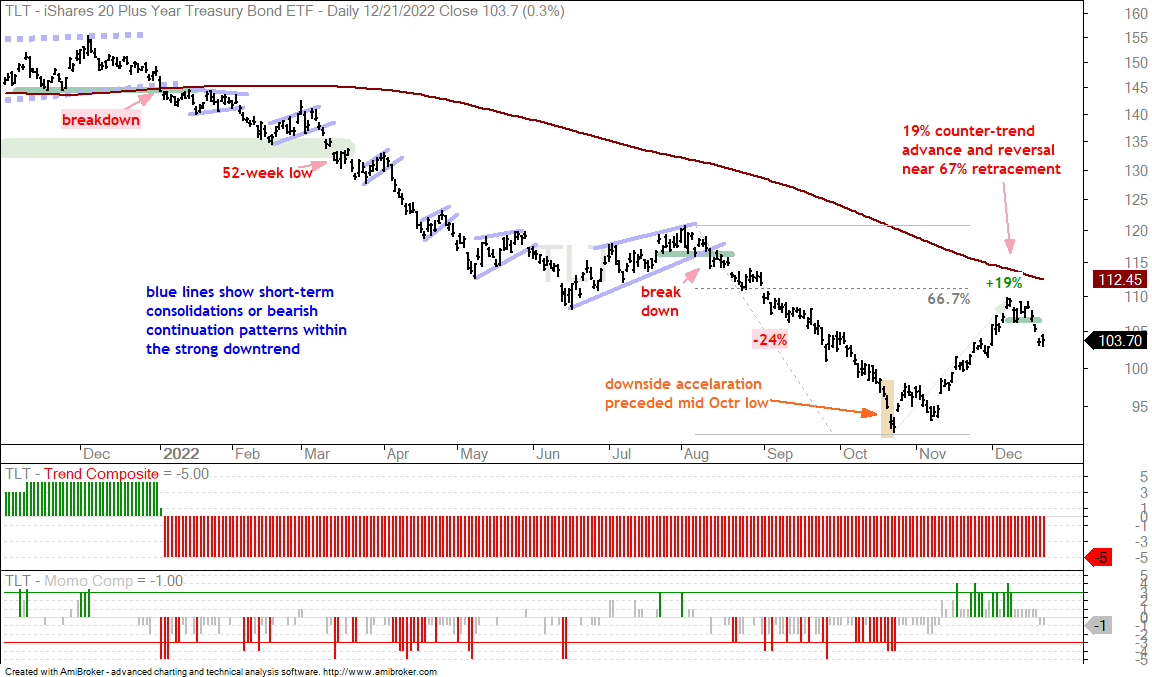
Performance in the Home Construction ETF could hinge on the 10-yr Treasury Yield, which just broke out. The first chart shows TLT with a big counter-trend advance that looks very familiar (67% retracement back towards falling 200-day SMA). TLT reversed the short-term uptrend with a support break on Monday. As with SPY, the long-term downtrend is continuing for TLT.
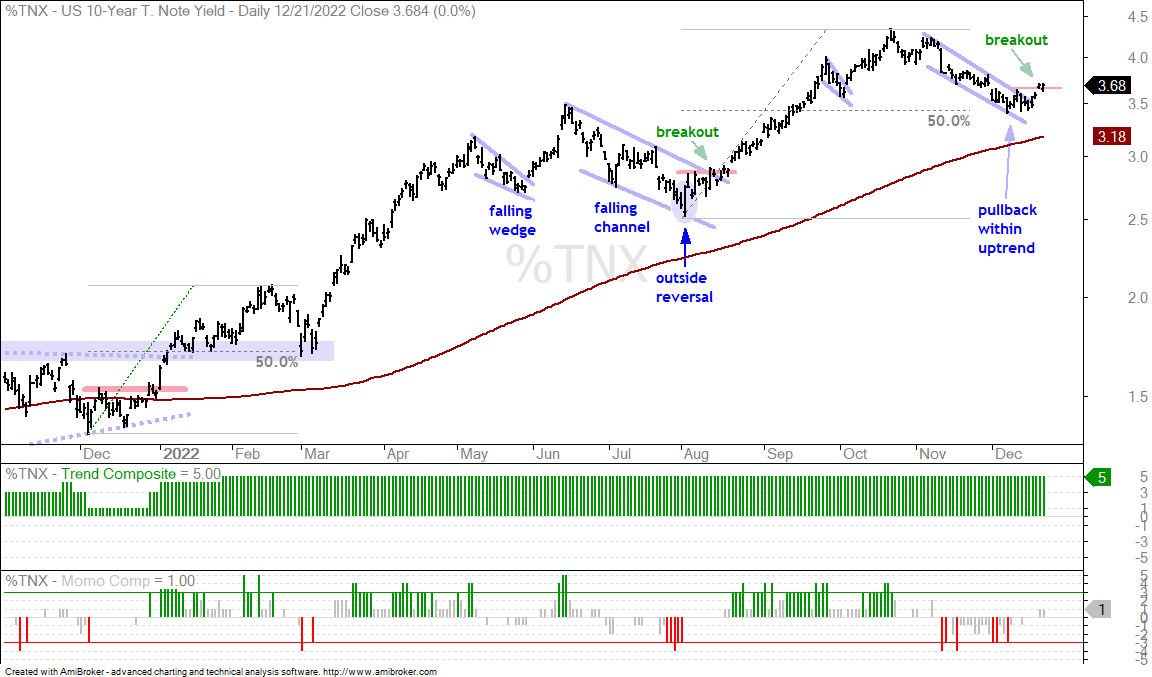
The next chart shows the 10-yr Treasury Yield breaking short-term resistance. The long-term trend is clearly up and the yield fell back into mid December with a correction. This correction ended with the recent breakout and I expect the 10-year to hit the 4.5% level. Rising yields could weigh on growth stocks and other interest sensitive groups, such as housing.
The Trend Composite aggregates signals in five trend indicators: Bollinger Bands (125,1), Keltner Channels (125,2), 5-day Rate-of-Change of 125-day SMA, StochClose (125,5) and CCI-Close (125). The Trend Composite and ten other indicators are part of the TIP Indicator Edge Plugin for StockCharts ACP
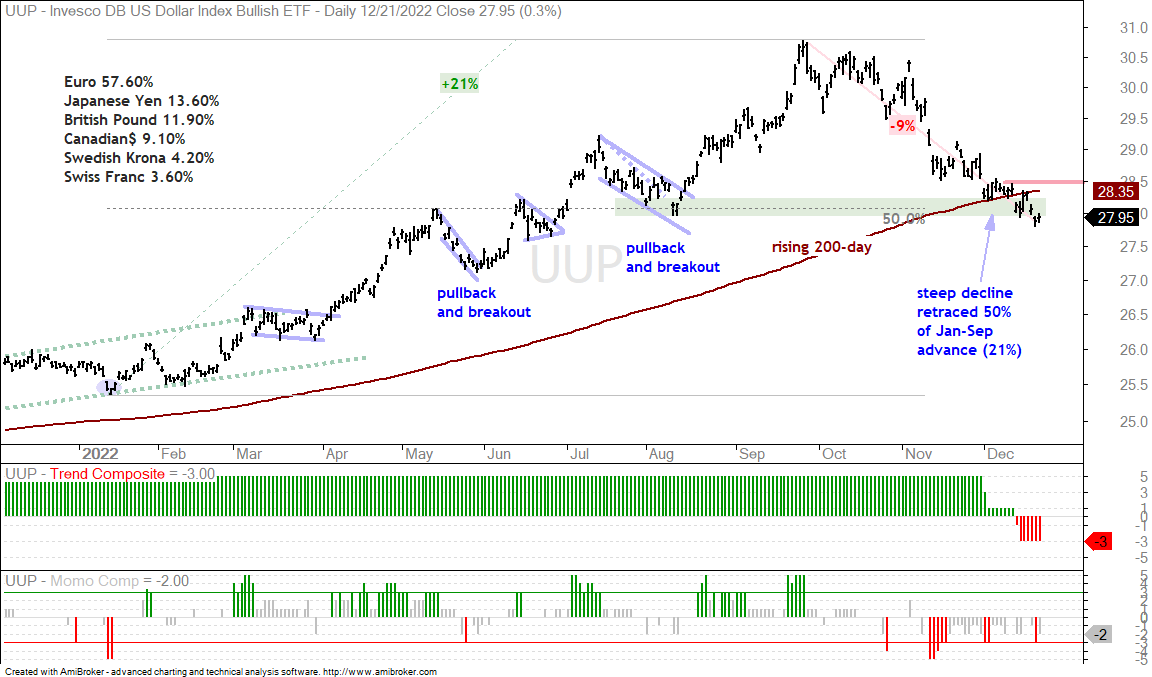
Dollar Remains Weak even as Yields Turn Up (UUP)
The 10-yr Treasury Yield turned back up and broke out, but the Dollar Bullish ETF (UUP) was not impressed and fell below last week’s low. The trend since October is down for UUP and the current decline, 9% in 60 days, is the largest 60 day decline since 2009. The move is truly extraordinary and this decline is overextended. Short-term resistance remains at 28.5 and a breakout here is needed to reverse the immediate downtrend.
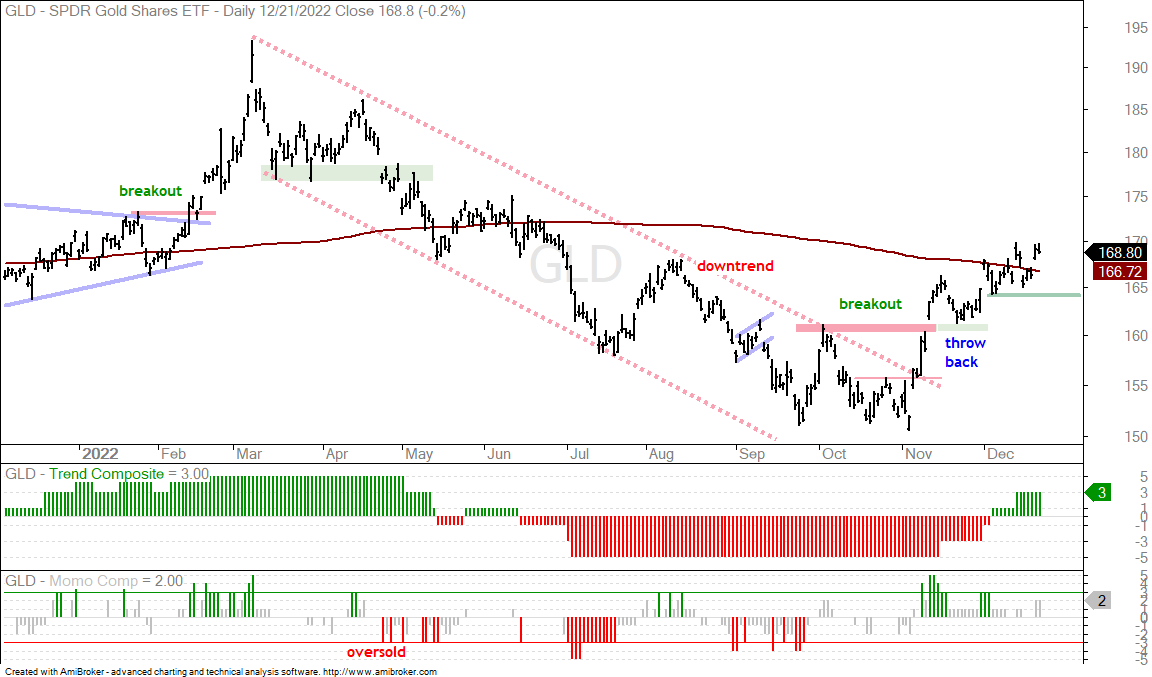
Gold and Silver Lead Precious as Platinum Stalls (GLD, SLV, PLTM)
The Gold SPDR (GLD) and the Silver ETF (SLV) are benefitting from weakness in the Dollar. The first chart shows GLD breaking out in November and continuing higher with a move above the 200-day here in December. I remain focused on the uptrend since early November and am marking support at 164. A close below this level would reverse this upswing and put GLD back below its falling 200-day SMA.
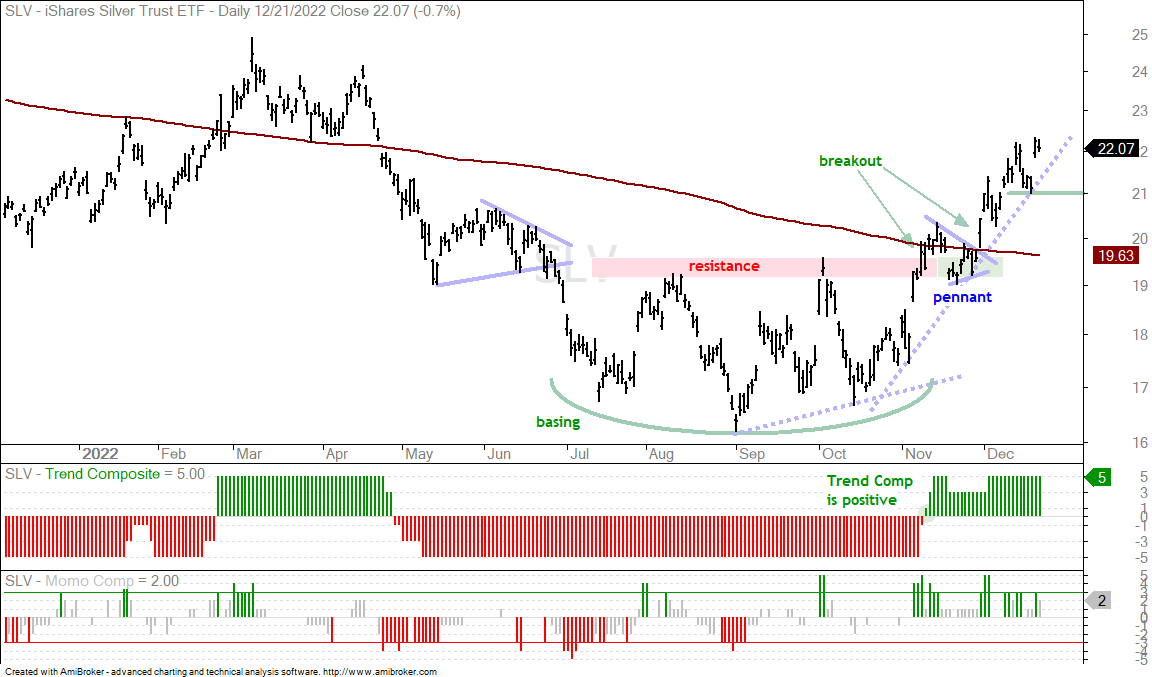
The next chart shows the Silver ETF (SLV) breaking out in early November, forming a pennant and breaking out again on November 30th. SLV is getting quite extended on the upside, but the bulls rule as long as GLD holds support and UUP does not break out. I am marking short-term support at 21 and a break here would reverse the uptrend that began in mid October.
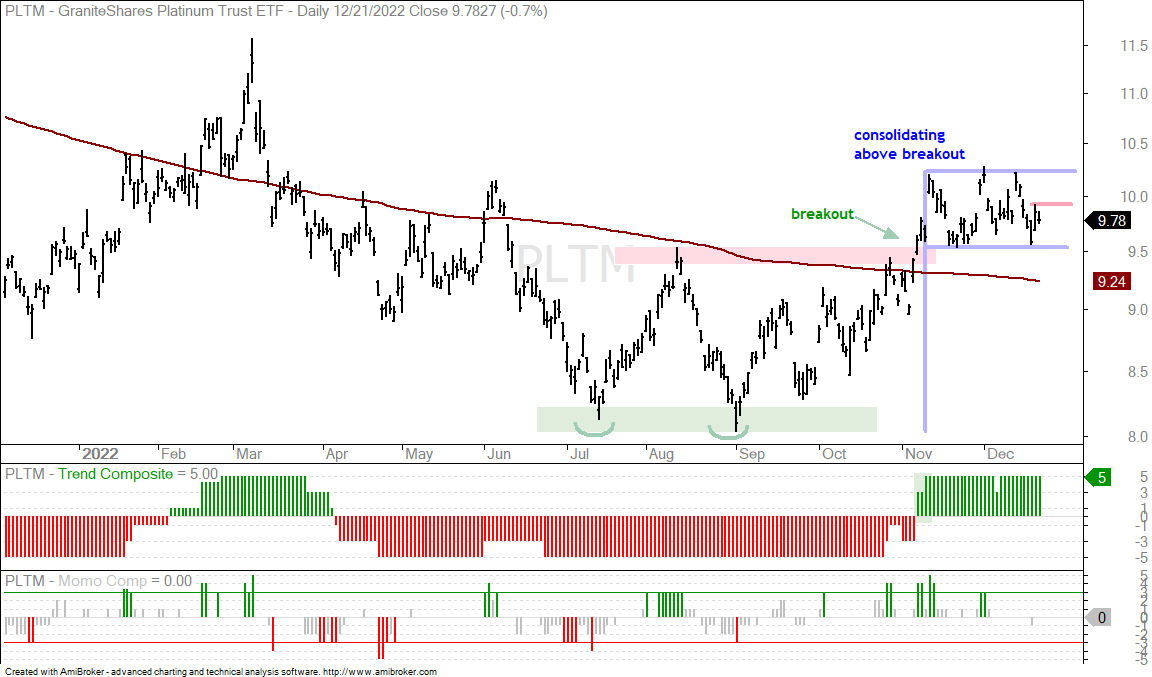
The next chart shows the Platinum ETF (PLTM) breaking out in mid November and then consolidating above the breakout zone. PLTM is not keeping up with GLD and SLV right now (underperforming). The breakout, however, is holding and the consolidation looks like a flat flag. A consolidation after a sharp advance is a bullish continuation pattern. As such, a surge above 10 would provide the first signs of strength. A flag breakout would end the consolidation and signal a continuation higher.
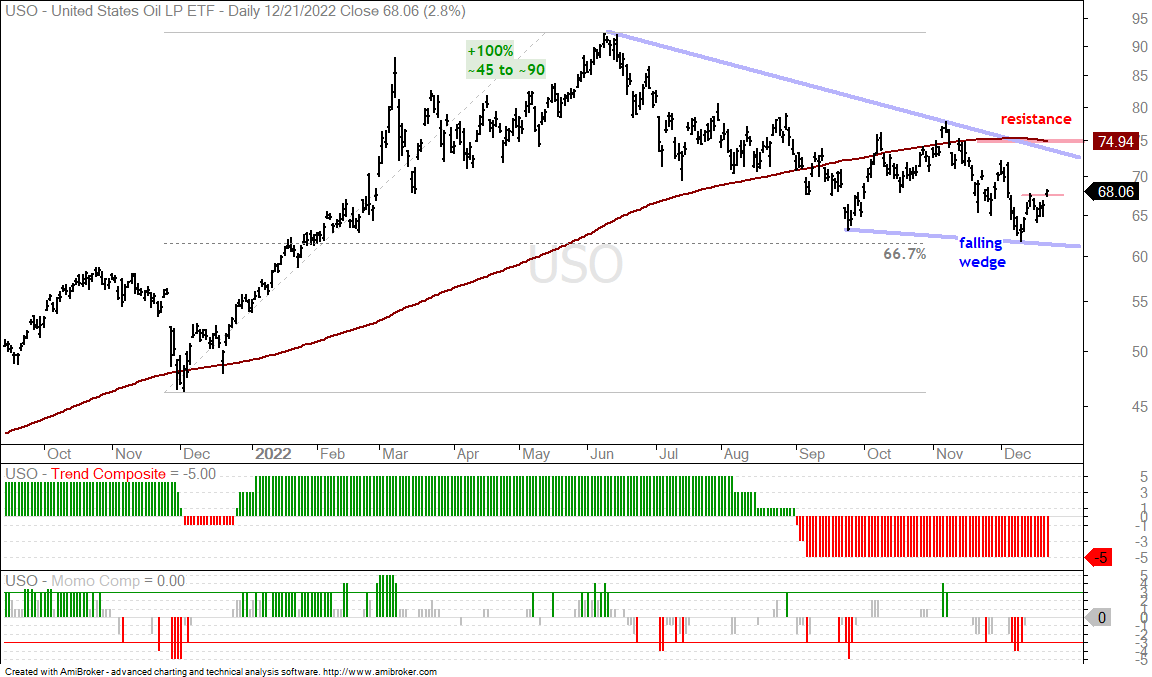
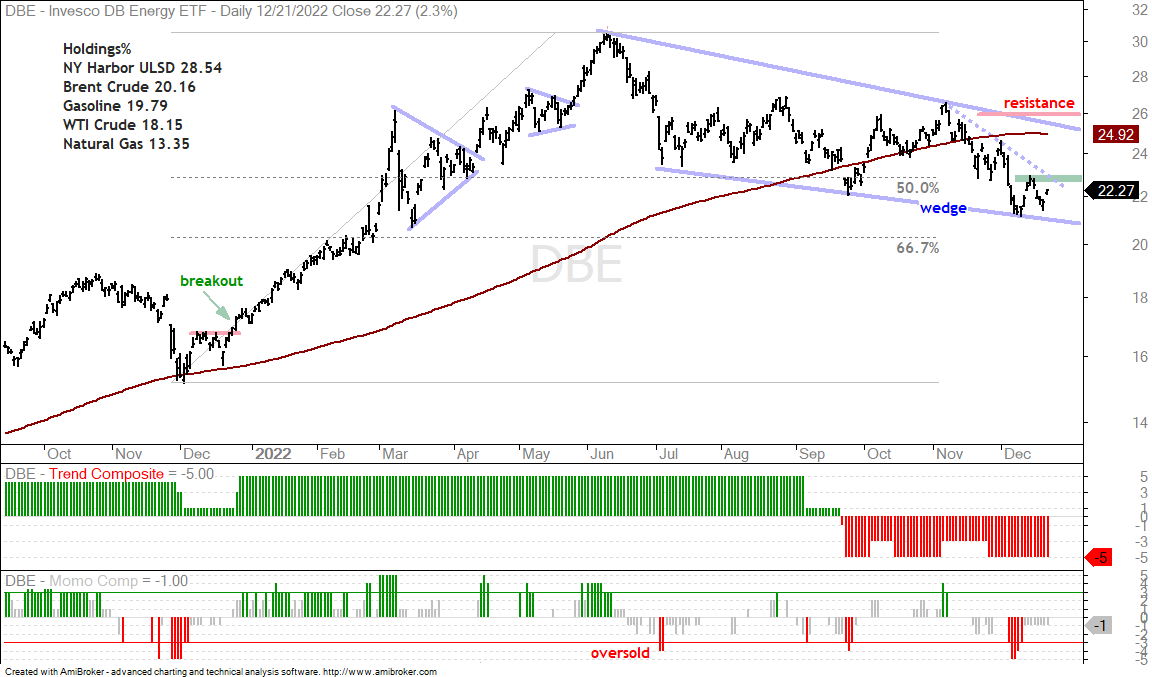
Oil Forms Large Falling Wedge (USO, DBE)
The US Oil Fund (USO) and the DB Energy ETF (DBE) remain in downtrends since June. These downtrends, however, could be big corrections after the 100% advance. The decline also retraced around 2/3 of this advance. The falling wedge and retracement amount are typical for corrections within bigger uptrends. Even so, the decline since June is a pretty long downtrend. A break above the upper line of the falling wedge and the 200-day SMA would be bullish.
Short-term, the Nov-Dec decline defines the downswing within this falling wedge. USO broke short-term resistance with a surge above last week’s high. This is the first sign of strength and the early bird signal for bottom pickers. The next chart shows the DB Energy ETF (DBE) with similar characteristics. DBE, however, has yet to reverse the Nov-Dec downswing.
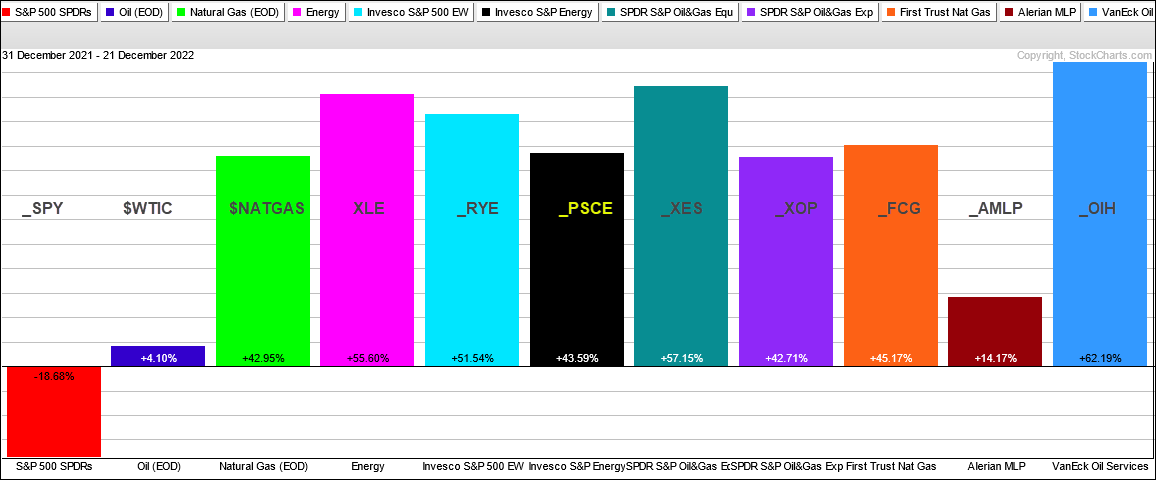
Energy ETFs Firm after Becoming Oversold (XLE, XOP, FCG, XES)
The energy-related ETFs are still leading the market over the past year with some of the biggest gains. The PerfChart below shows year-to-date performance for SPY, West Texas Intermediate ($WTIC) and nine energy-related ETFs. SPY is down 18.68% and $WTIC is up just 4.10%. The energy-related ETFs are up between 14% and 62%.
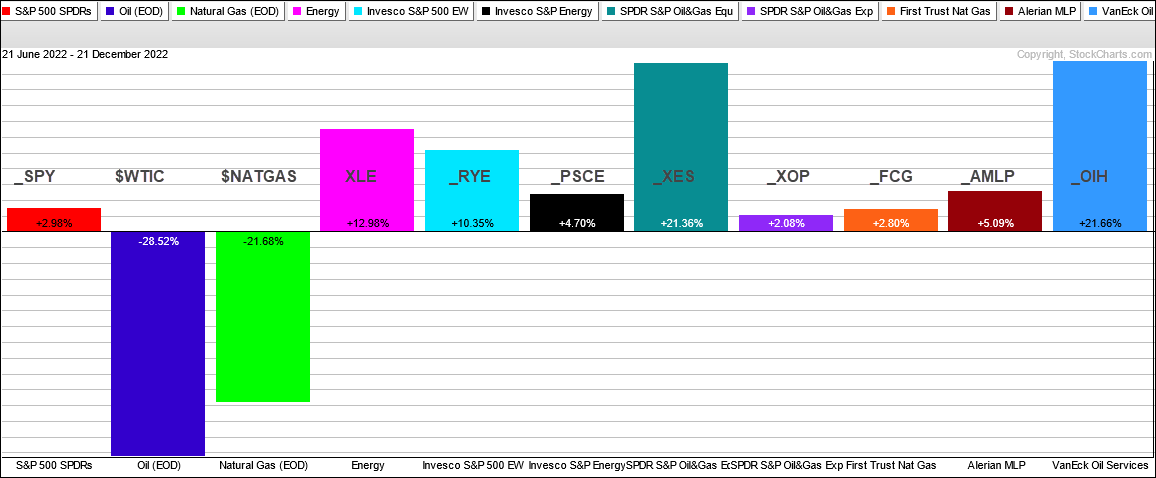
Performance over the last six months is even more impressive, considering that oil is down 28.5% and natural gas is down 21.7%. The energy-related ETFs are all up over this period with the Oil & Gas Equipment & Services ETF (XES) and Oil Services ETF (OIH) leading the way. XLE is also up double digits.
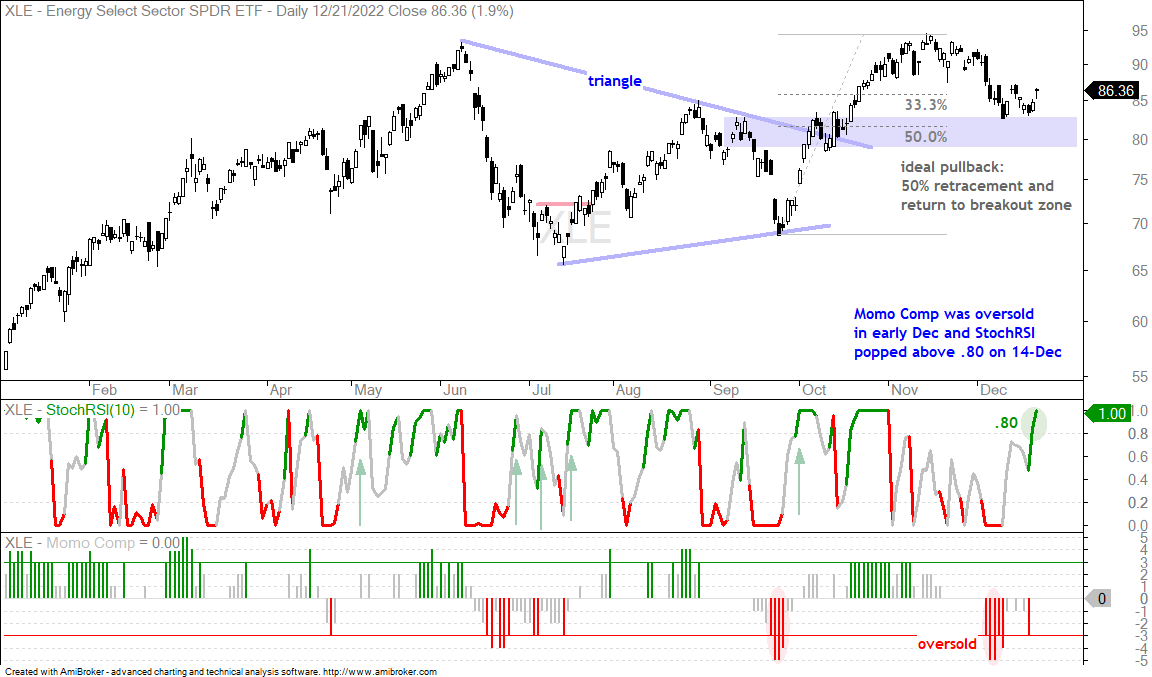
The first chart shows XLE hitting a new high in mid November and then correcting with a decline below 85 in mid December. I consider a decline after a new high and a decline within an uptrend as a correction within an uptrend. I consider a correction within an uptrend an opportunity, not a threat. One day there will be a correction that goes too far and reverses the uptrend. Until that day, however, the best play is for the bounce after a pullback.
There are many ways to guesstimate support for a pullback, but these are just guesstimates. Ideally, a correction will retrace around 50% and find support near a prior breakout zone. XLE fits the ideal scenario. The Momentum Composite also became oversold earlier in December and StochRSI popped above .80 for a short-term momentum thrust on December 14th. This is the first sign that the pullback is ending and the bigger uptrend is resuming.
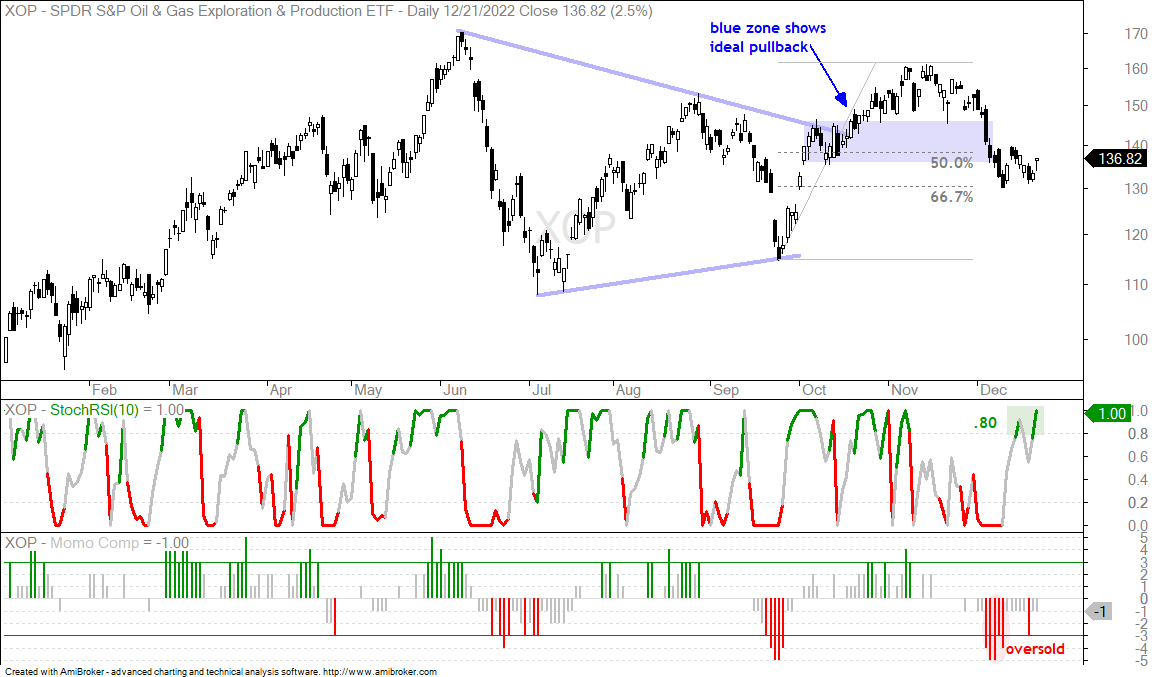
The next chart shows the Oil & Gas Exploration & Production ETF (XOP) with a less than ideal pullback. XOP did not firm near the prior breakout and 50% retracement. Instead, it retraced 2/3 after a sharp decline to the 130 area. Even so, the setup is the same: pullback within an uptrend.
You can learn more about my chart strategy in this article covering the different timeframes, chart settings, StochClose, RSI and StochRSI.
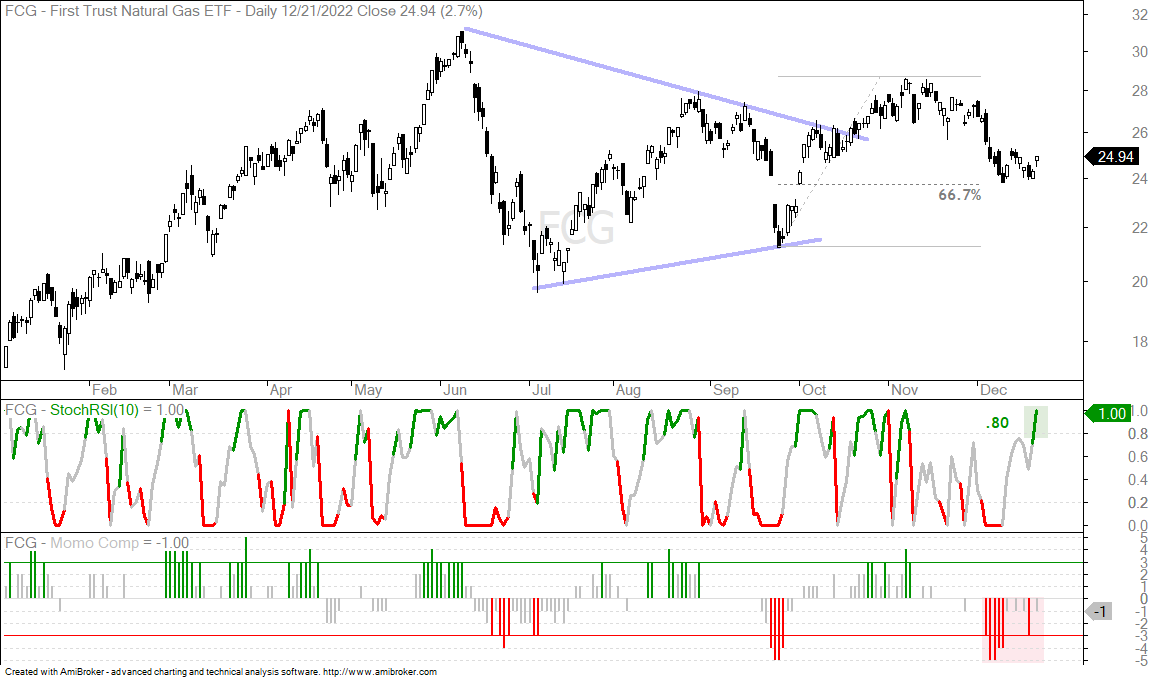
The next chart shows the Natural Gas ETF (FCG) with a similar setup.
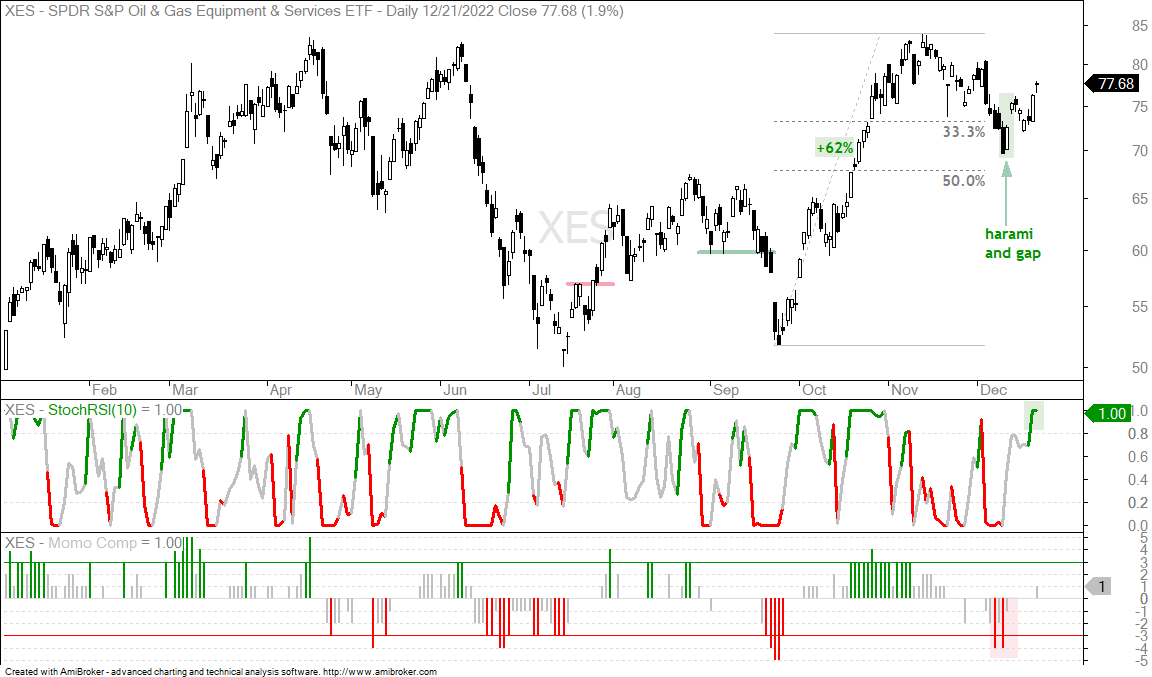
The next chart shows the Oil & Gas Equipment & Services ETF (XES) looking completely different over the last 12 months. Even so, XES is positively correlated to the others. XES surged with the group from mid September to mid November and corrected into mid December. The ETF formed a harami on December 12th and gapped up the next day. A harami represents an inside day or indecision that can foreshadow a reversal. The gap-surge confirmed this pattern. After a brief pullback last week, XES surged again this week and the short-term trend is up.
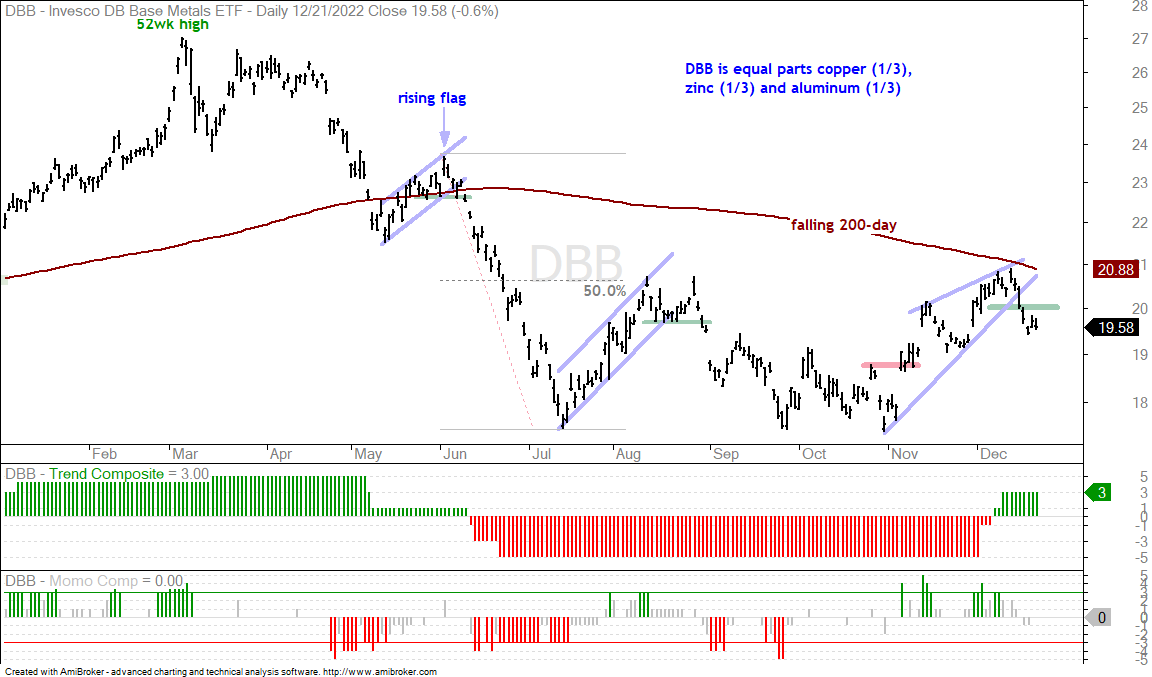
Copper Stalls and Base Metals Turn Lower (CPER, DBB)
The DB Base Metals ETF (DBB) reversed its short-term uptrend with a sharp decline below 20 last week. Note that this reversal occurred below the falling 200-day SMA.
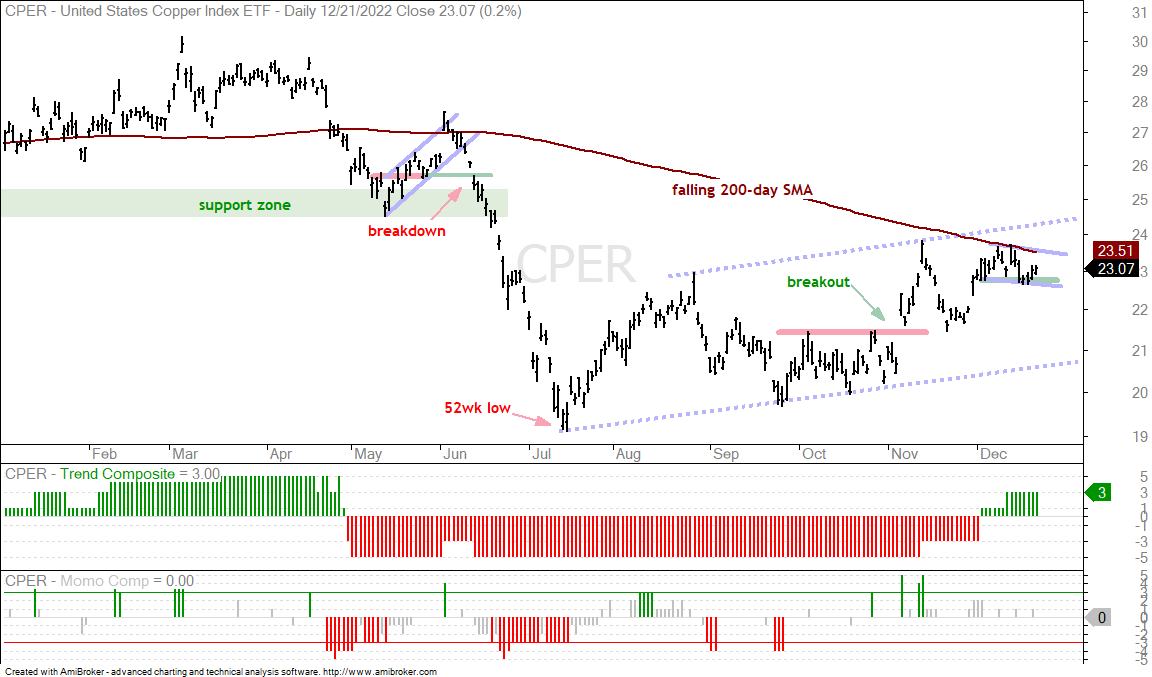
The next chart shows the Copper ETF (CPER) consolidating just below the falling 200-day SMA. This is a moment of truth for the metal. The consolidation could be a flag and a breakout at 23.6 would keep the uptrend alive. Failure to break the 200-day and a support break at 22.6 would be bearish.
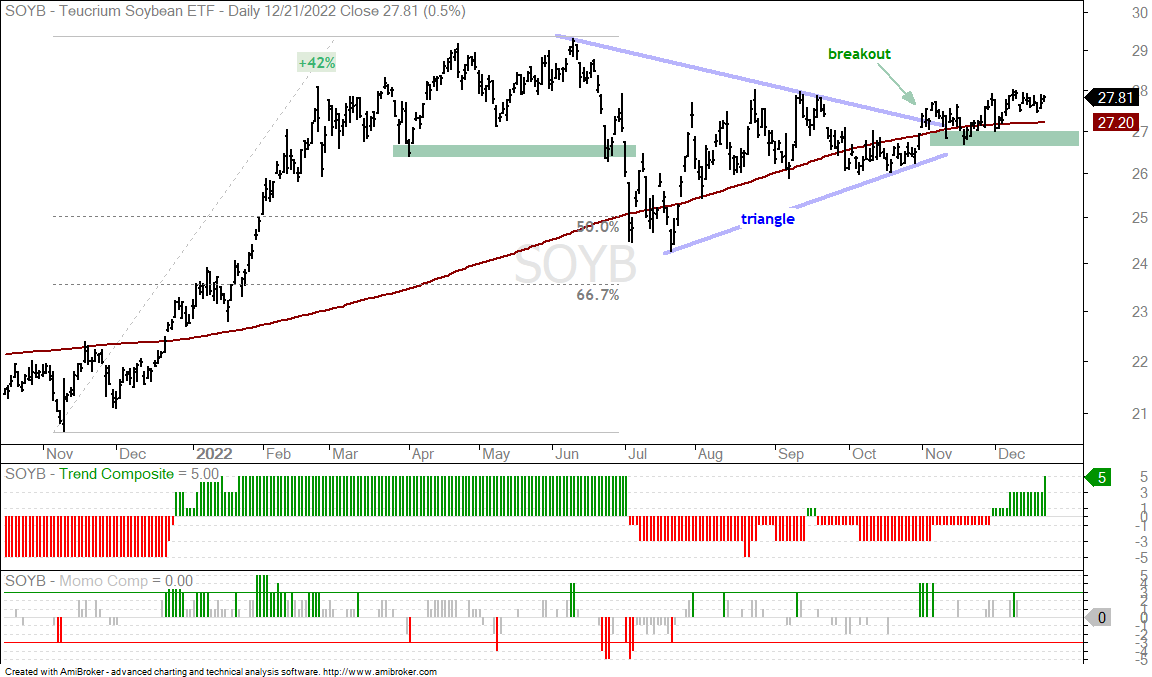
Soybeans Maintain Uptrend as Corn Firms (SOYB, CORN)
The Soybean ETF (SOYB) remains strong as it extends on its triangle breakout. The extension seems tepid, but the ETF is holding above the rising 200-day SMA for the most part. This triangle breakout signals a continuation of the prior 42% advance and the November lows mark support.
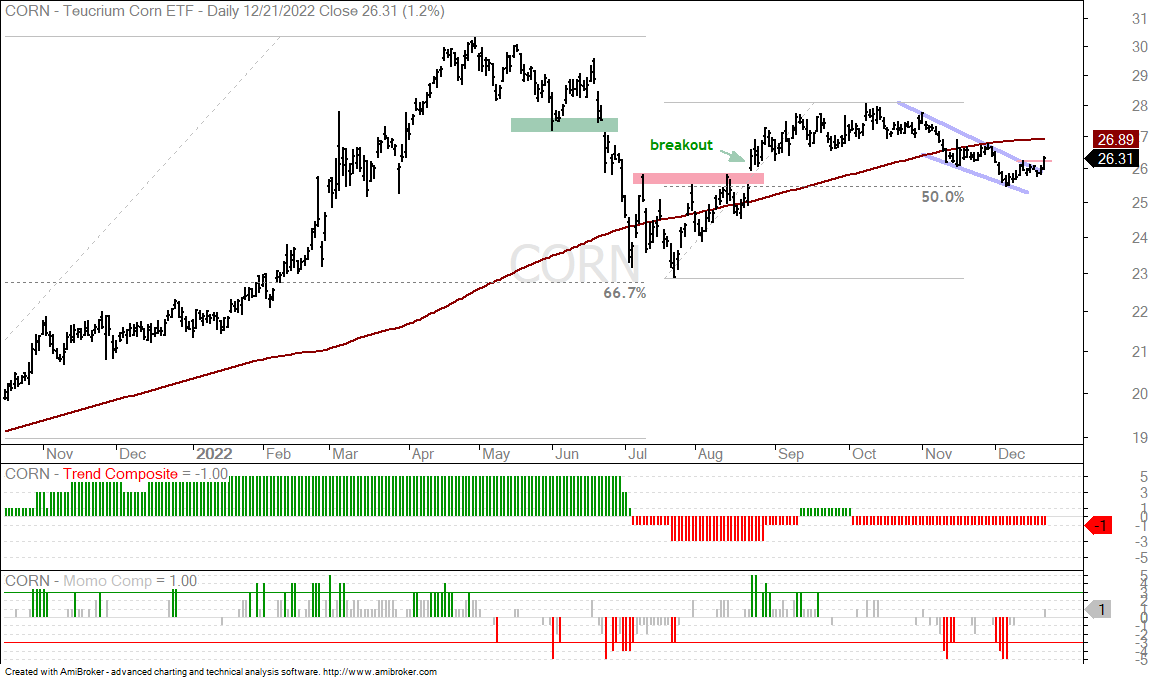
The next chart shows the Corn ETF (CORN) retracing 50% of the prior advance (July-October) with a falling wedge. CORN broke out of the wedge with a surge the last two days. This breakout signals a continuation of the prior advance and targets a move above the October high.
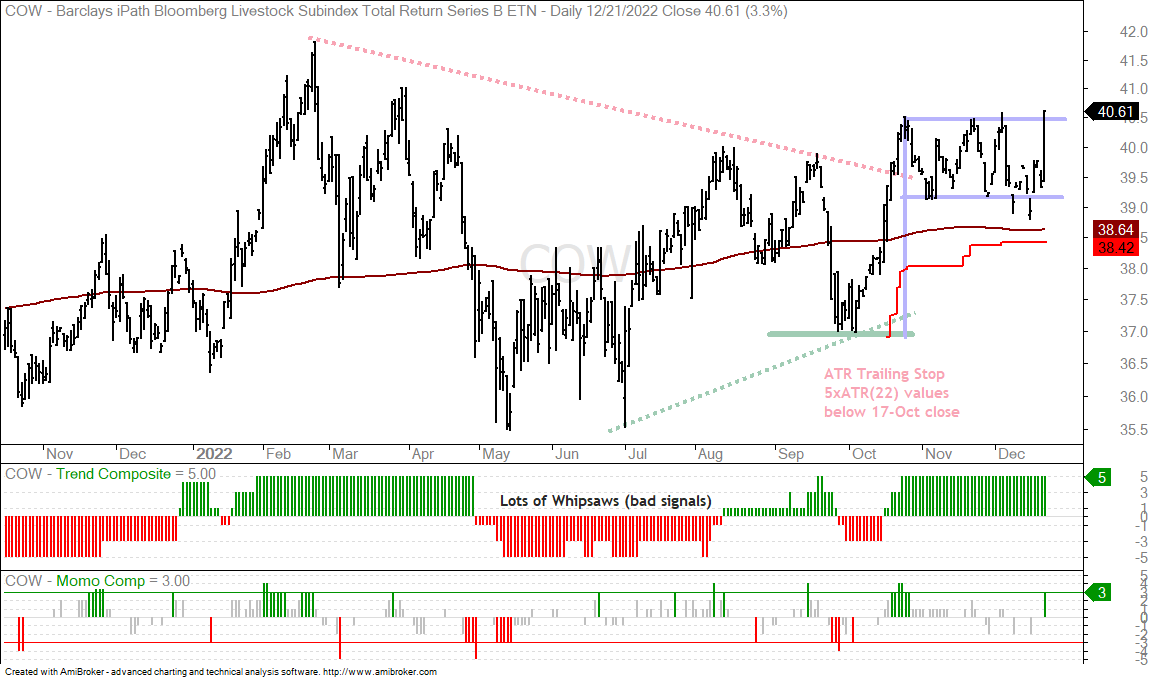
Livestock ETF Holds Up Trend and Trailing Stop (COW)
The Livestock ETF (COW) continues to perform well, despite recent volatility. Overall, COW broke out of a big triangle and the Trend Composite turned positive on October 17th. The ETF then moved into a trading range above the 200-day SMA and ATR Trailing Stop. This range was not a perfect flag, but the essence of the pattern is there: surge and consolidation. COW broke out with a surge above 40.5 and this signals a continuation higher.
")