Today’s update starts with the big three (SPY, QQQ, IWM) because they broke down to signal a continuation of their long-term downtrends. Moreover, the Composite Breadth Model turned negative and we are back in bear market mode. These conditions bode ill for most stock-based ETFs. While a few stock-based ETFs may buck the bear, it is extremely difficult to pick upside winners in a bear market. Defense is the name of the game during bear markets.
Programming Change this Week
Note that this week’s commentary schedule is a little different. I will cover the commodity related ETFs and a few others on Thursday. This week’s video will be on Friday, instead of Wednesday.
Tuesday – 20 Dec: Market Regime Update (CBM -3)
Tuesday – 20 Dec: ETF Report and Signal-Rank Table Update
Thursday – 22 Dec: ETF Report and Signal-Rank Table Update
Friday – 23 Dec: Market Regime and ETF Video
Saturday – 24 Dec: ETF Signal-Rank Table Update
Holiday Break
I will take a break between Christmas and New Year so there will not be any reports next week (December 26th to 30th). This is the time to put the market aside and spend time with loved ones. The normal schedule will resume on Tuesday, January 3rd. Merry Christmas and Happy New Year!!
About the ETF Trends, Patterns and Setups Report
This report contains discretionary chart analysis based on my interpretation of the price charts. This is different from the fully systematic approach in the Trend Composite strategy series. In this ETF Trends, Patterns and Setups report, I am looking for leading uptrends and tradable setups within these uptrends. While I use indicators to help define the trend and identify oversold conditions within uptrends, the assessments are mostly based on price action and the price chart (higher highs, higher lows, patterns in play). Sometimes the chart assessment can be at odds with the indicators.
Market Regime Update
I updated the Market Regime page because the Composite Breadth Model turned negative (-3). Note that I also addressed my concerns with the stock market in the December 6th report and broad market assessment. These concerns are coming to fruition. 2022 is clearly the year of the whipsaw and the bearish CBM signal was not completely unexpected.
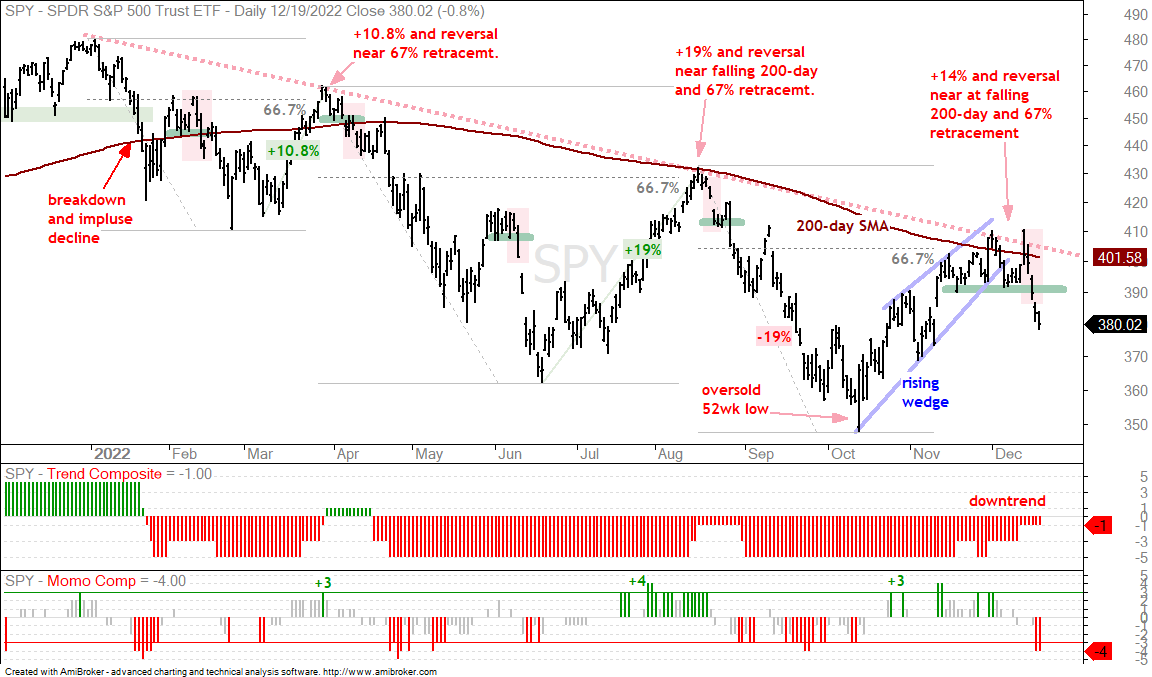
SPY Reverses For Third Time This Year
The S&P 500 SPDR (SPY) is clearly in a long-term downtrend here in 2022. The red dashed line connects lower highs throughout 2022 and the ETF recorded 52-week lows in September-October. Downtrends comprise lower lows and lower highs. There were three double-digit counter-trend advances in 2022 and all three failed near the 67% retracement lines (red arrows). All three resulted in lower highs. Most recently, SPY advanced some 14% from mid October to early December and reversed the counter-trend advance with a break below 390. The retracement amount (2/3) and pattern (rising wedge) are typical for bear market bounces. This breakdown signals a continuation of the bigger downtrend and I expect a test of the fall lows, at the very least.
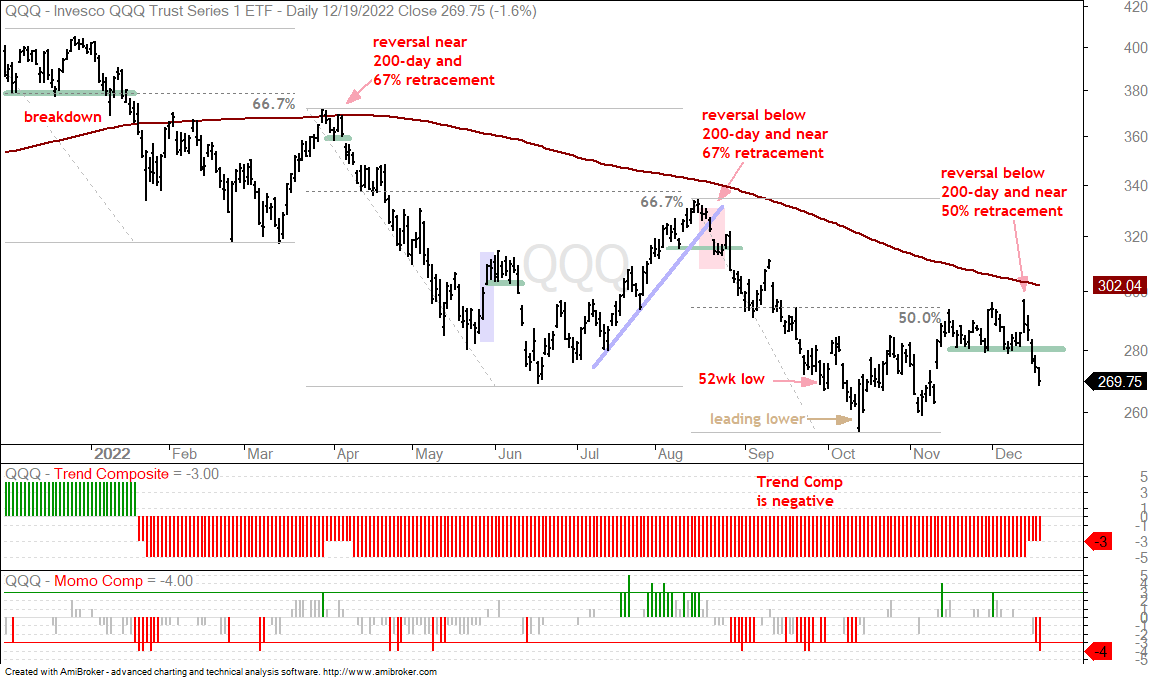
QQQ Lags as IWM Breaks First
The next chart shows QQQ trending lower and lagging the broader market. While SPY retraced 67% of the August-October advance and tagged the 200-day SMA, QQQ retraced just 50% and did not come close to the 200-day SMA. QQQ led lower with the 52-week low in September and lagged on the rebound. The ETF broke short-term support on Thursday to signal a continuation of the bigger downtrend. I expect new lows because this bigger downtrend is the dominant force at work.
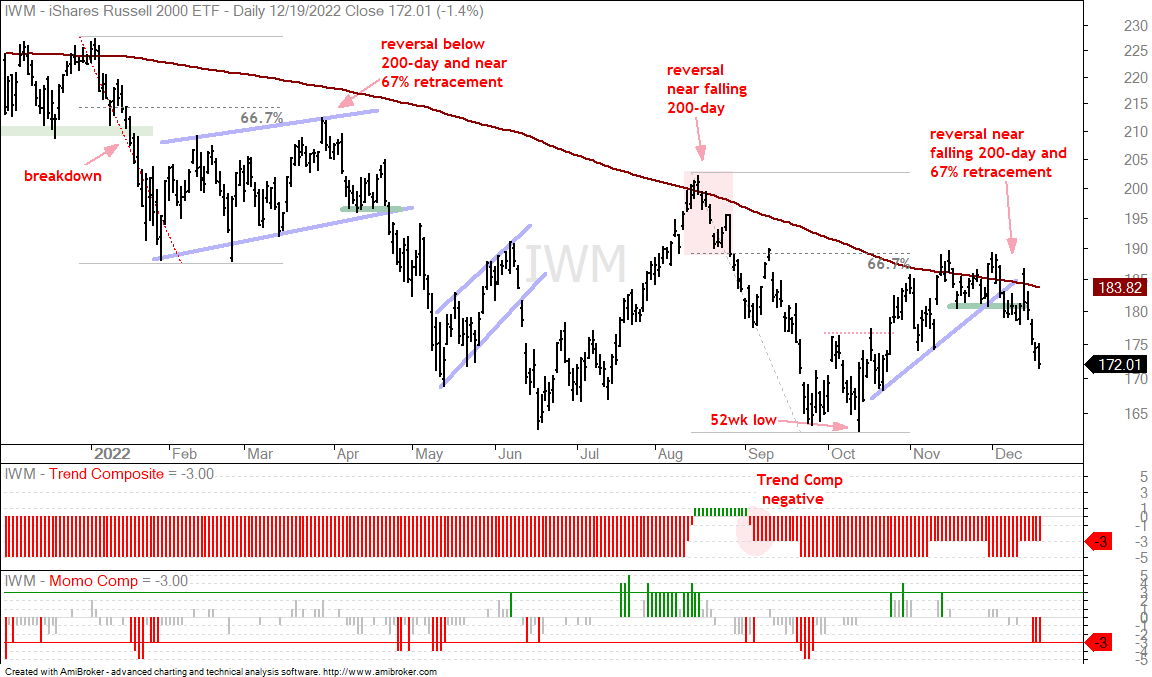
The next chart shows IWM with its third reversal this year. IWM hit the falling 200-day SMA in mid November, stalled for a few weeks and broke down on December 6th, which was seven days before SPY broke short-term support. Overall, the big three are in long-term downtrends and have short-term trend reversals working.
You can learn more about my chart strategy in this article covering the different timeframes, chart settings, StochClose, RSI and StochRSI.
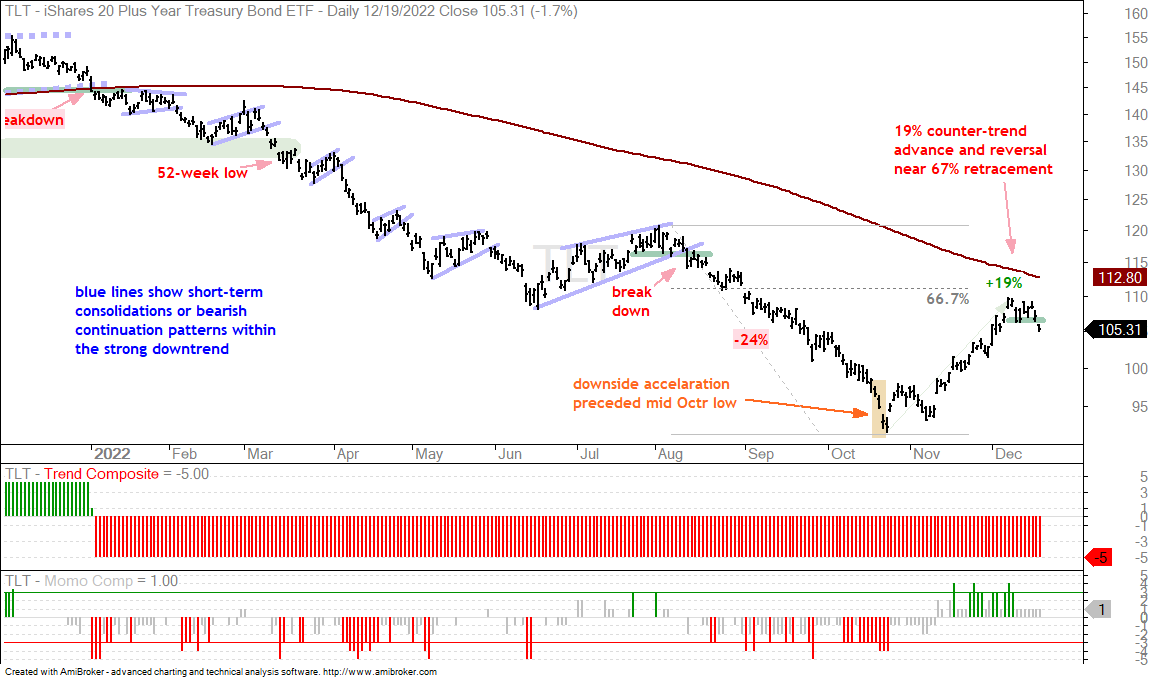
Treasury Bond ETF Breaks Short-term Support (TLT, $TNX)
Stocks and bonds are positively correlated in 2022, which means they are moving in the same direction. Correlations are subject to change, but the 20+ Yr Treasury Bond ETF (TLT) also broke short-term support with a sharp decline the last two days and remains aligned with SPY. The chart below shows TLT retracing around 2/3 of its prior decline (-24%) and breaking short-term support (green line). TLT is also below its falling 200-day SMA and in a long-term downtrend. The short-term trend reversal, therefore, signals a continuation of the long-term downtrend and TLT continues to move with SPY.
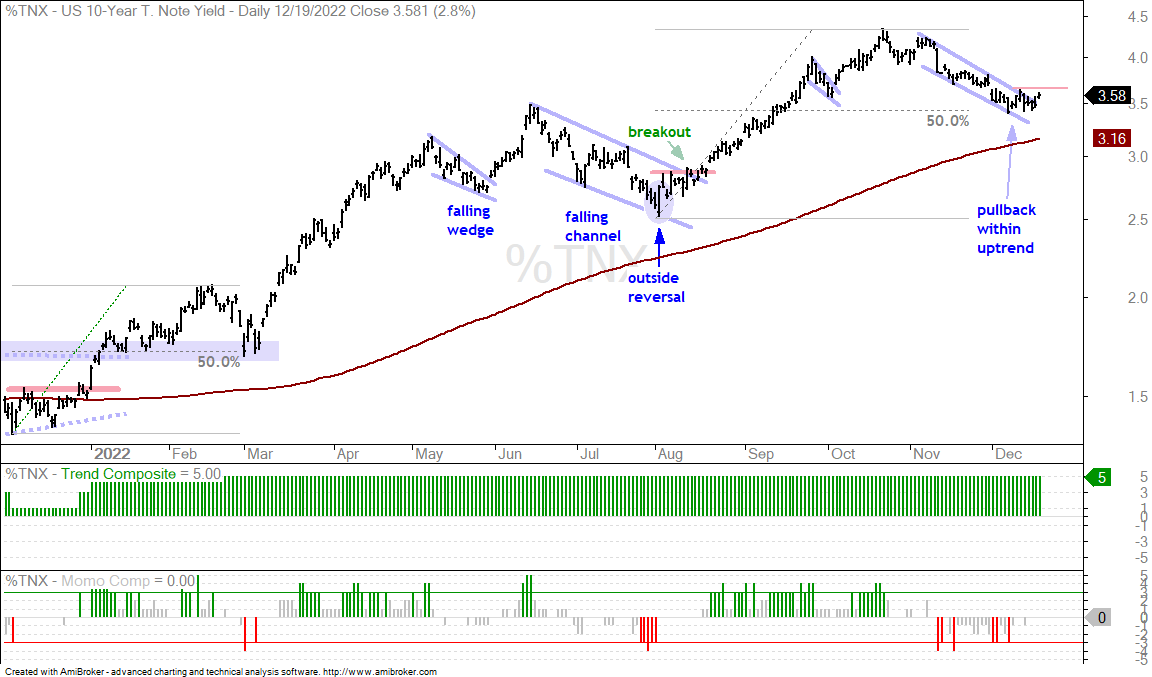
The next chart shows the 10-yr Treasury Yield retracing half of its prior advance with a falling wedge. The yield turned up as TLT fell, but remains just shy of a breakout. A move above 3.65 would reverse the short-term downtrend and signal a continuation higher.
Dollar and Yields Negatively Correlated to Gold (UUP, GLD)
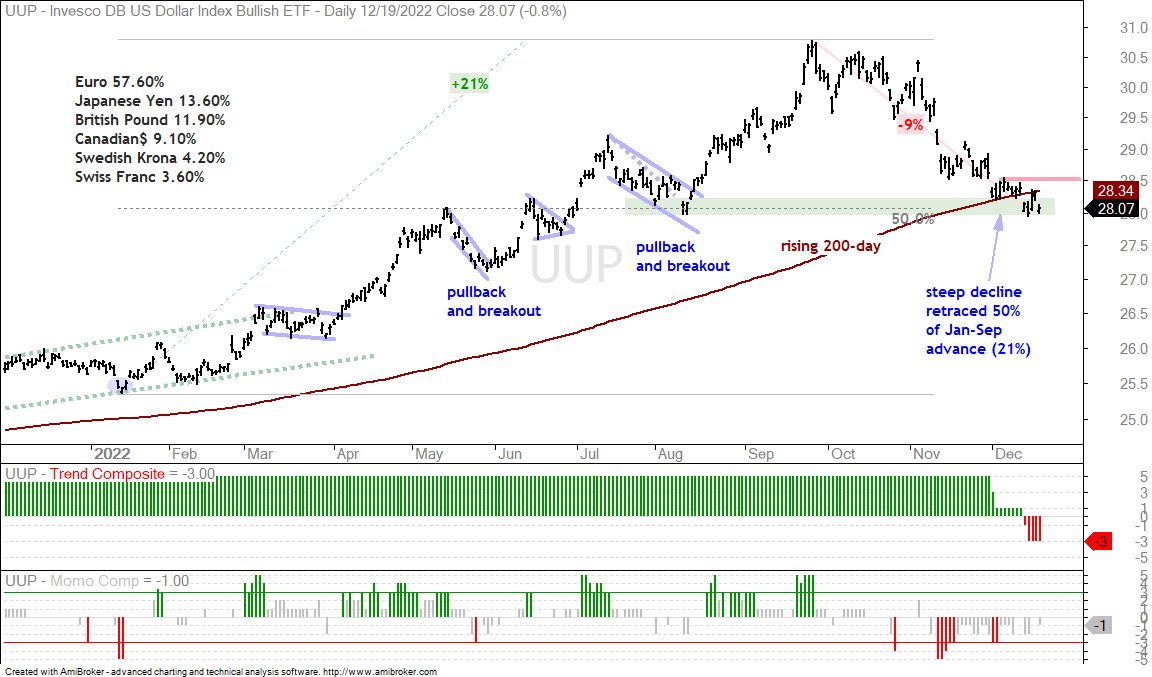
The Dollar Bullish ETF (UUP) was negatively correlated with SPY, but did not bounce or reverse its short-term downtrend. This is perhaps a sign that the relationship is changing. In any case, we still need to take signals from the price chart of the underlying. The 9% decline since late September is one of the biggest ever and the long-term trend could be reversing. UUP is below the 200-day and the Trend Composite is negative. UUP is still near the summer lows and not far from its rising 200-day SMA. A breakout at 28.5 would reverse the three month downtrend and perhaps keep the long-term uptrend alive.
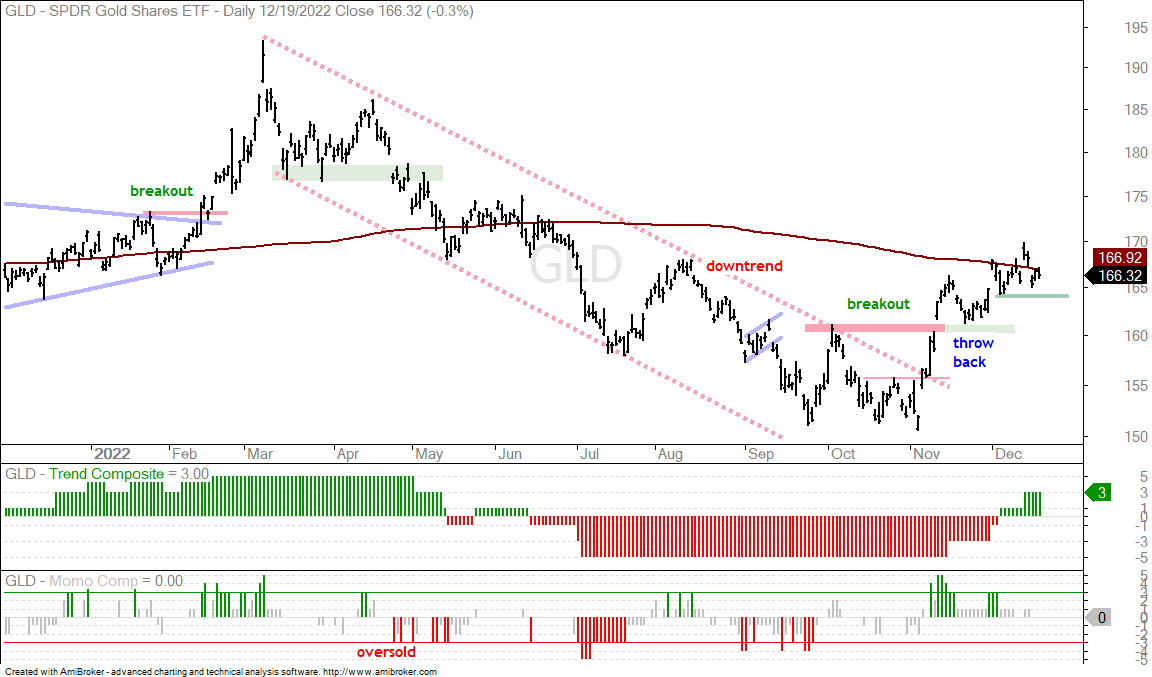
The 10-yr Treasury Yield and Dollar are positively correlated (moving in the same direction). Gold is negatively correlated to these two because it rose from early November to late December. GLD broke resistance on November 10th and held this breakout after a throwback. I am focused on the upswing since early November and marking support at 164. The bulls have the edge above this level. A support break at 164 would suggest a failure at the falling 200-day SMA and be bearish for bullion.
The Trend Composite aggregates signals in five trend indicators: Bollinger Bands (125,1), Keltner Channels (125,2), 5-day Rate-of-Change of 125-day SMA, StochClose (125,5) and CCI-Close (125). The Trend Composite and ten other indicators are part of the TIP Indicator Edge Plugin for StockCharts ACP
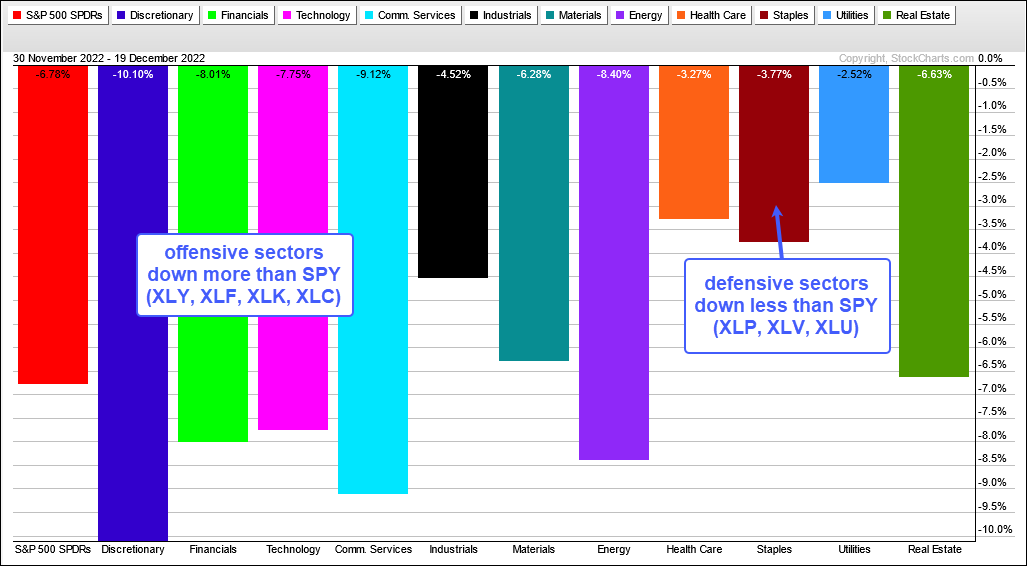
There are 274 ETFs in the Master List. 168 are stock-based ETFs, 48 are non-stock ETFs (bonds, commodities, currencies) and 58 are non-US ETFs (53 stocks and 5 non-stock). SPY is down 5.46% the last four days and only 4 ETFs (1.4%) are up during this period (TUR, CANE, EWZ, COW). SPY is down 6.78% in December and only 29 ETFs (10.5%) are up so far this month (13 trading days). ETFs related to bonds, currencies (non-Dollar) and China are bucking the US stock market this month. All eleven sector SPDRs are down with XLY (-10%), XLC (-9%), XLE (-8.4%) and XLF (-8%) leading the way lower.
Even the defensive XLV is down 3.27% so far this month. XLP and XLU, two other defensive sectors, are down 3.77% and 2.52%, respectively. The lesson here: very few stock-based ETFs are immune to broad market moves, especially when counter-trend advances reverse. Defensive ETFs usually decline less and outperform, but they rarely escape the gravitational pull of a bear market.
You can learn more about exit strategies in this post, which includes a video and charting options for everyone.
Outperforming ETFs Under Pressure
XLU, PHO, XLV, IHF, IBB, PPA, KIE, IGN, SDY
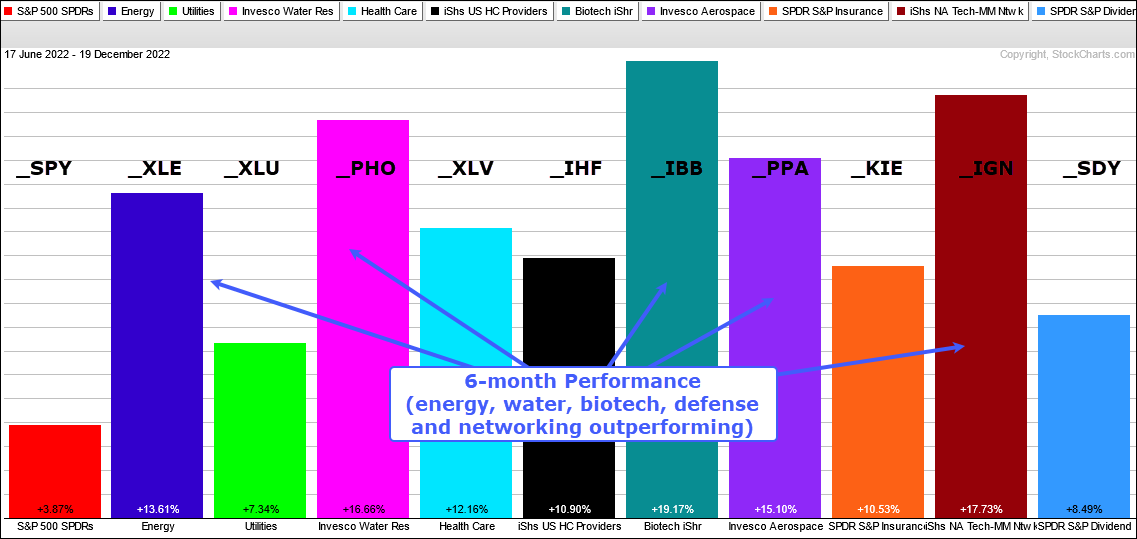
I remain focused on a group of ETFs that are holding up better than the market here in 2022 and are even up over the last six months. Even so, these ETFs are still stock-based ETFs and still vulnerable to broad market swings, especially violent swings.
The PerfChart below shows six month performance for SPY and nine ETFs that outperformed and advanced since June 17th. These ETFs are the Energy SPDR (XLE), Utilities SPDR (XLU), Water Resources ETF (PHO), Healthcare SPDR (XLV), Healthcare Providers ETF (IHF), Biotech ETF (IBB), Aerospace & Defense ETF (PPA), Insurance ETF (KIE), Networking ETF (IGN) and Dividend SPDR (SDY).
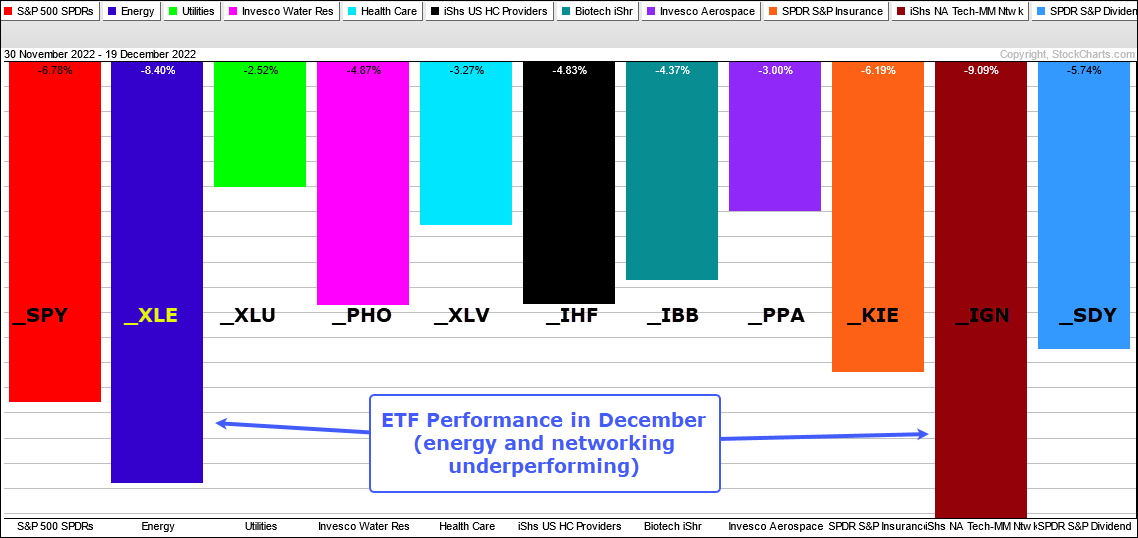
These same ETFs are down between 2 and 7 percent the last four days and down between 2.5 and 9 percent this month (13 days). The Energy SPDR (XLE) and Networking ETF (IGN) are down more than SPY and underperforming this month. Energy stocks are down because the stock market is weak and oil is down. IGN was holding up better than other tech-related ETFs, but succumbed to broad market selling pressure and sector weakness.
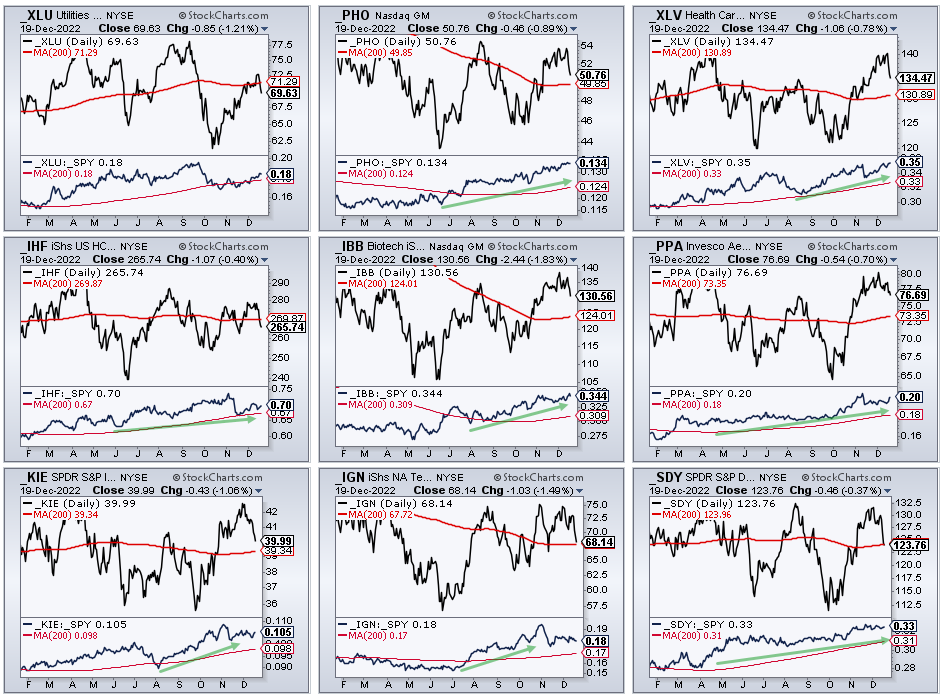
The next chart shows these ETFs with their 200-day SMAs and price-relatives (_XLU:_SPY ratio). Six are above their 200-day SMAs and three are below after sharp declines the last four days. The price-relatives in the lower windows are above their 200-day SMAs and mostly rising as these ETFs hold up better than SPY. Even though they are holding up better, they would likely fall further should the S&P 500 test its summer lows in the coming weeks or months.
You can learn more about my chart strategy in this article covering the different timeframes, chart settings, StochClose, RSI and StochRSI.
")