Market and ETF Report – ETFs to Watch for Clues on the Broader Market, Intermarket Relations at Work Now (Premium)

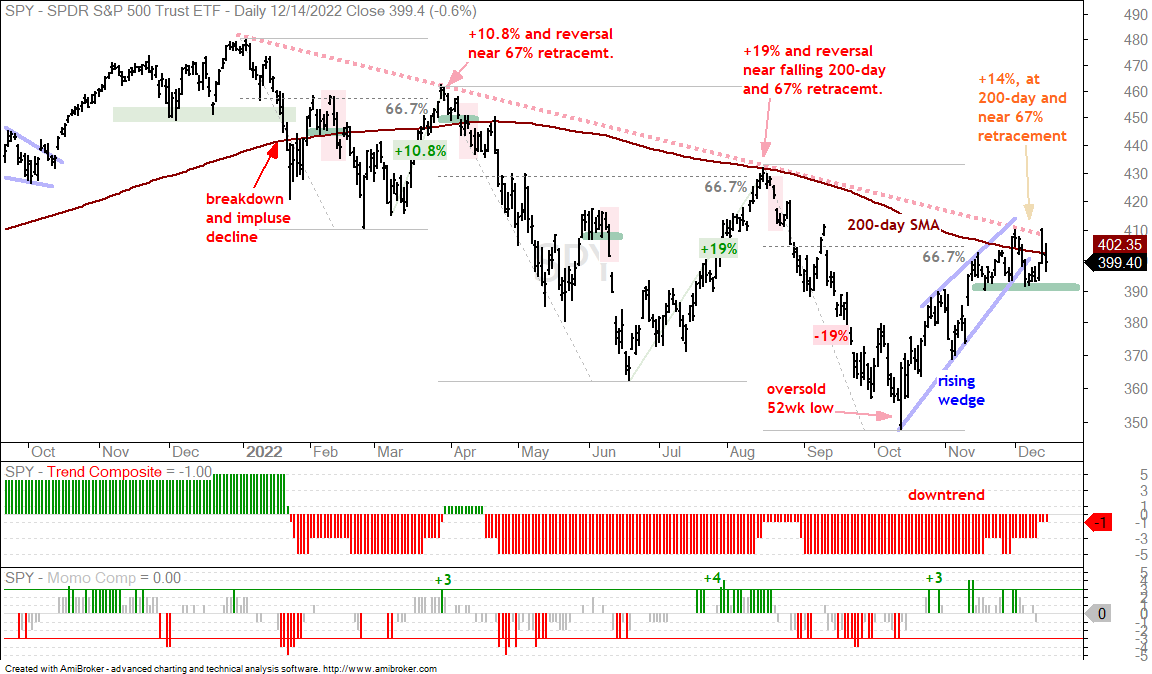
The weight of the evidence favors the bulls because the Composite Breadth Model is positive, but the stock market is as divided as ever. Today’s report will show three different ETF groups: the lead group holding support, the weak group breaking support and the lagging group that never broke out. There is one strong group and two weak groups. We will then cover the leading ETFs with big moves over the last two months and rising price-relatives. Most of these, however, are quite extended. Even though they are leading, they are still susceptible to broad market swings and a break down in SPY would be negative for most stock-based ETFs. I will, of course, cover SPY in detail.

About the ETF Trends, Patterns and Setups Report

This report contains discretionary chart analysis based on my interpretation of the price charts. This is different from the fully systematic approach in the Trend Composite strategy series. In this ETF Trends, Patterns and Setups report, I am looking for leading uptrends and tradable setups within these uptrends. While I use indicators to help define the trend and identify oversold conditions within uptrends, the assessments are mostly based on price action and the price chart (higher highs, higher lows, patterns in play). Sometimes the chart assessment can be at odds with the indicators.

This Week's Publishing Schedule

  • Tuesday – 13 December: Trend-Momo Bull-Bear ETF Strategy Update
  • Wednesday – 14 December Market-ETF Video and Market Regime Update
  • Thursday – 15 December: Market-ETF Report and Signal-Rank Table Update
  • Saturday – 17 December: ETF Signal and Rank Table

SPY Battles 200-day and Holds Short-term Support

The CPI Report and the Fed have come and gone. SPY surged above 410 in response to Tuesday morning’s CPI report, but gave most of the gain back to close at 402. The ETF was up and down with modest moves on Wednesday and finished with a small loss. Overall, the trend remains down for SPY because it forged a 52-week low in October, did not exceed the August high and did not convincingly break the 200-day SMA. In fact, the ETF has been trading anear the 200-day SMA for a month now and can’t seem to decide which way to go. It can either punch through the 200-day SMA in convincing fashion or fail at the 200-day and reverse the short-term uptrend.  

SPY is consolidating in a classic resistance-reversal zone. The current advance retraced around 2/3 of the prior decline, which is normal for a counter-trend move. We can also consider the 200-day as resistance for the S&P 500 and SPY. A rising wedge formed and this pattern is also typical for counter-trend bounces. This is a classic bearish setup. A support break at 390 would reverse this upswing and signal a continuation of the bigger downtrend.

A Shot Across the Bow

SPX %Above 20-day SMA fired the first shot across the bow as it plunged below 60% on December 6th. The blue shading on the price chart shows when %Above 20-day SMA becomes overbought and stays overbought. The red arrows show when the indicator breaks 60%. The middle window shows the indicator plunging to 38% on December 9th and bouncing back as SPY bounced. The bearish signal remains in place and would be negated with another move above 80%. For bearish confirmation, watch for %Above 50-day SMA to break 60%.

Intermarket Charts Supporting the Q4 Uptrend

SPY is in an uptrend since mid October and a reversal could affect bonds, yields, the Dollar, the Euro and gold. These are the inter-market relationships at work. Even though correlations are fluid and subject to change, they are working right now and warrant our attention. The relationships are:

  • Treasury Bond Uptrend (positive correlation with SPY)
  • Treasury Yield Downtrend (negative correlation with SPY)
  • Dollar Downtrend (negative correlation with SPY)
  • Euro Uptrend (positive correlation with SPY)
  • Gold Uptrend (positive correlation with SPY, negative with Dollar)  

The first chart shows the 20+ Yr Treasury Bond ETF (TLT) advancing some 19% off the mid October low and hitting a retracement-reversal zone. TLT started from a 52-week low and remains well below the summer high. Thus, this is considered a counter-trend bounce within a bigger downtrend. A support break at 105 would reverse this short-term uptrend and signal a continuation lower.

The next chart shows the 10-yr Treasury Yield with a mirror image. A breakout at 3.65% would reverse the short-term downtrend and signal a continuation of the bigger uptrend.

The Trend Composite aggregates signals in five trend indicators: Bollinger Bands (125,1), Keltner Channels (125,2), 5-day Rate-of-Change of 125-day SMA, StochClose (125,5) and CCI-Close (125). The Trend Composite and ten other indicators are part of the TIP Indicator Edge Plugin for StockCharts ACP

2022 is the year of big counter-trend moves that seemingly reversed big trends, but ultimately resulted in whipsaws. This could happen to the Dollar Bullish ETF (UUP) right now. The next chart shows UUP falling 9% since late September and breaking the 200-day SMA. The Trend Composite also turned negative for UUP and positive for the Euro ETF (FXE). The trend since September is clearly down and perhaps the long-term uptrend also reversed. Even so, I am watching for a possible reversal because the decline retraced half of the Jan-Sep advance and the ETF is still near the rising 200-day. Maybe this is an overshoot. A breakout at 28.6 would reverse the short-term downtrend. Note that the European Central Bank puts out its policy statement today so the Euro could be volatile.

The Gold SPDR (GLD) broke resistance with a big surge in the first half of November and continued higher into mid December. Gold is positively correlated with SPY and TLT, while negatively correlated to $TNX and UUP. An upside breakout in the 10-yr Treasury Yield would be positive for the Dollar and a breakout in the Dollar would be negative for gold. I am watching the December 5th low for the first signs of a reversal. A support break at 164 would reverse the short-term uptrend.

You can learn more about my chart strategy in this article covering the different timeframes, chart settings, StochClose, RSI and StochRSI.

ETFs Holding Support and Supporting the Market

SPY is above short-term support, and so are several other key ETFs. These include QQQ, RSP, MDY, XLK, XLI, XLP, SOXX, ITB and XRT. We should watch these ETFs for clues on the health of the broader market. They are holding up now, but short-term support breaks would weigh on SPY and likely lead to a support break in this key market barometer.

The first chart shows QQQ surging above 280 in mid November and then stalling with a trading range the last five weeks. QQQ did not follow through on this surge, but it remains above support (green line). Overall, the long-term trend is down and QQQ is near the 50% retracement line, which is a potential reversal zone. A support break would reverse the short-term downtrend and weigh on SPY because Nasdaq 100 stocks account for around 35% of the S&P 500.

The next chart shows the Technology SPDR (XLK) with a counter-trend bounce that retraced 50-67% of the prior decline. A support break at 129 would reverse this upswing.

The next chart shows the Semiconductor ETF (SOXX) falling 30% and then surging 30% (closing prices). Despite identical percentage moves, SOXX remains well below the August high. It would take a 43% advance to fully recover from a 30% decline. SOXX is near its 200-day SMA and above support at 360. This is the make or break area for the counter-trend bounce. A support break would reverse the short-term uptrend and keep the bigger downtrend in play.

The next chart shows the S&P MidCap 400 SPDR (MDY) surging above its 200-day SMA in mid November and then stalling just below the August high. A support break at 449 would reverse the short-term uptrend.

The next chart shows the Industrials SPDR (XLI) with one of the biggest surges since mid October (+20% in 34 days). A break below 98 would reverse this short-term uptrend.

The next two charts capture important parts of the economy: housing and retail. Black Friday has come and gone, and the Retail SPDR (XRT) continues to struggle below its falling 200-day SMA. As with several other ETFs, the October-December bounce retraced 50-67% of the prior decline and the ETF then stalled the last five weeks. A support break at 63 would be short-term bearish. Should support hold, a flag is possible and a break above 67.5 would be bullish.

The next chart shows the Home Construction ETF (ITB) with support at 58.

ETFs That Broke Support and Are Weighing on the Market

Several ETFs broke short-term support recently and they are weighing on the market. These ETFs represent two groups: small-caps and finance. They include IJR, IWM, IWC, XLF, KRE and KBE. Financials is the biggest sector in the S&P SmallCap 600 SPDR (18%) and Russell 2000 ETF (16.9%). The recent breakdown in the Regional Bank ETF (KRE) is clearly weighing on small-caps. The first chart shows IWM failing at the 200-day SMA and 67% retracement as it broke short-term support last week. This break reverses the short-term uptrend and signals a continuation of the bigger downtrend.

The next chart shows the Regional Bank ETF (KRE) breaking down last week and continuing sharply lower this week. KRE reversed the upswing from late September to mid November with a support break at 62 on December 5th (red shading). The ETF continued lower and broke the September-October lows on Wednesday. There is also a large triangle break and this signals a continuation of the long-term downtrend. This is one ugly chart.  

The breakdown in the Regional Bank ETF is clearly a negative for the Finance SPDR (XLF). Banks account for 32.26% of XLF, but I am not sure what percentage are regional banks. The chart below shows XLF with a 34-day 20% surge and move above the August high. As with XLI, this was one of the strongest moves from mid October to late November. XLI is still holding up, but XLF is cracking as it broke short-term support marked by the November low.

ETF that Are Lagging and Not Taking Part

The first group showed ETFs that are holding support and supporting the market, for now. The second group showed ETFs that already broke down and these could foreshadow broader weakness in the market. The third group highlights ETFs that did not breakout and are lagging the last two months. These include XLY, XLC, SKYY, CIBR, FINX, FDN and IGV.

The first chart shows the Consumer Discretionary SPDR (XLY) falling to new lows in October and early November, surging above 140 in mid November and then stalling. XLY did not break above its October high and is seriously lagging the broader market. The ETF is testing short-term support from the late November low (green line) and a break here would be bearish. Should support hold, a break above the October-December highs would be bullish.

The next chart shows the Communication Services SPDR (XLC) with similar characteristics. Note that XLY accounts for 10% of SPY, XLC accounts for 7.35% and XLK accounts for 26.6%. Tech is still the 800 pound gorilla.

The CandleGlance chart below shows QQQ and five tech-based ETFs. All are lagging the broader market since August. The red lines mark resistance and they are all below resistance (downtrends). Resistance breakouts would be bullish, but breakouts are not expected because of relative weakness. FINX formed a small triangle and a break below the early December low would signal a continuation lower.

Sometimes the unexpected happens so here’s what to watch. Short-term, these ETFs surged in mid November (green shading) and then consolidated in some form (blue lines). SKYY, FDN and IGV formed possible flags and breaks above the early December highs would be bullish.

Leading ETFs, but Quite Extended

The leading ETFs are mostly defensive with representatives from utilities, healthcare and consumer staples. These include XLU, XLV, IGN, KIE, PPA, PBJ, IHF, PHO and SDY. SPY is up 1.08% since November 13th and these ETFs are up between 1.46% (SDY) and 7.89% (XLU).

Even though these ETFs are outperforming the broader market, they are not immune to broad market swings. They usually fall when the S&P 500 falls, but they lose less and this is why they are outperforming over time. The price charts are quite similar as they show large trading ranges, several crosses of the 200-day SMA in 2022 and surges the last two months. The chart below shows the Utilities SPDR (XLU) falling 21.3% into mid October and surging 18.4% the last two months. Good luck finding a consistent and persistent uptrend on this chart. There is, perhaps, an uptrend, but it is with some wild swings.

The next chart shows the Healthcare SPDR (XLV) with a 15% advance off the October low. The green zone marks support to watch should we get a pullback.

The next chart shows the Healthcare Providers ETF (IHF) with a wedge breakout in late November and move back above the flat 200-day SMA. The ETF has gone nowhere for over a year, but it is outperforming because SPY is down 16% year-to-date.

The next chart shows the Aerospace & Defense ETF (PPA) with a monster move into mid November and a consolidation the last few weeks. It remains quite extended and I am marking pullback support in the 74 area.

The next chart shows the Networking ETF (IGN) with a surge and triangle. A triangle breakout would signal a continuation higher and keep the uptrend alive. A break below the December low would be negative.

The next chart shows the Water Resources ETF (PHO) with a breakout in late October and further gains into mid December. The breakout zone and 200-day mark first support to watch on a pullback. The indicator window shows the PHO:SPY ratio hitting a new high here in December.

The next chart shows the Biotech ETF (IBB) in a leading uptrend since summer. IBB exceeded the August high by a fraction and then consolidated the last five weeks, as did the market. A support break would argue for a pullback to the breakout zone and 50-67% retracement area. This is the first area to watch for a bounce.

Silver and Platinum Hold Breakouts (SLV, PLTM)

The Silver ETF (SLV) and Platinum ETF (PLTM) are likely to move in the same direction as gold. Silver is just gold on steroids and red bulls. The first chart shows SLV breaking resistance, consolidating around the breakout zone with a pennant and breaking out again on November 30th. SLV is now overextended after a 14% surge the last 12 days. The breakout zone turns first support to watch going forward.

The next chart shows PLTM with a breakout and a successful test of the breakout zone in the 9.5 area. The bulls rule as long as the breakout holds. A close below 9.5 would argue for a re-evaluation.

Rising Wedge Defines Base Metals Uptrend (DBB, plus CPER)

The DB Base Metals ETF (DBB) and Copper ETF (CPER) surged along with gold and silver. Yes, there seems to be a positive correlation with gold and the stock market, and a negative correlation with the Dollar. Watch these relationships for clues. DBB surged to the falling 200-day with a rising wedge and I am marking support at 20.

CPER also surged to the falling 200-day. The December lows mark first support and a break here would be the first sign of failure at the 200-day.

Previous Reports and Video

Wednesday: Market and ETF Video (here)

  • Composite Breadth Model Stays Positive
  • 10-day EMA of AD% Holds Key to CBM
  • Spreads Narrow and Balance Sheet Contracts
  • Three Items to Watch for Short-term Uptrend in SPY
  • Short-term Support Holds for QQQ, RSP and MDY
  • TLT Remains in Key Retracement Zone (plus $TNX)
  • Dollar Bullish ETF Breaks Rising 200-day
  • Gold Breaks Above 200-day SMA
  • New Trade for Trend-Momo Bull-Bear ETF Strategy (FXE for UUP)
  • Plenty of Downtrends Remain in Stock-Based ETFs
  • Medical Devices ETF Joins Healthcare with New Uptrend (IHI)
  • Healthcare SPDR Nears 2022 Highs (XLV)
  • Aerospace & Defense ETF Consolidates Near New High (PPA)
  • Biotech ETF Consolidates Near Summer Highs (IBB)
  • Healthcare Providers ETF Holds Breakout (IHF)
  • Water Resources ETF Extends on Uptrend (PHO)
  • Insurance ETF Pulls Back after New High (KIE)
  • Energy ETFs Get Oversold Bounce (XLE, XOP, FCG)
  • Home Construction ETF Extends on Breakout (ITB)
  • Semis Hold Support as Networking Consolidates after Surge (SOXX, IGN)
  • Watch Support for Tech, Industrials, Retail and Junk (XLK, XLI, XRT, JNK)
  • Watch Resistance for Tech-Based ETFs (SKYY, CIBR, FDN, IGN)
  • Autonomous EV and Auto ETFs Consolidate Below 200-day (DRIV, CARZ)
  • US Oil Fund Gets Oversold Bounce (USO, DBE)
  • Platinum Holds Breakout as Silver Surges (PLTM, SLV)
  • DB Base Metals and Copper ETFs Challenge 200-day SMAs (DBB, CPER)
  • Soybeans Break Out, Sugar Pops, Livestock Consolidates (SOYB, CANE, COW)

Wednesday: Market Regime Update with Breadth Model and Yield Spreads (here)

Tuesday: Trend-Momo Bull-Bear ETF Strategy Update (here)

You can learn more about my chart strategy in this article covering the different timeframes, chart settings, StochClose, RSI and StochRSI.

Thanks for tuning in and have a great day!
Scroll to Top