")
Stocks are attempting to firm here in October, but any firmness would be a consolidation within a bigger downtrend and any bounce would be considered a counter-trend bounce within a bigger downtrend. This goes for SPY, QQQ and IWM. In addition to a bearish Composite Breadth Model, I remain bearish on stocks because economically sensitive and high-beta groups are leading lower. Today’s report will highlight two ETFs from each group and then dive into energy-based ETFs, which are performing well. We will also cover Aerospace & Defense, Base Metals and Agriculture.
About the ETF Trends, Patterns and Setups Report
This report contains discretionary chart analysis based on my interpretation of the price charts. This is different from the fully systematic approach in the Trend Composite strategy series. In this ETF Trends, Patterns and Setups report, I am looking for leading uptrends and tradable setups within these uptrends. While I use indicators to help define the trend and identify oversold conditions within uptrends, the assessments are mostly based on price action and the price chart (higher highs, higher lows, patterns in play). Sometimes the chart assessment can be at odds with the indicators.
This Week's Commentary Schedule
- Tuesday – 18 October: Market-ETF Report and Signal-Rank Table Update
- Wednesday – 19 October Market-ETF Video and Market Regime Update
- Thursday – 20 October: Market-ETF Report and Signal-Rank Table Update
- Saturday – 22 October: ETF Signal and Rank Table
The Momentum Composite aggregates signals in five momentum-type indicators to identify short-term overbought and oversold conditions. This indicator is part of the TIP Indicator Edge Plugin for StockCharts ACP
Economically Sensitive and Risk-On ETFs Lead Lower
(XRT, RCD, IGV, SOXX)
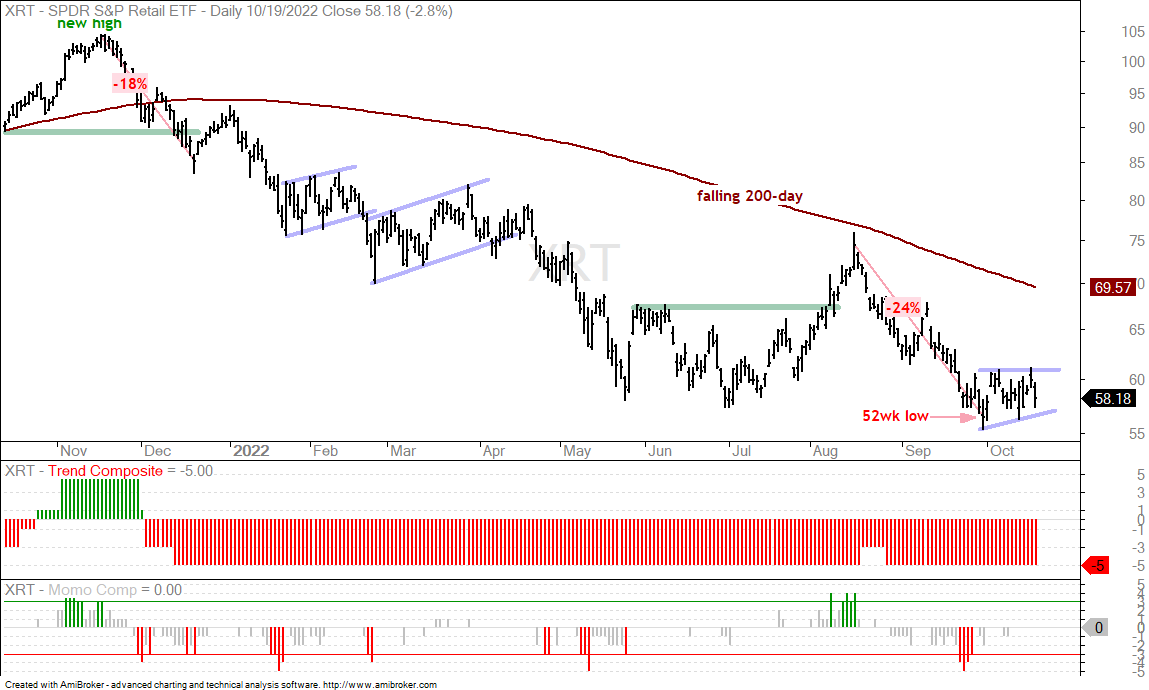
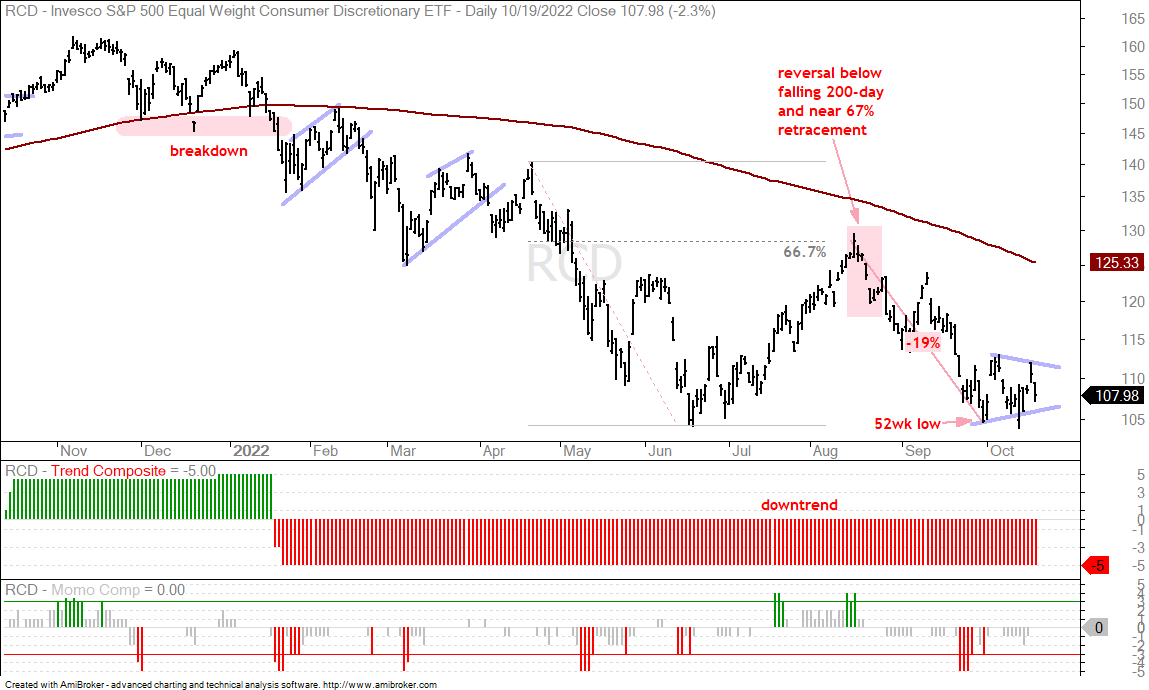
Stocks are firming here in October, but this firmness comes after several key ETFs hit 52-week lows in late September and became quite oversold. As noted in Wednesday’s video, the EW Consumer Discretionary ETF (RCD), Retail SPDR (XRT) and several tech-based ETFs recorded 52-week lows in late September and/or early October. Recent firming is occurring within a bigger downtrend and after big decline so I would not make much of it.
The charts below show XRT and RCD hitting 52-week lows in late September and then firming into October. XRT and RCD represent the economically sensitive groups and the new lows are negative. Shorter-term, they both became quite oversold after double digit declines into late September and are entitled to a bounce, even within long-term downtrends. A break above this week’s high would argue for a bounce, but any bounce would be considered a counter-trend move within a long-term downtrend (and bear market). Be careful with the siren song of short-term breakouts in a bear market.
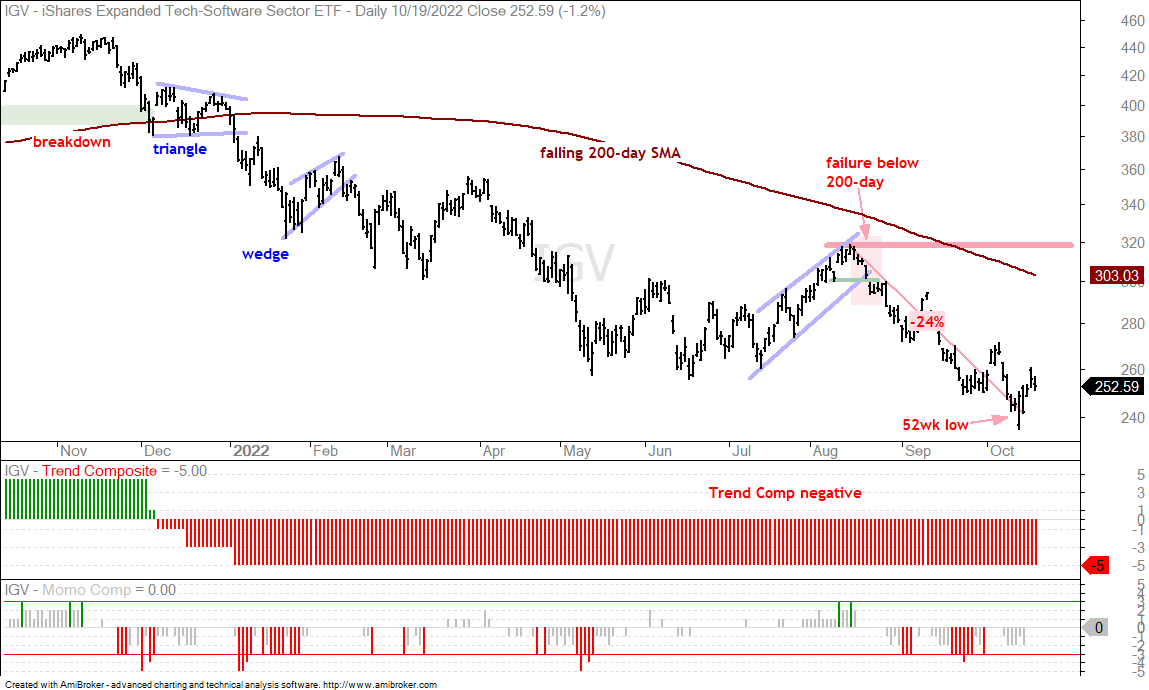
Tech-based ETFs represent the risk appetite in the stock market and the appetite for risk is not strong. The tech-based ETFs hitting new lows in late September and/or early October include cloud computing (SKYY), internet (FDN), fintech (FINX), cybersecurity (CIBR), software (IGV) and semis (SOXX). These ETFs were also quite oversold after sharp declines since mid August and could be get an oversold bounce within a bigger downtrend. The chart below shows the Software ETF (IGV) falling around 24% from mid August to early October and becoming quite oversold.
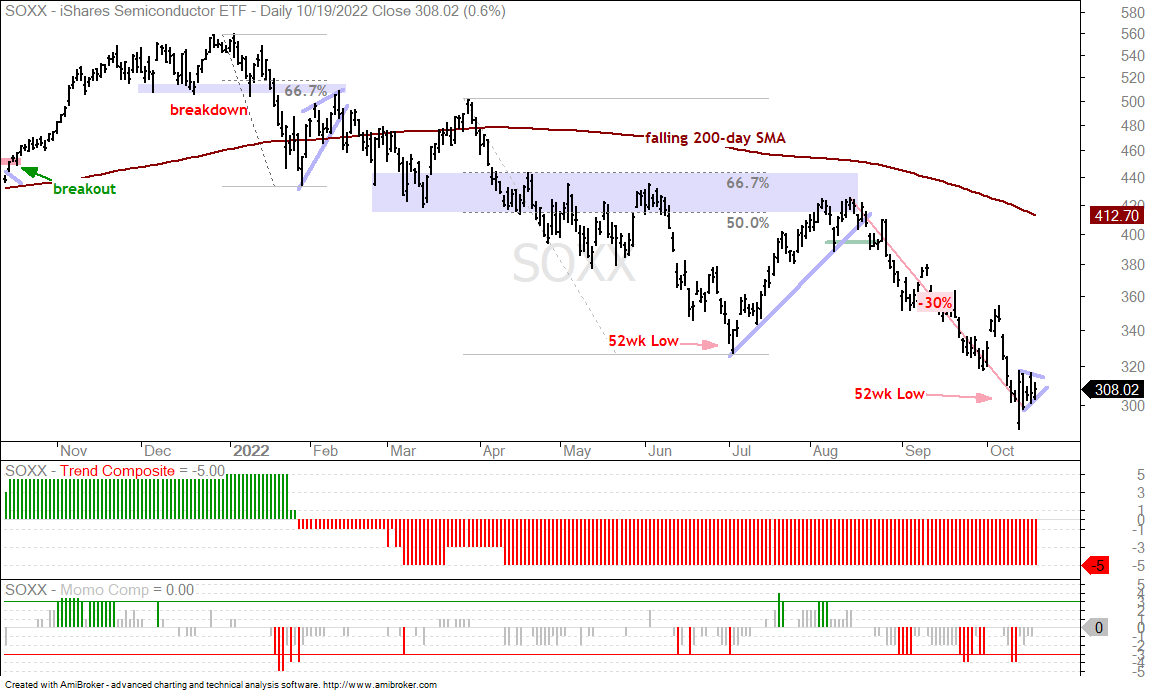
The next chart shows the Semiconductor ETF (SOXX) with a big outside reversal last Thursday and four inside days. The outside reversal shows strong intraday buying pressure after a weak open and the four inside days show indecision. A sort of pennant formed and a break above this week’s high would argue for an oversold bounce. Again, SOXX was down 30% and quite oversold so an oversold bounce would be pretty normal at this stage.
You can learn more about exit strategies in this post,
which includes a video and charting options for everyone.
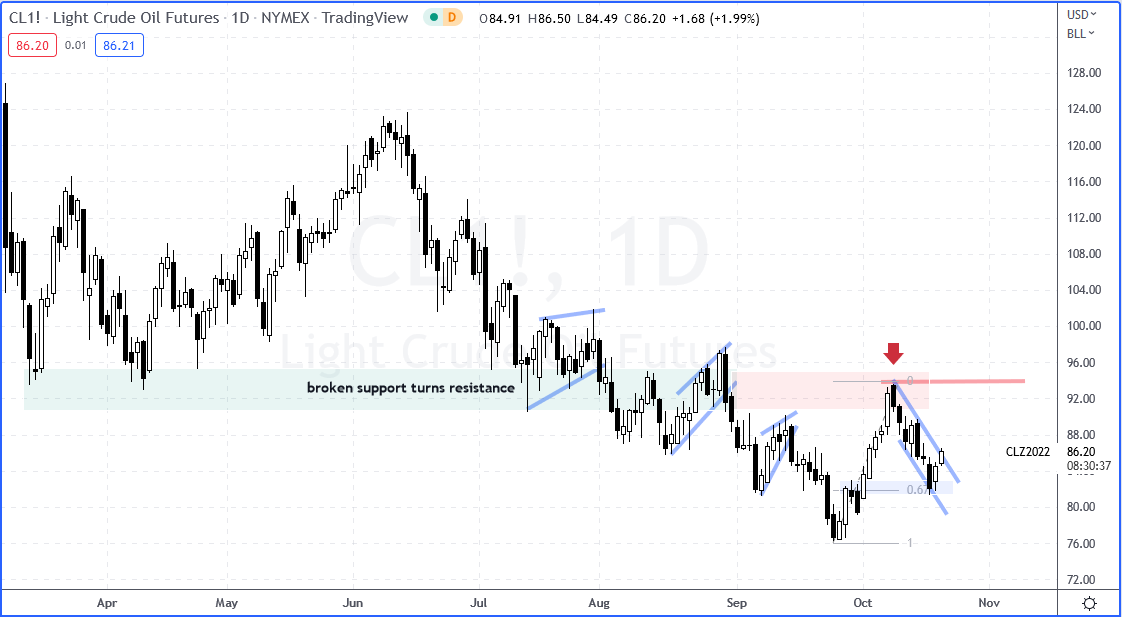
Oil Bounces as Energy-Based ETFs Break Out (CL1!, XLE, XES)
Oil bounced the last two days and a couple of energy-related ETFs broke out. The first chart shows Light Crude Futures (CL1!) within a downtrend since summer and a recent failure at broken support, which turned resistance (red zone). Despite the bigger downtrend, oil has a bullish short-term setup working. Oil fell from 94 to 82 (10-18 October) and this decline retraced around 2/3 of the prior advance. A falling channel also formed and oil is making a bid to break the upper line. The retracement amount is normal for a pullback after a big advance. Also notice that oil found support near the early October breakout zone (blue shading).
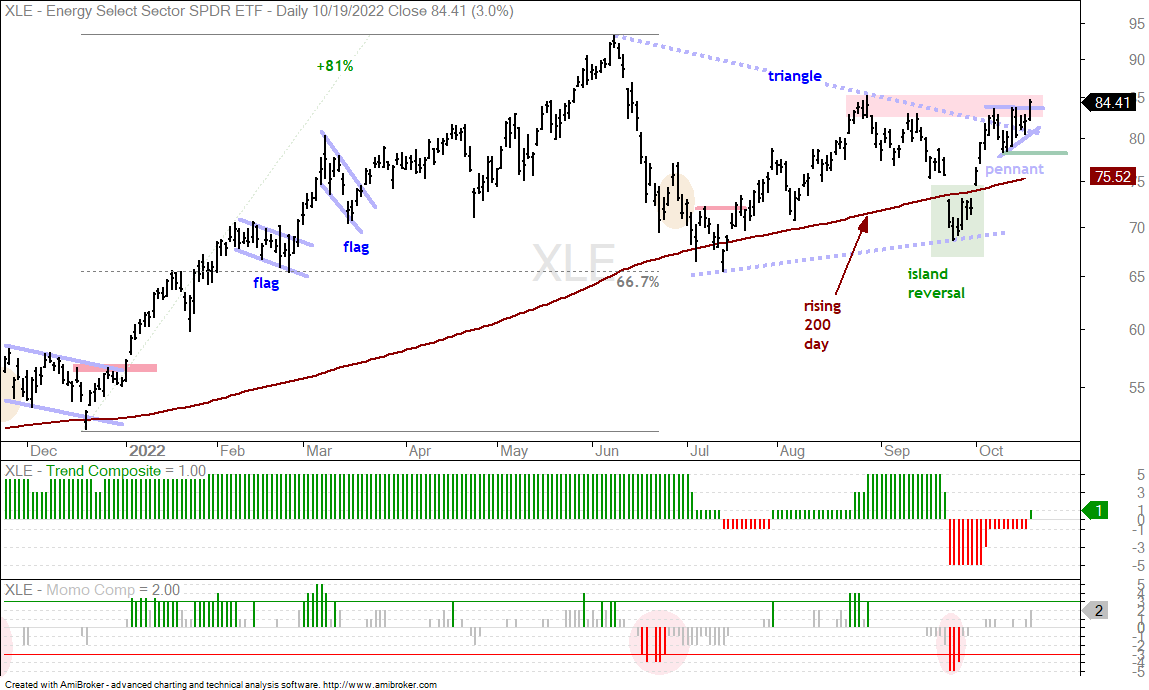
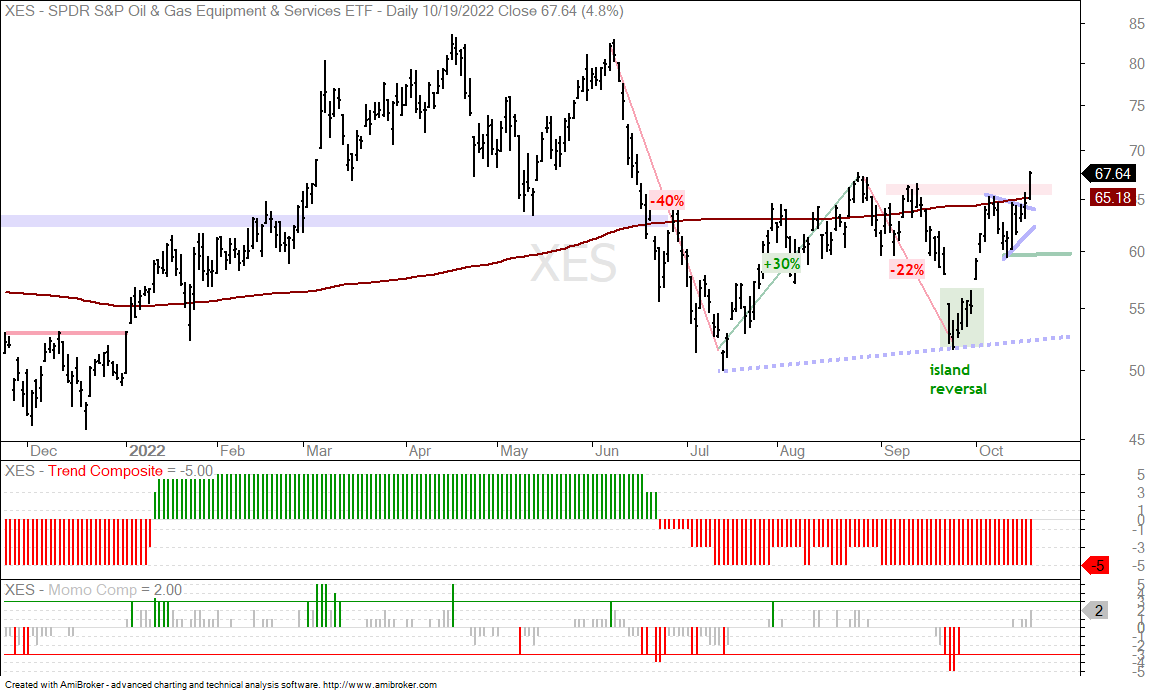
I am highlighting oil because energy-related ETFs held up well when oil fell and they are leading the market with recent breakouts. The Energy SPDR (XLE) broke out of a small triangle and the Oil & Gas Equipment & Services ETF (XES) exceeded its September highs. These were highlighted in Wednesday’s video. The first chart shows XLE with an island reversal in early October and surge to the resistance zone (red shading). I was suspect of this surge because oil moved lower the last two weeks and we are in a bear market. XLE, however, had other ideas and held up well with a pennant consolidation the last two weeks. The ETF broke out of this pennant with a surge on Wednesday and also broke the triangle line. These bullish developments were confirmed with the Trend Composite turning positive. The pennant lows mark first support to watch going forward.
The XES chart is more of a challenge to analyze because the swings are big, really big. This makes for excessive moves on both sides, but the ETF is still highly correlated to XLE and will move in the same direction. Ditto for XOP and FCG. XES is the high-beta alternative with bigger reward potential, and higher risk. Notice that XES fell 40% in June-July, advanced 30% into August, fell 22% into late September and is up almost 30% since late September. The ETF broke out of a short-term consolidation and exceeded its rising 200-day with a big move on Wednesday.
The Trend Composite aggregates signals in five trend indicators: Bollinger Bands (125,1), Keltner Channels (125,2), 5-day Rate-of-Change of 125-day SMA, StochClose (125,5) and CCI-Close (125). The Trend Composite and ten other indicators are part of the TIP Indicator Edge Plugin for StockCharts ACP
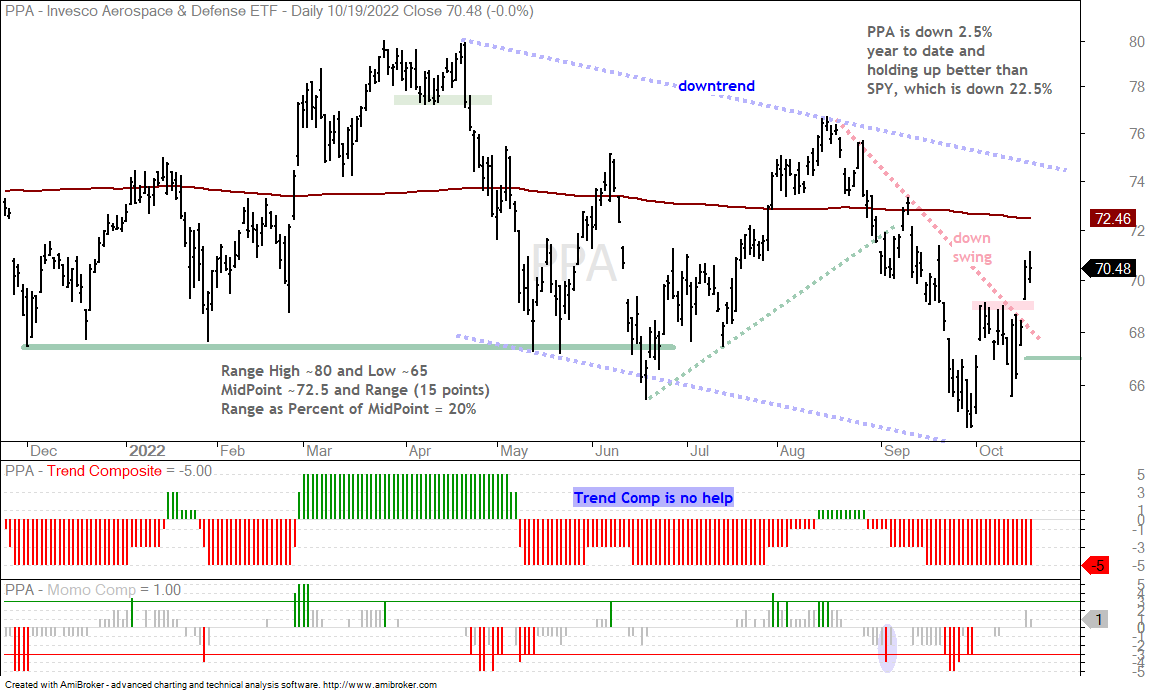
Aerospace & Defense ETF Reverses Downswing (PPA)
The Aerospace & Defense ETF (PPA) caught a strong bid on Tuesday and reversed its downswing with a gap. The red dashed line and early October highs defined this downswing. A strong breakout should hold and the 68-69 area marks a support zone (broken resistance). A close below 67 would clearly negate the breakout and call for a re-evaluation.
You can learn more about my chart strategy in this article covering the different timeframes, chart settings, StochClose, RSI and StochRSI.
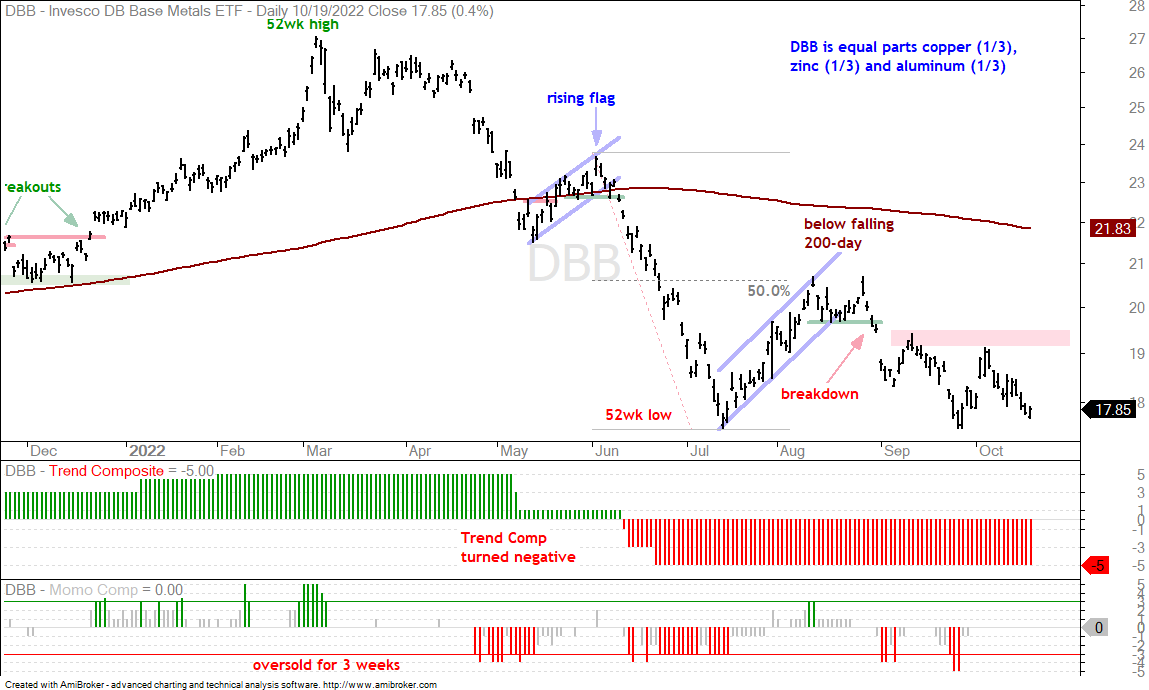
DB Base Metals ETF Nears July-September Lows (DBB)
The DB Base Metals ETF (DBB) is currently testing the July-September lows after a decline the last seven days. Overall, DBB bounced with the market into mid August and broke down in late August to signal a continuation lower. I would not call the July-September lows support because the bigger trend is down and lower lows are expected in a downtrend. Weakness in base metals suggests weakening demand and a slowing global economy. The September-October highs mark the first resistance zone of significance.
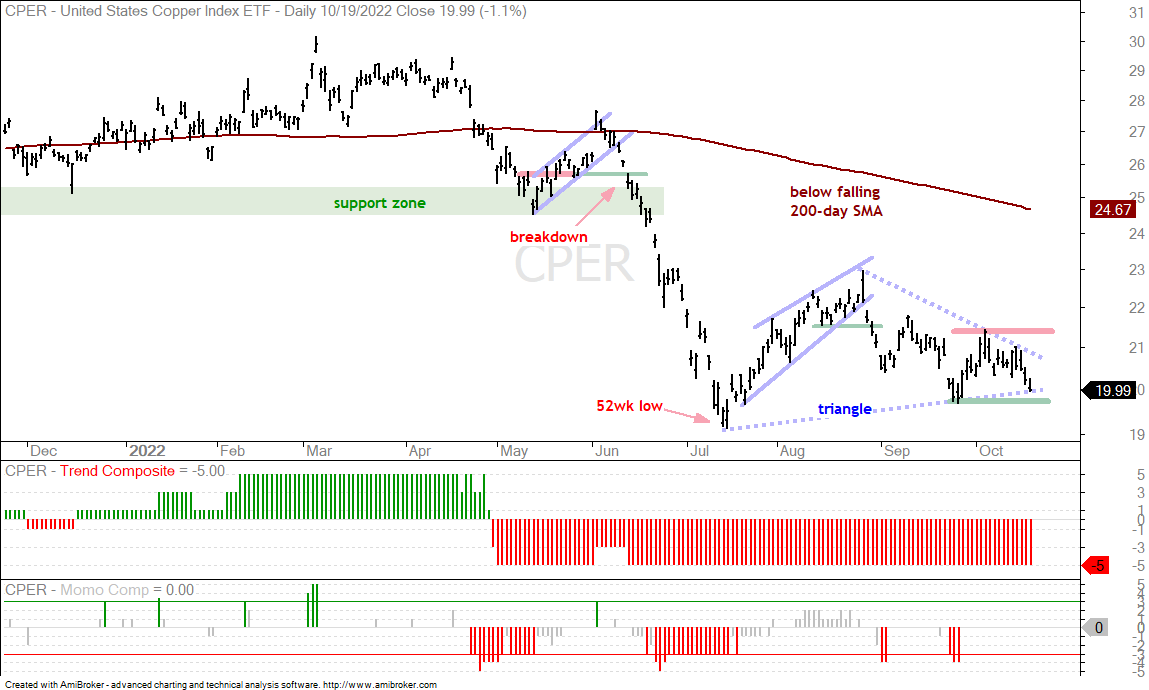
Copper ETF Forms Triangle within Downtrend (CPER)
The Copper ETF (CPER) remains under pressure and is on the verge of breaking triangle support. Overall, CPER hit a 52-week low in July, bounced into August and broke down in late August. The triangle represents a large consolidation after the June-July decline and it is considered a bearish continuation pattern. A break down would argue for a move below the July lows. Sometimes, just sometimes, triangles result in reversals. A break above the October high is needed to even consider a bullish reversal.
Here is an article from Reuters on copper stocks at the LME. This article shows just how foolhardy and confusing it can be to quantify the fundamentals.
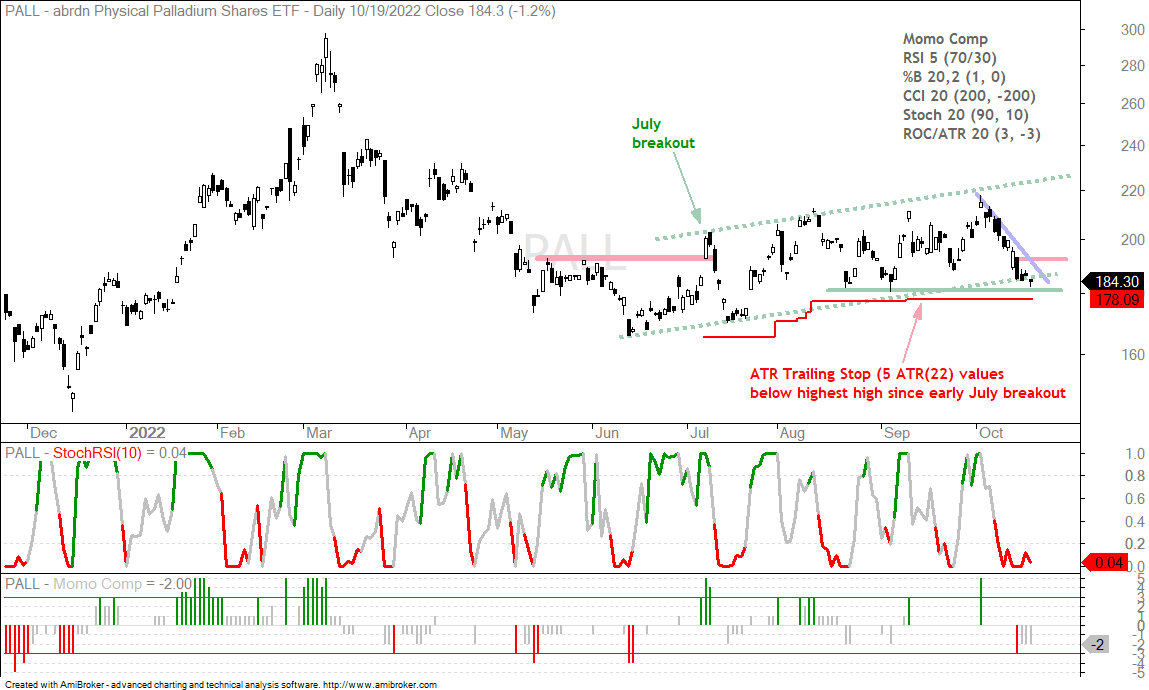
Palladium ETF Hits Moment of truth (PALL)
The Palladium ETF (PALL) fell back with the rest of the metals, both industrial and precious, over the last two weeks. PALL is starting to act like an industrial metal related to automobile demand, which it is. The Global Auto ETF (CARZ) hit a 52-week low last week and this does not bode well for demand going forward. On the price chart, PALL has been trending higher since summer with higher highs and higher lows (green dashed lines). The ETF fell back to its August-September lows late last week and is testing an important support level. A break below these lows would be bearish and likely trigger the ATR Trailing Stop. For now, PALL is near support, short-term oversold and ripe for a bounce. The short blue trendline and red resistance line define the current downswing. A break above short-term resistance would reverse the downswing. The first indicator window shows StochRSI(10) and a surge above .80 would show a short-term momentum thrust.
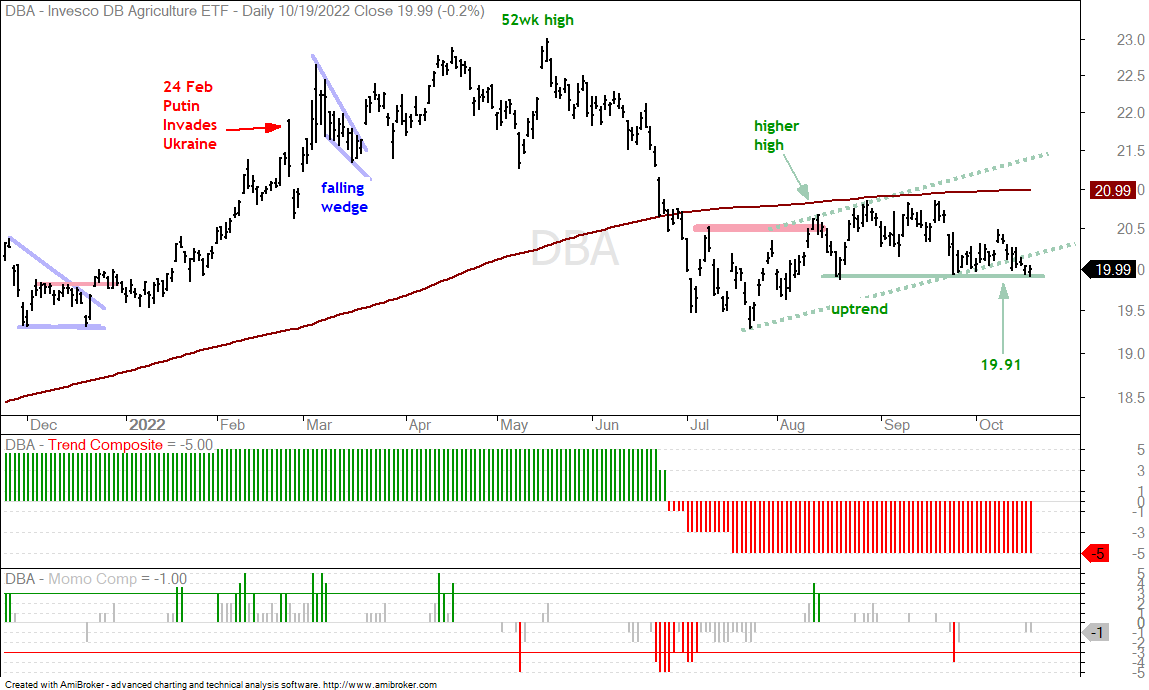
DB Agriculture ETF Breaks Channel Line (DBA)
The DB Agriculture ETF (DBA) is at its moment of truth as it tests the August-September lows. DBA had an uptrend working since August (green dashed lines), but broke below the lower line with a decline last week. The ETF is now testing support from the August-September lows and a close below 19.91 would break support. DBA is quite a mixed bag with sizable holdings in corn, soybeans, wheat, coffee, cattle, sugar, cocoa and hogs. This is not a homogeneous group with strong positive correlations. No wonder it is having trouble trending.
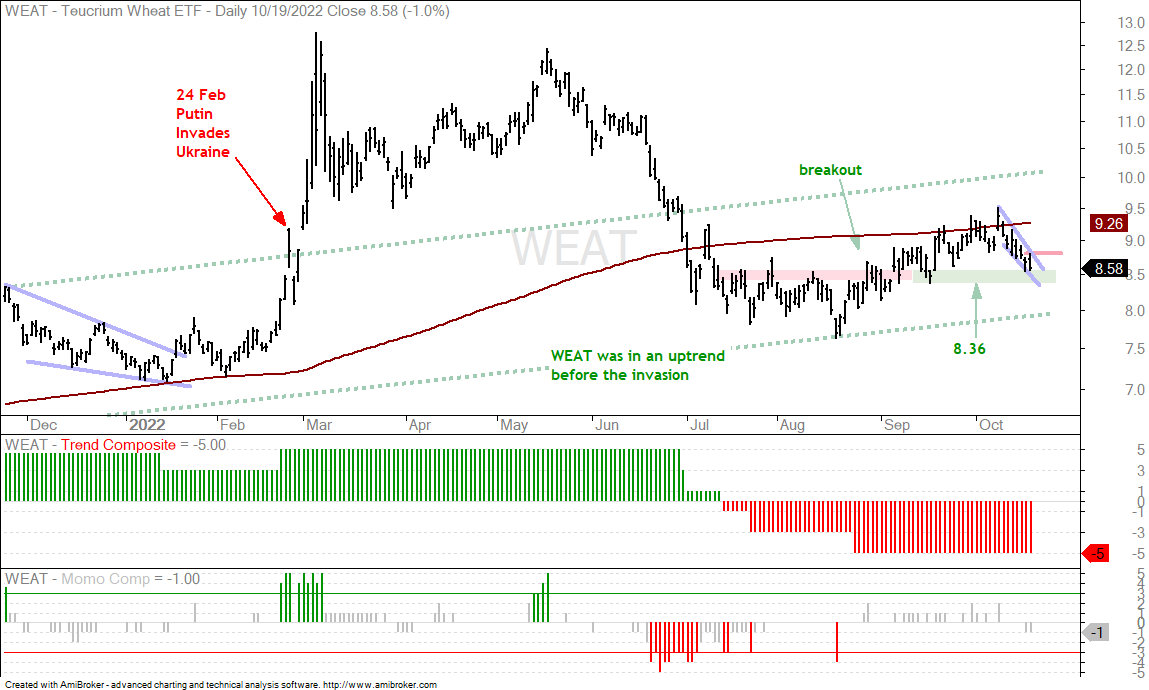
Wheat ETF Tests Support (WEAT)
The Wheat ETF (WEAT) broke out in late August and edged above its rising 200-day SMA in early October, but then fell back over the last seven days. This is so far considered a pullback within a uptrend, although the uptrend does not seem that strong. Broken resistance turns into support in the 8.5 area and this is the area to watch for a bounce. A small falling wedge defines this pullback and a break above Wednesday’s high would be short-term bullish. Longer-term, the support zone in the 8.5 area should hold and a close below 8.36 would argue for a re-evaluation.
Previous Reports and Video
Wednesday: Market and ETF Video (here)
- Composite Breadth Model Remains Bearish
- Fed Balance Sheet Reflects QT
- CCC and BBB Spreads Remain Elevated
- SPY Turns Volatile as QQQ Leads Lower
- Small-caps Hold Up, but Ignoring Short-term Reversals
- TLT hits New Low as 10yr Yield Hits 4%
- Dollar Bullish ETF Stalls within Uptrend
- Gold Falls Back Towards September Lows
- Only 7 (2.5%) of 274 ETFs in Uptrends
- Biotech SPDR Holds Up, but Palladium ETF Tests Support (XBI, IBB, PALL)
- Trend Composite Turns Bullish for Livestock ETF (COW)
- XLK, XLF, XLI, XLC, XLP, XLRE and XLU Bounce from 52-week Lows
- XLV Holds Above Summer Lows, but Still in Downtrend
- Tech ETFs Bounce from 52wk Lows (SKYY, CIBR, FINX, FDN, SOXX, IGV)
- Networking ETF Is Best Performing Tech ETF (IGN)
- Aerospace & Defense ETF Reverses Downswing with Gap-Surge (PPA)
- The Siren Song from the Home Construction ETF (ITB)
- Retail, EW Discretionary and Autos Bounce from 52wk Lows (XRT, RCD, CARZ)
- Regional Bank ETF Breaks Early October High, But… (KRE)
- Oil Hits Resistance Zone and Falls Sharply
- DB Energy ETF Tests 200-day SMA (DBE, DBC)
- Energy ETFs Hold Up Despite Drop in Oil (XLE, XOP, FCG, XES)
- DB Base Metals ETF Nears Jul-Sep Lows
- Agribusiness and Copper Miners Consolidate within Downtrends (MOO, COPX)
- DB Agriculture ETF Tests Aug-Sep Lows
- Wheat Tests Support as Corn Holds Up (WEAT, CORN)
- Soybeans Look Poised for a Breakdown (SOYB)
Wednesday: Market Regime Update with Breadth Model and Yield Spreads (here)
Tuesday: Market and ETF Report (here)
- 10-yr Treasury Yield Hits 5% as TLT Hits New Low
- A Handful of Uptrends (UUP, TUR, IGN, COW)
- Palladium ETF Becomes Oversold (PALL)
- Trend Composite Turns Positive for Livestock ETF (COW)
- SPY Turns Volatile after Big Decline (plus QQQ, IWM)
- Biotech SPDR Corrects after Surge (XBI)
- Aerospace & Defense ETF Consolidates below Resistance (PPA)
- Regional Bank ETF Breaks early October High (KRE)
- Networking ETF Tests Breakout Zone (IGN)
- Oil Turns Down as DB Energy ETF Forms Pennant (CL1!, DBE)
- Energy-based ETFs Hit Make or Break Zones (XLE, XOP, FCG)
- Previous Report (Thursday, October 13th)
You can learn more about my chart strategy in this article covering the different timeframes, chart settings, StochClose, RSI and StochRSI.