The bears remain in control of the stock market and they are expanding their territory with breakdowns in energy, a clean energy and biotech. Stock-based ETFs are still part of the market and this became abundantly clear as all stock based ETFs in the ETF Master List fell over the last ten days. There are also few places to hide outside of the stock market because the vast majority of ETFs are in downtrends. It has become a classic bear market situation where moving sideways or going down less is a victory. By bear market, I am referring to the bear markets of 2000-2003 and 2007-2009.
About the ETF Trends, Patterns and Setups Report
This report contains discretionary chart analysis based on my interpretation of the price charts. This is different from the fully systematic approach in the Trend Composite strategy series. In this ETF Trends, Patterns and Setups report, I am looking for leading uptrends and tradable setups within these uptrends. While I use indicators to help define the trend and identify oversold conditions within uptrends, the assessments are mostly based on price action and the price chart (higher highs, higher lows, patterns in play). Sometimes the chart assessment can be at odds with the indicators.
This Week's Commentary Schedule
Tuesday – 27 September: Market-ETF Report and Signal-Rank Table Update
Wednesday – 28 September Market-ETF Video and Market Regime Update
Thursday – 29 September: Market-ETF Report and Signal-Rank Table Update
Saturday – 1 October: ETF Signal and Rank Table
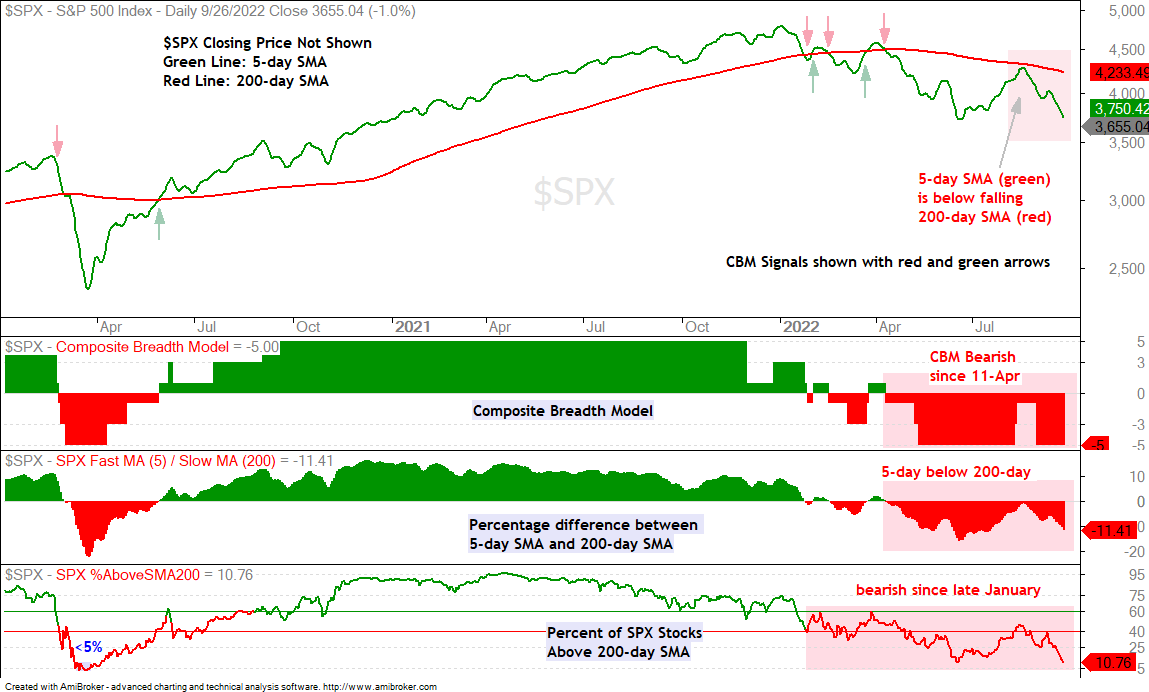
Composite Breadth Model Remains Bearish
The weight of the evidence is bearish with the Composite Breadth Model at -5, meaning all five inputs are bearish. The 5-day SMA for the S&P 500 is 11.41% below the 200-day SMA and fewer than 11% of S&P 500 stocks are above their 200-day SMAs. This means more than 89% are below, We have not seen such conditions since mid April 2020, but this prior low reading occurred after SPX %Above 200-day SMA dipped below 5% in mid March 2020 (left side of bottom window).
You can learn more about my chart strategy in this article covering the different timeframes, chart settings, StochClose, RSI and StochRSI.
Downside Participation Increases
The bear is expanding its grip with more and more ETFs hitting new lows. Six of the eleven sector SPDRs hit new lows. The Healthcare SPDR (XLV) and Consumer Staples SPDR (XLP) are close to new lows. The Utilities SPDR (XLU) is the only sector that remains with an uptrend (Trend Composite) as the Energy SPDR (XLE) turned bearish over the last two days. Even so, XLU is down 5.8% this month and down 1.19% year-to-date. It is an ugly picture throughout the stock market as correlations continue to rise.
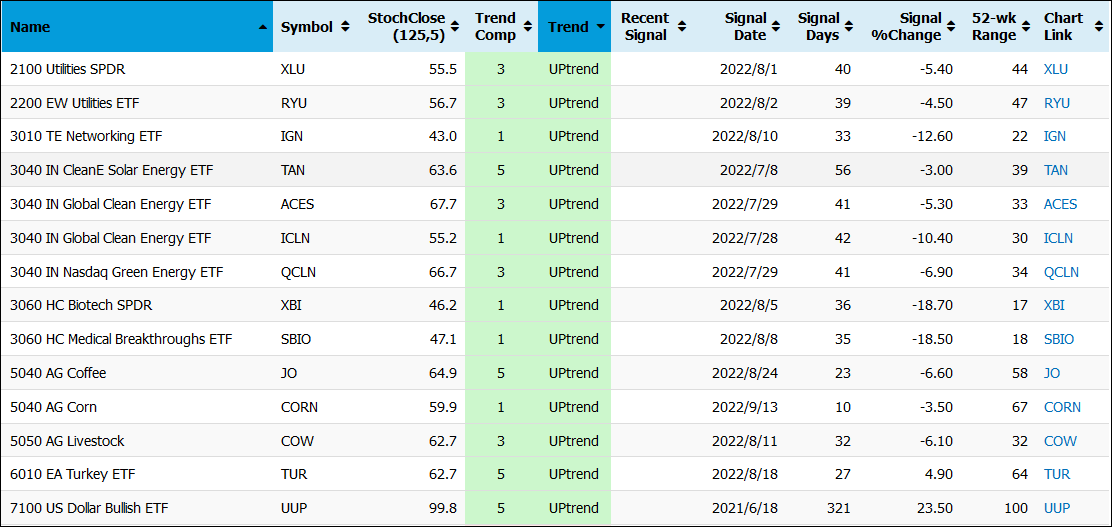
Only 14 of the 274 ETFs in the Master ETF List are in uptrends (image above). This means 94.9% of the ETFs (260) are in downtrends. Richard Russell of Dow Theory Letters (R.I.P.) used to say that the winner in a bear market is the one who looses the least. At this stage, we are just looking for assets that are either holding up or not going down. Cash is an asset, but its value is falling because of inflation.
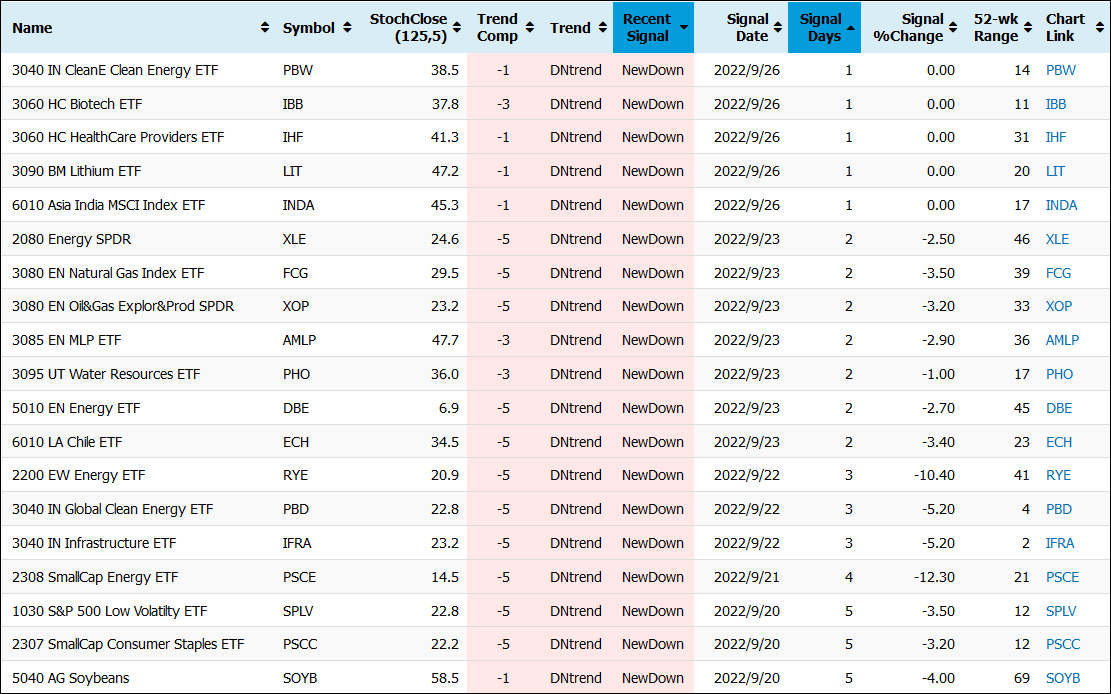
The next image shows the new downtrend signals over the last five days (19). We are seeing cracks in clean energy (PBW), biotech (IBB), energy (XLE, FCG, XOP, DBE) and defensive groups (PHO, IFRA, SPLV, PSCC). This is another sign that correlations are rising and the previous leaders are breaking down. Also note that only 2 of 274 ETFs are up over the last ten days, the Dry Bulk Shipping ETF (BDRY) and Dollar Bullish ETF (UUP).
SPY Leads Lower with New Low
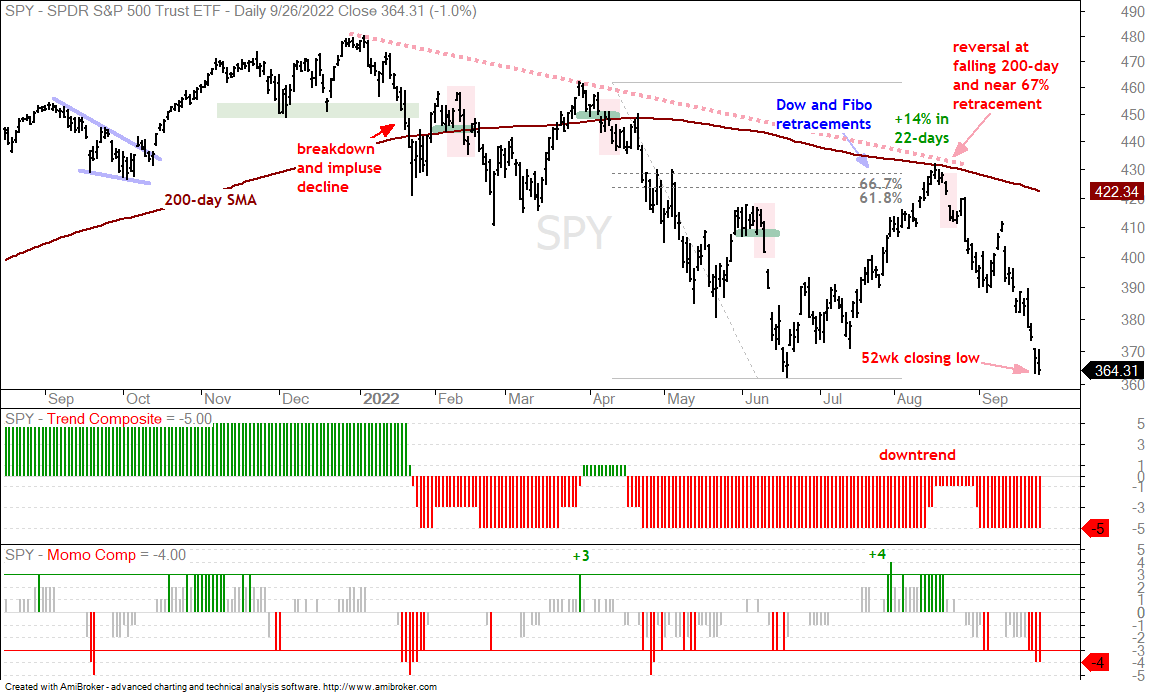
The S&P 500 SPDR (SPY) is leading the way lower with a 15% decline since mid August (28 days) and a 52-week (closing) low on Monday. A 52-week low in the most important benchmark for US stocks is clearly bearish or at least indicative of a long-term downtrend. I would not call the June low support because lower lows are expected in a downtrend. As such, I expect a move below the June low at some point.
SPY and most of the stock market are short-term oversold after sharp declines the last 28 days and 10 days. 28 days goes to mid August (-15.22%). 10 days marks the 12-Sept high (-11.35%). The Momentum Composite hit -3 last Thursday and -4 the last two days. This is indeed oversold, but oversold within a bigger downtrend is not the ideal setup. Why? Because the bigger downtrend is the dominant force and can exert itself at any moment.
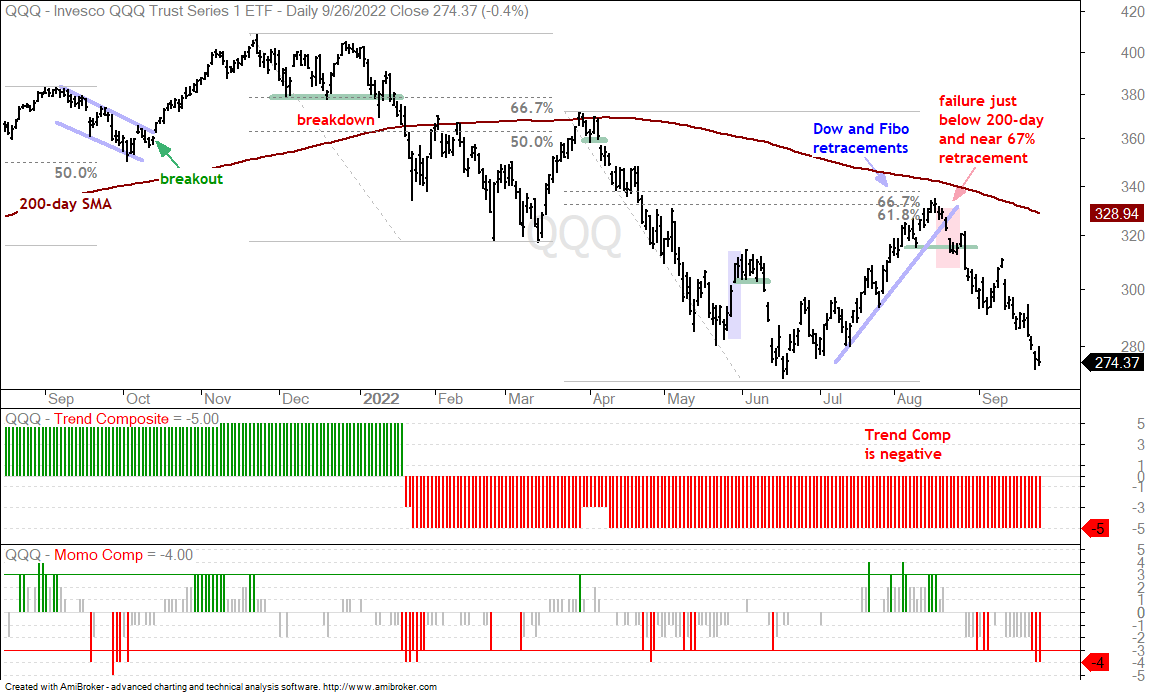
The next chart shows the Nasdaq 100 ETF (QQQ) falling 17.43% since mid August and 11.70% the last ten days. QQQ is near its June low and very close to hitting a 52-week low. QQQ is also quite oversold, but also in a long-term downtrend since late January (negative Trend Composite).
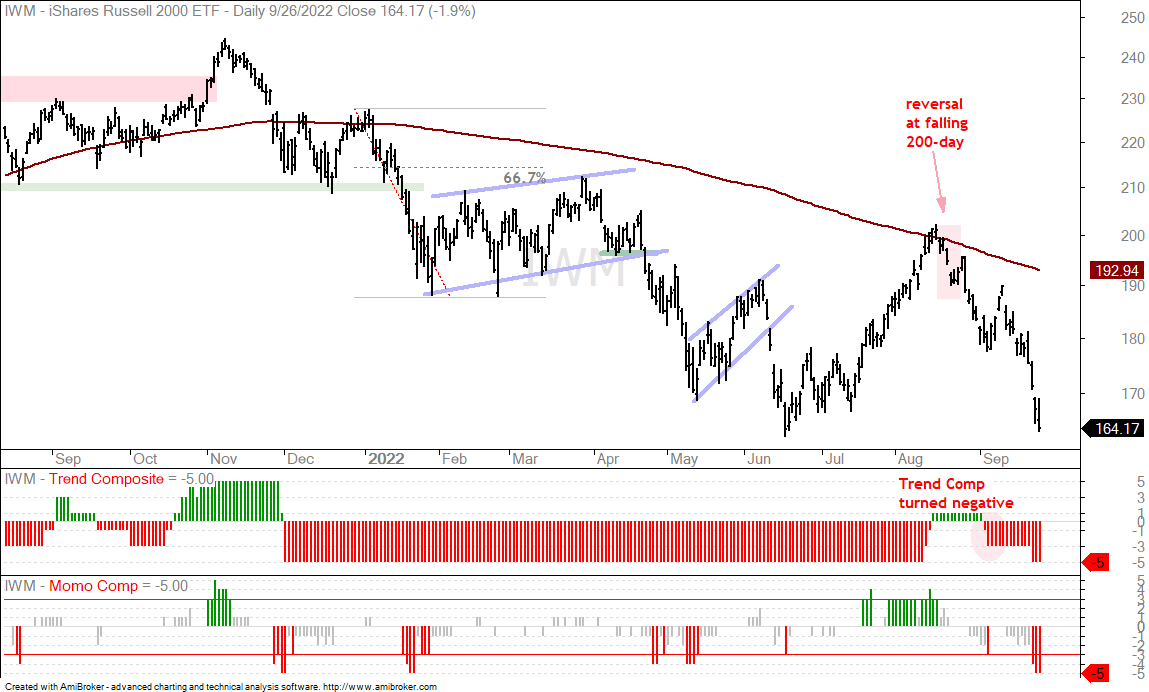
The next chart shows IWM falling 18.32% since mid August and 13.44% the last ten days. Note that IWM was down more than SPY over the last ten days and vulnerable small-caps are feeling the heat. IWM did not record a new low, but is very close to its June low.
The Momentum Composite aggregates signals in five momentum-type indicators to identify short-term overbought and oversold conditions. This indicator is part of the TIP Indicator Edge Plugin for StockCharts ACP
Energy ETFs Trigger Stops and Turn Bearish
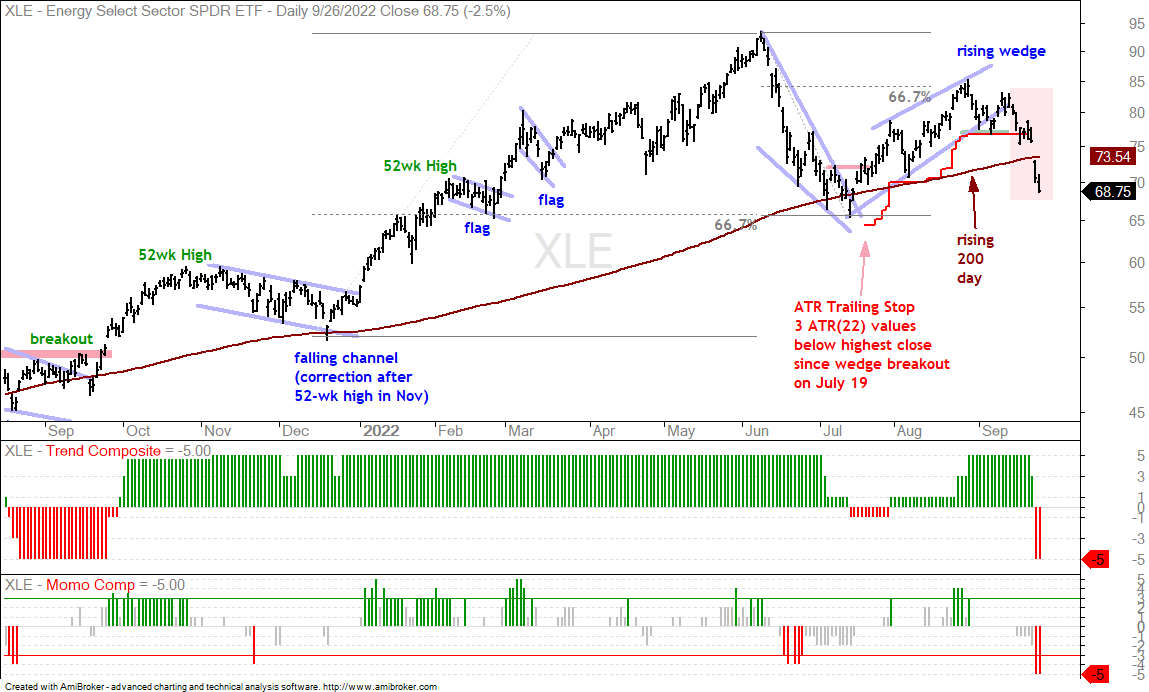
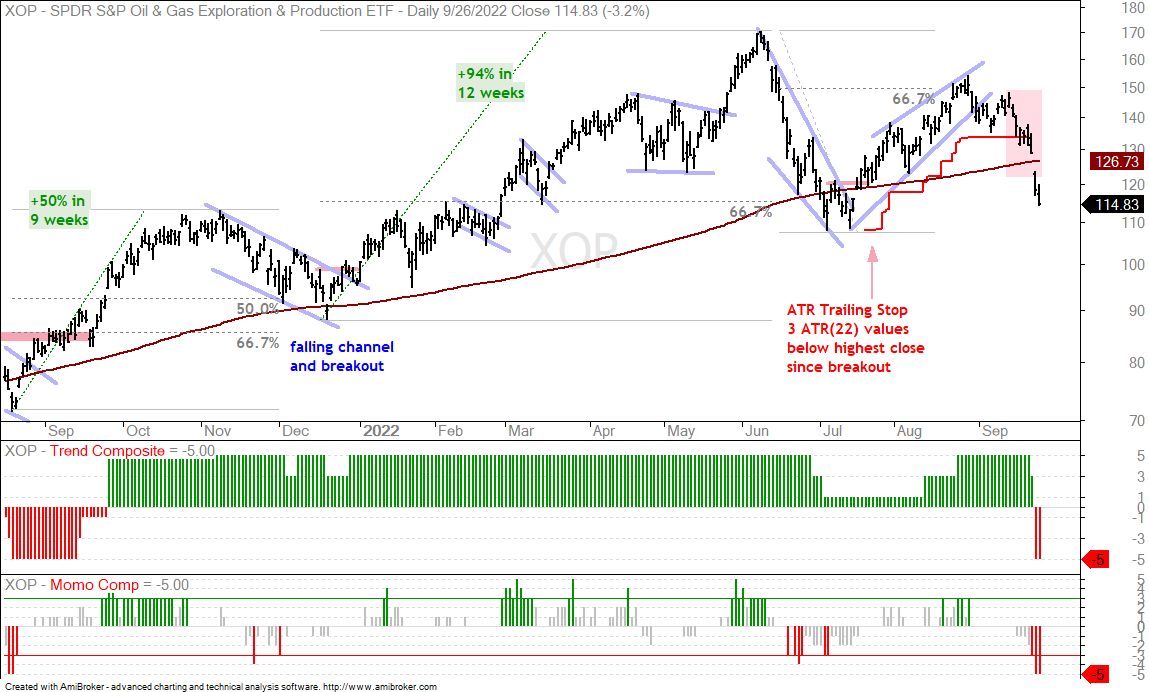
The leading energy ETFs could not hold up and broke down as the stock market tumbled the last two weeks. The first chart shows the Energy SPDR (XLE) with a close below the ATR Trailing Stop on Thursday. This coincides with a rising wedge break and a break below the early September low. Overall, XLE formed a lower high from June to August as it retraced 66.7% of the prior decline with a rising wedge. The wedge break and plunge below the 200-day SMA are bearish. The Trend Composite also turned negative two days ago.
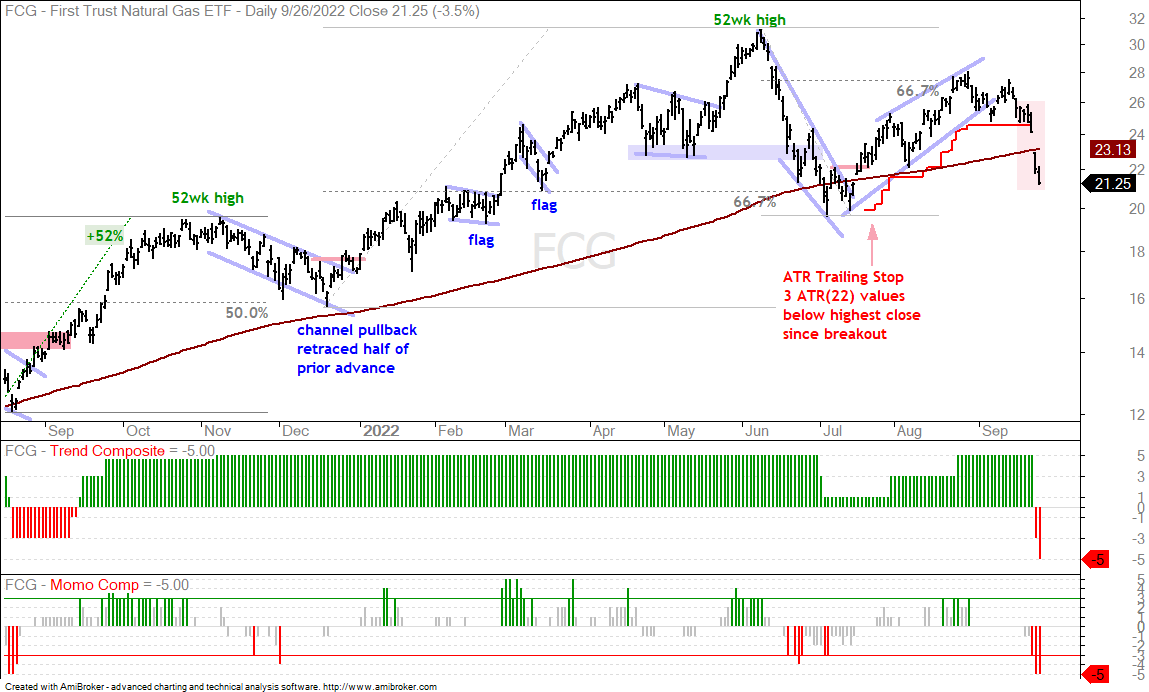
The next chart shows the Natural Gas ETF (FCG) closing below the ATR Trailing Stop on Thursday and then gapping below the 200-day SMA on Friday. The overall chart characteristics are similar to XLE (lower high, 67% retracement, wedge break).
You can learn more about exit strategies in this post, which includes a video and charting options for everyone.
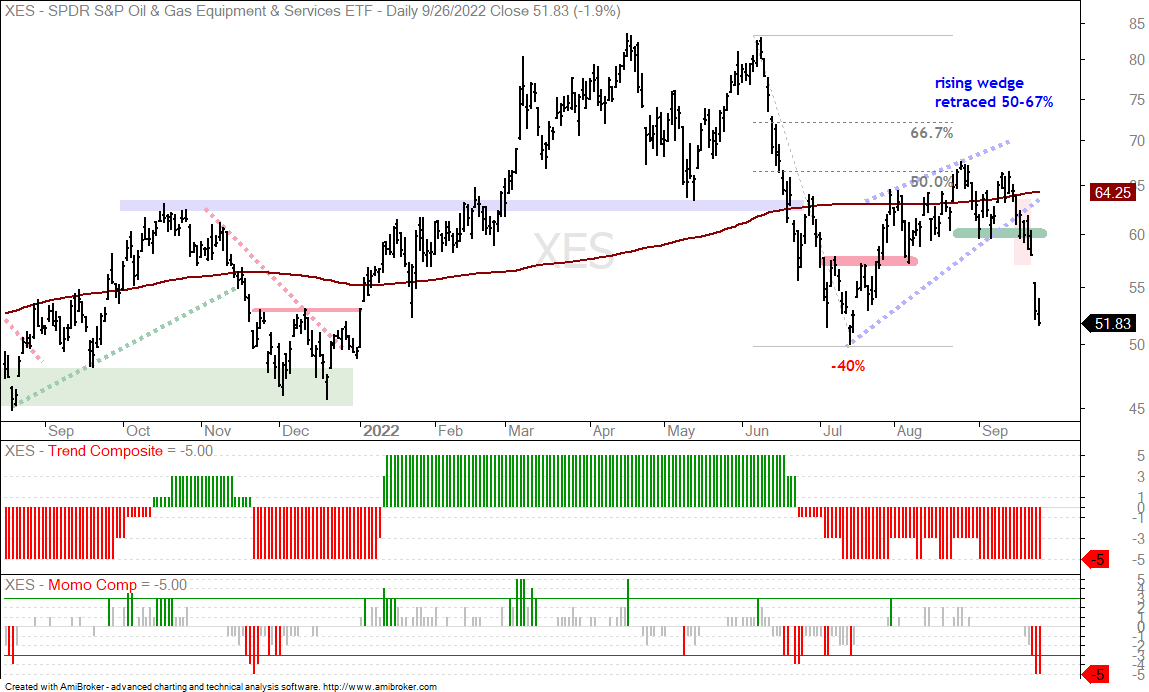
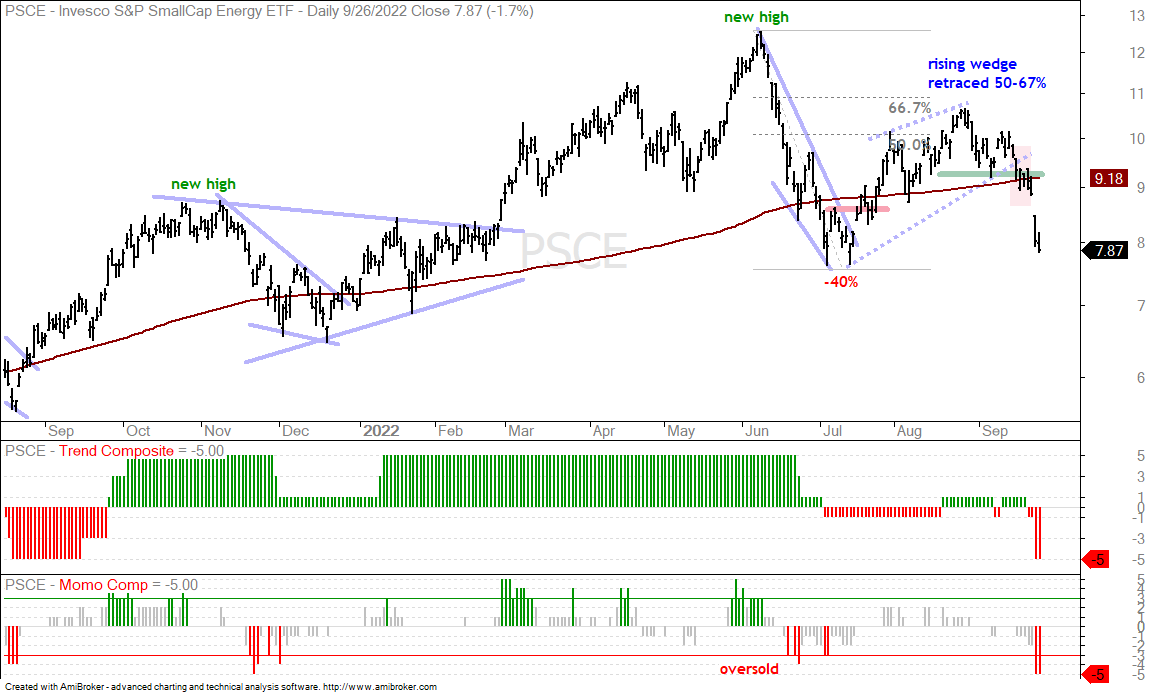
The Oil & Gas Equipment & Services ETF (XES) and the Small-cap Energy ETF (PSCE) also broke rising wedge support on Thursday. Note that rising wedges that retrace around 2/3 of the prior decline are deemed bearish continuation patterns and the recent breakdowns signal a continuation of the June-July declines.
Oil Hits New Low as NatGas Firms
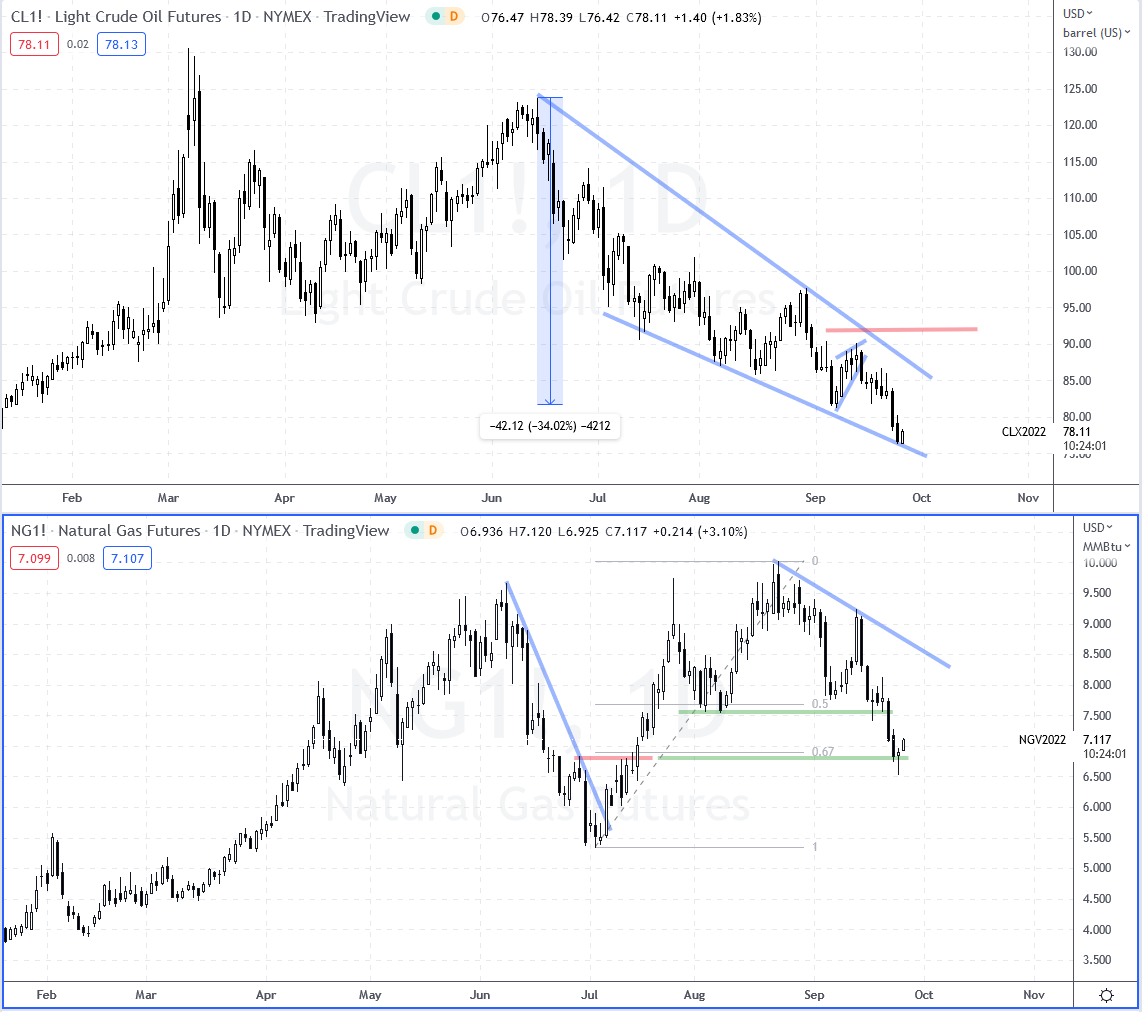
The energy markets could be volatile today because Nord Stream II, the gas pipeline from Russia to Germany, was damaged in three different spots overnight. The top chart shows Light Crude Futures (CL1!) in a downtrend since summer and a new low on Friday. Nothing to see here except demand destruction (falling stock market and shaky economy).
The bottom window on the chart above shows Natural Gas Futures (NG1!) falling sharply the previous eight days, dipping to 6.5 on Monday and rising in early trading on Tuesday. Overall, I still think NatGas is in an uptrend, albeit a volatile uptrend. Natty hit a new high in August and remains above its July high. Even though it did not hold the 50% retracement and support level in the 7.5% area, it is well above the July low and trading at a support-reversal zone (67% retracement and broken support).
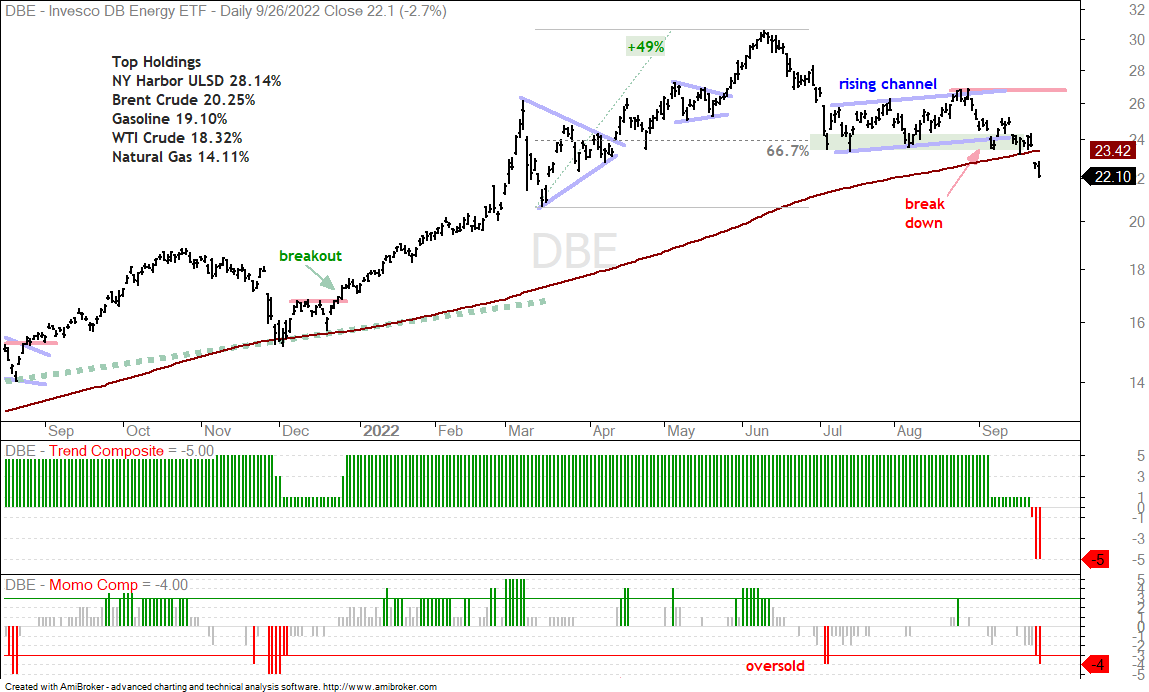
The next chart shows the DB Energy ETF (DBE) breaking rising channel support in early September and continuing lower the last two weeks. The Trend Composite followed with a bearish signal three days ago. Even though DBE has NatGas as a component, the 14% weighting is not enough to offset weakness in oil and gasoline.
The Trend Composite aggregates signals in five trend indicators: Bollinger Bands (125,1), Keltner Channels (125,2), 5-day Rate-of-Change of 125-day SMA, StochClose (125,5) and CCI-Close (125). The Trend Composite and ten other indicators are part of the TIP Indicator Edge Plugin for StockCharts ACP
Bear Market Overrides Breakouts in Clean Energy
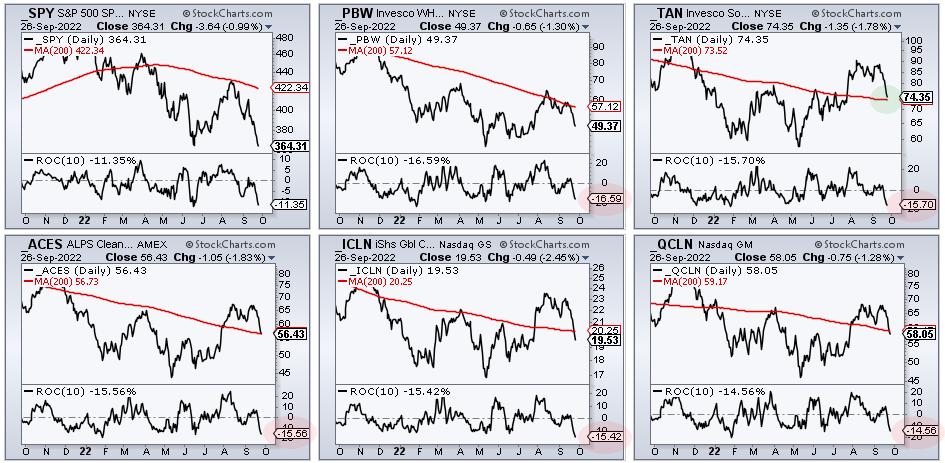
Bear markets cast a dark cloud over all stock-based ETFs. Even though some will buck the bear, picking the right ones is a big challenge. Note that only 13% of S&P 1500 stocks are above their 200-day SMAs, which means 87% are below. The Solar Energy ETF (TAN) and other clean-energy ETFs broke out in late July and were leading the market. They were holding up better than the market into early September, but succumbed to selling pressure and fell sharply the last two weeks. The charts below show SPY with five clean energy ETFs, the 10-day Rate-of-Change and the 28-day ROC. The five clean energy ETFs fell around 15% the last two weeks. TAN is the only one still above its 200-day SMA.
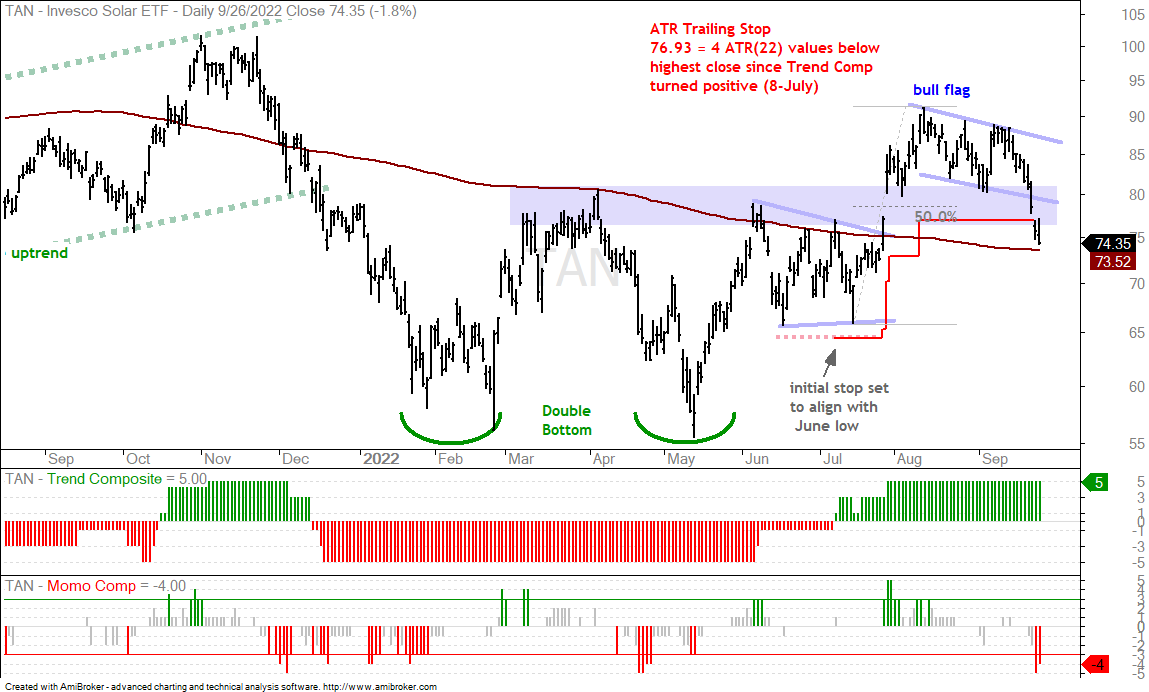
The first chart shows TAN with a bull flag that did not lead to a breakout. The ETF plunged below the ATR Trailing Stop with a sharp decline the last two weeks.
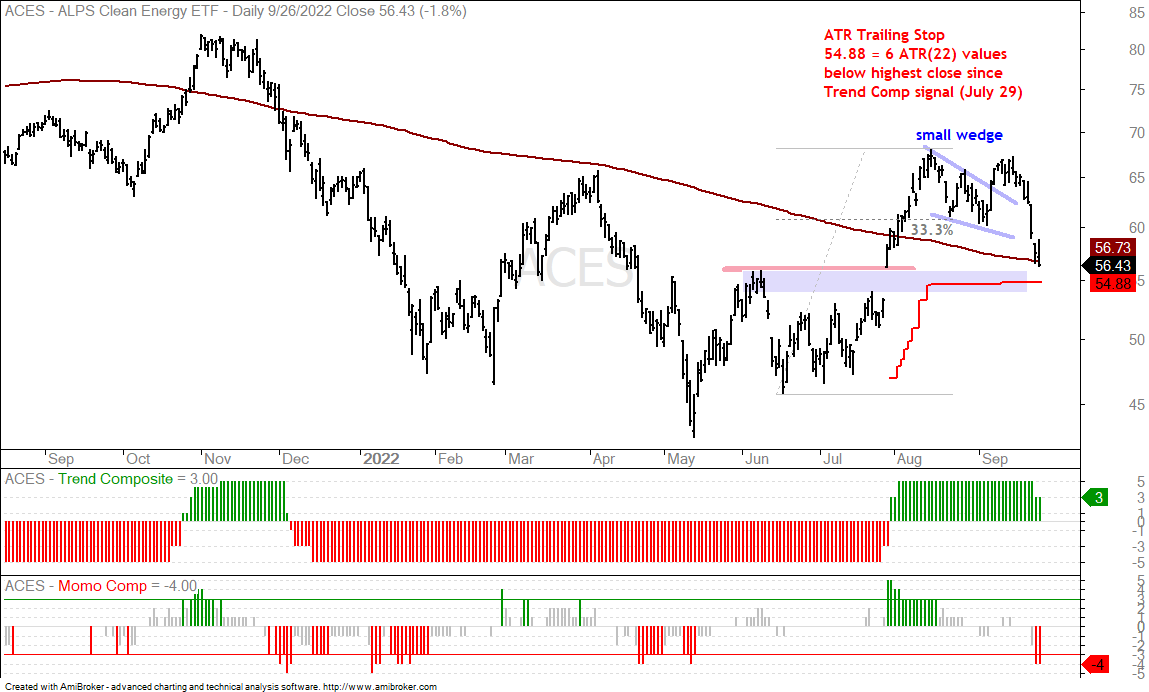
The next chart shows the Clean Energy ETF (ACES) failing to hold the wedge breakout and falling back to the prior breakout zone, which may offer support. The ETF is also just above the ATR Trailing Stop (54.88) and short-term oversold.
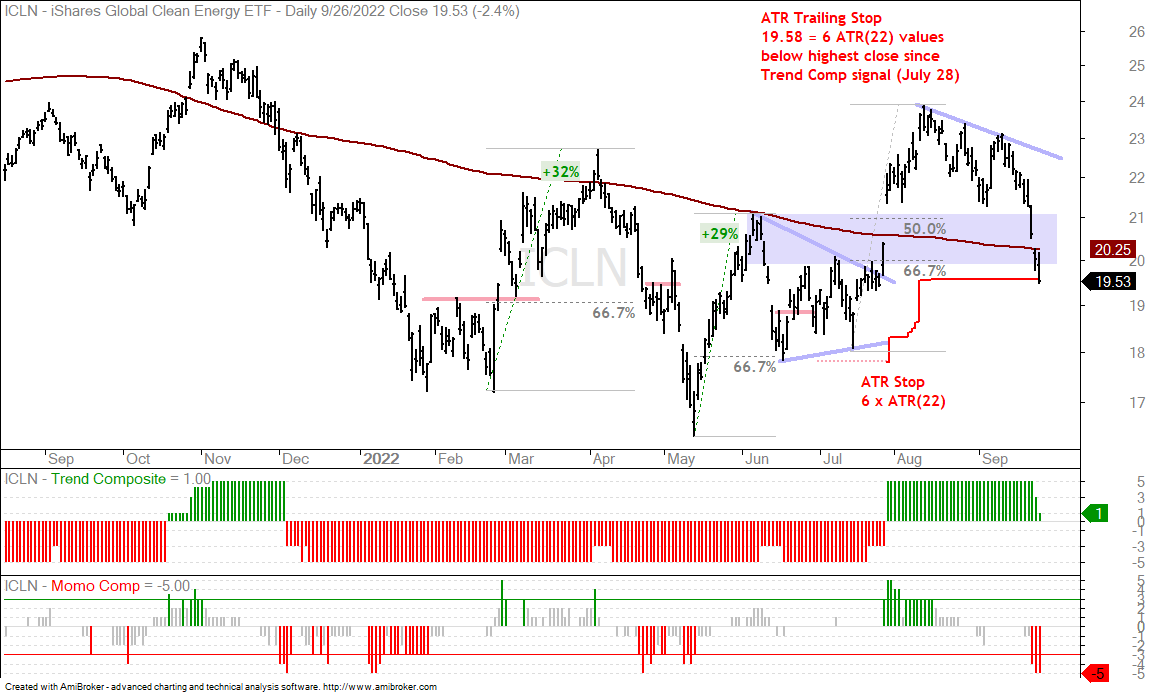
The next chart shows the Global Clean Energy ETF (ICLN) falling below the 200-day SMA and triggering the ATR Trailing Stop with a close below 19.58 on Monday.
Biotech ETFs are Not Immune
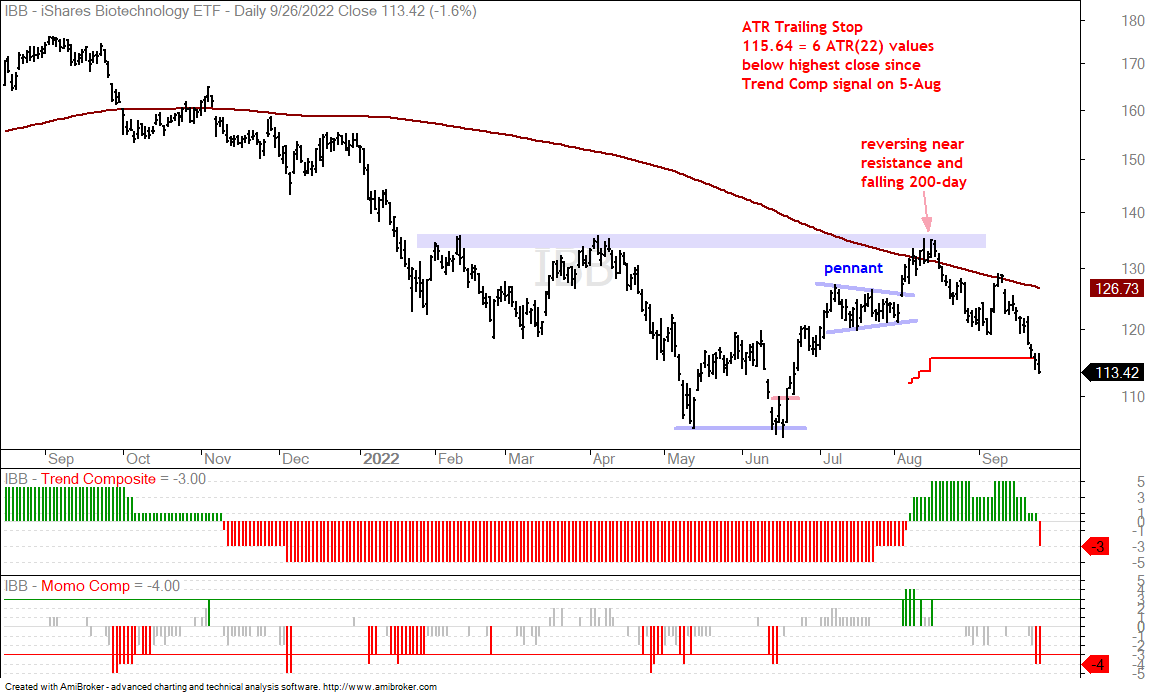
The next chart shows the Biotech ETF (IBB) triggering its ATR Trailing Stop with a close below 115.64 on Friday. There is nothing to do now expect wait for the broader market to improve and a setup to emerge, which could take some time.
You can learn more about exit strategies in this post, which includes a video and charting options for everyone.
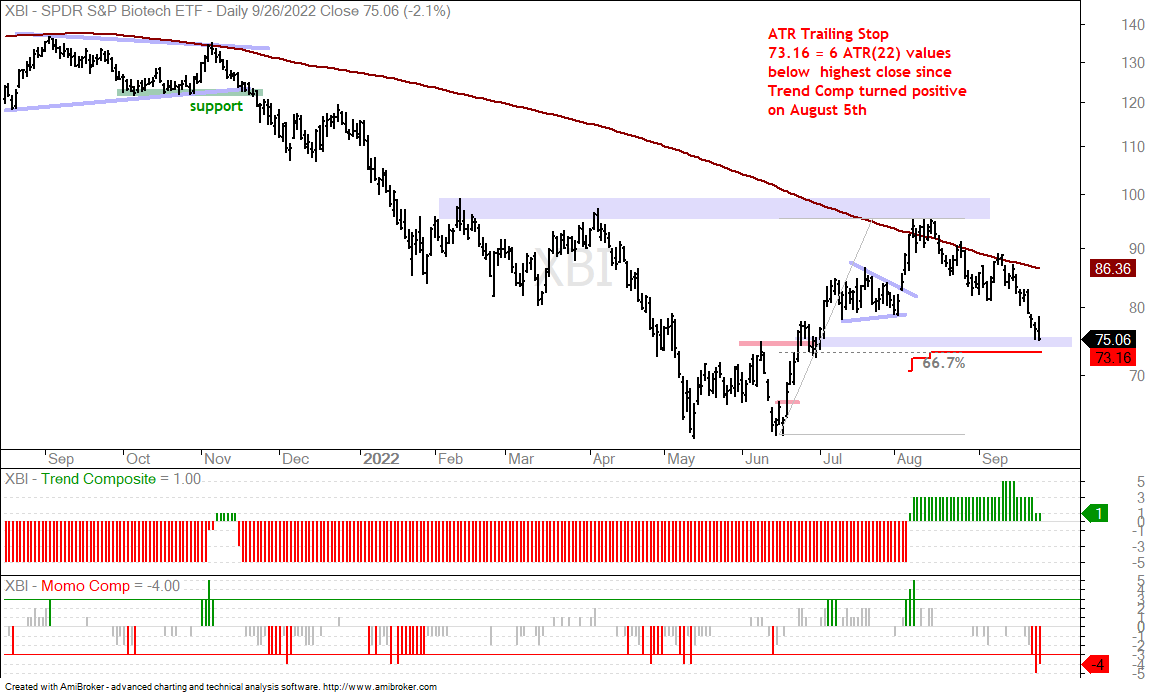
The next chart shows the Biotech SPDR (XBI) falling sharply since mid August and over the last ten days. The ETF is below its falling 200-day SMA, but the Trend Composite remains positive and XBI has yet to trigger its ATR Trailing Stop (73.16). Given the broad market environment, it is probably just a matter of time before this stop is triggered.
Uranium ETF Reverses Upswing (URA)
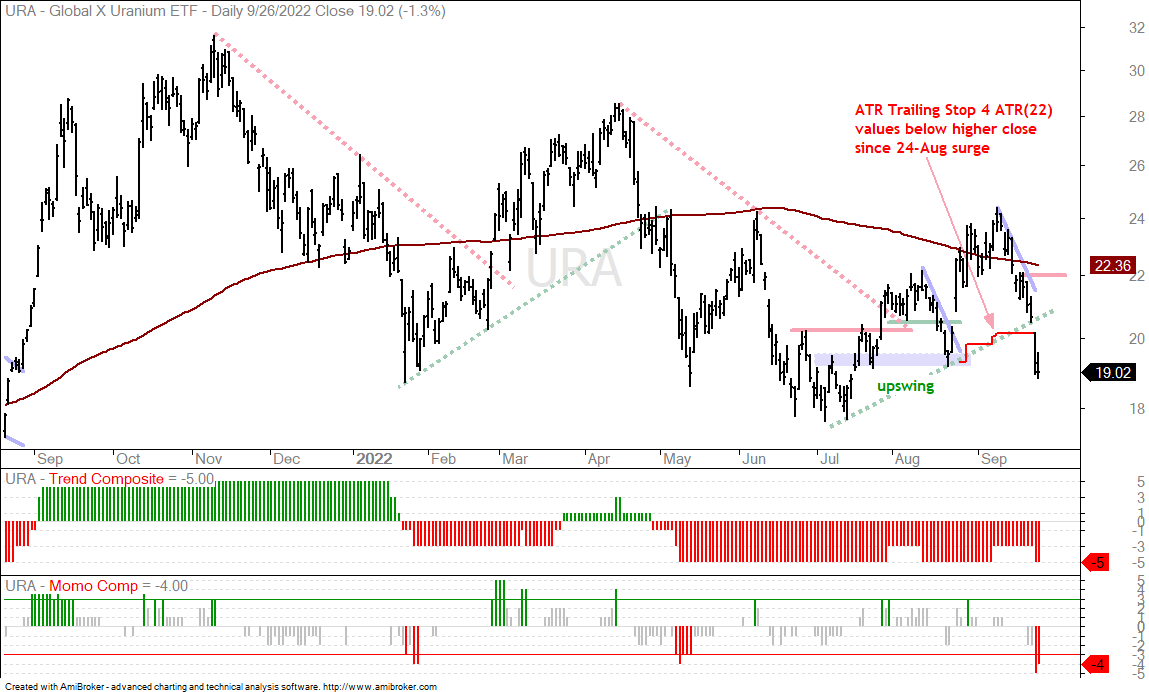
The Uranium ETF (URA) was leading the market from mid July to early September with a breakout and upswing. This ETF also succumbed to broad market selling pressure and broke below the ATR Trailing Stop (20.17). The upswing also reversed with the break below the rising green trendline and move below the mid August low.
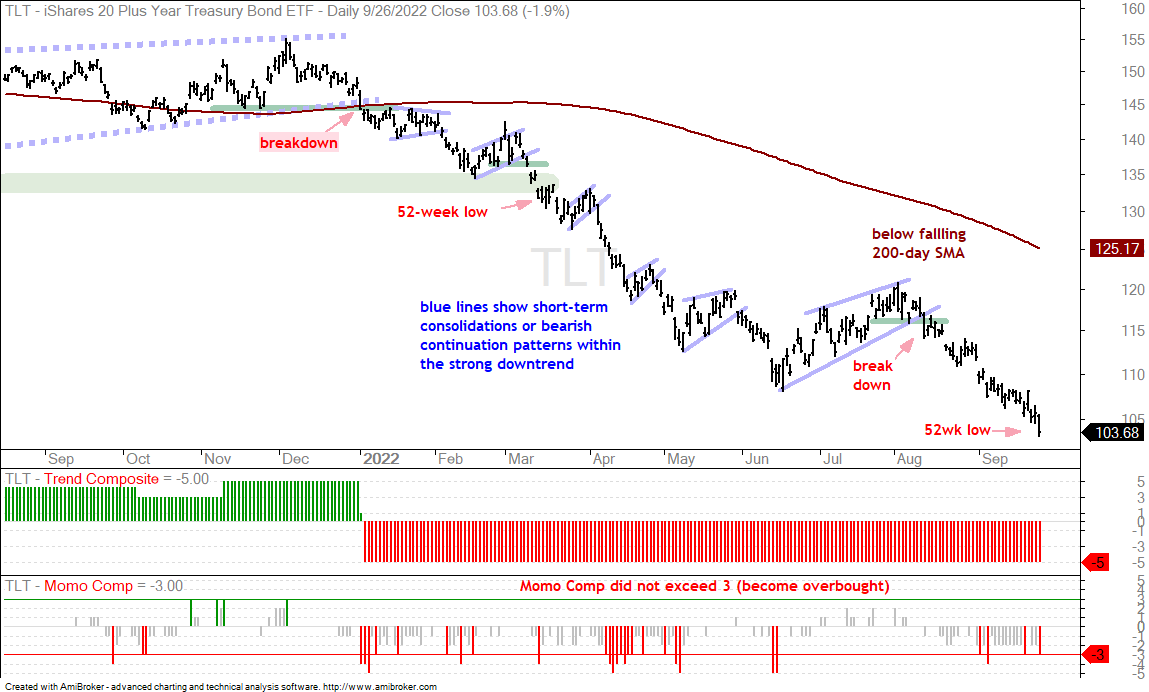
Outsized Moves for TLT, GLD and UUP
Bonds are the natural alternative to stocks, but the 20+ Yr Treasury Bond ETF (TLT) is in a strong downtrend as it pushed to new lows in September. The ETF fell 1.9% on Monday and this represents an “outsized decline”, which is an above average decline. An outsized decline after an extended decline can signal exhaustion and lead to an oversold bounce. However, this would still be an oversold bounce within a bigger downtrend.
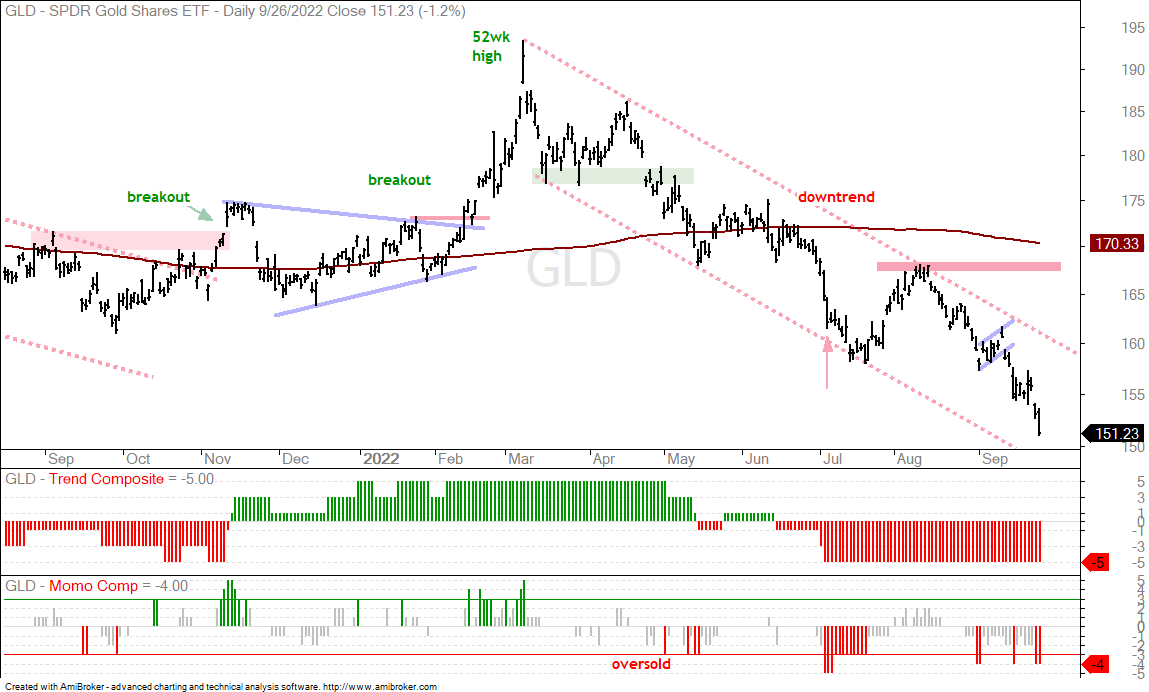
The Gold SPDR (GLD) is also in a strong downtrend and hit a 52-week low. GLD fell 2.78% the last two days and this is the sharpest two-day decline since July 6th (red arrow). It took GLD two more weeks to firm and bounce after this decline.
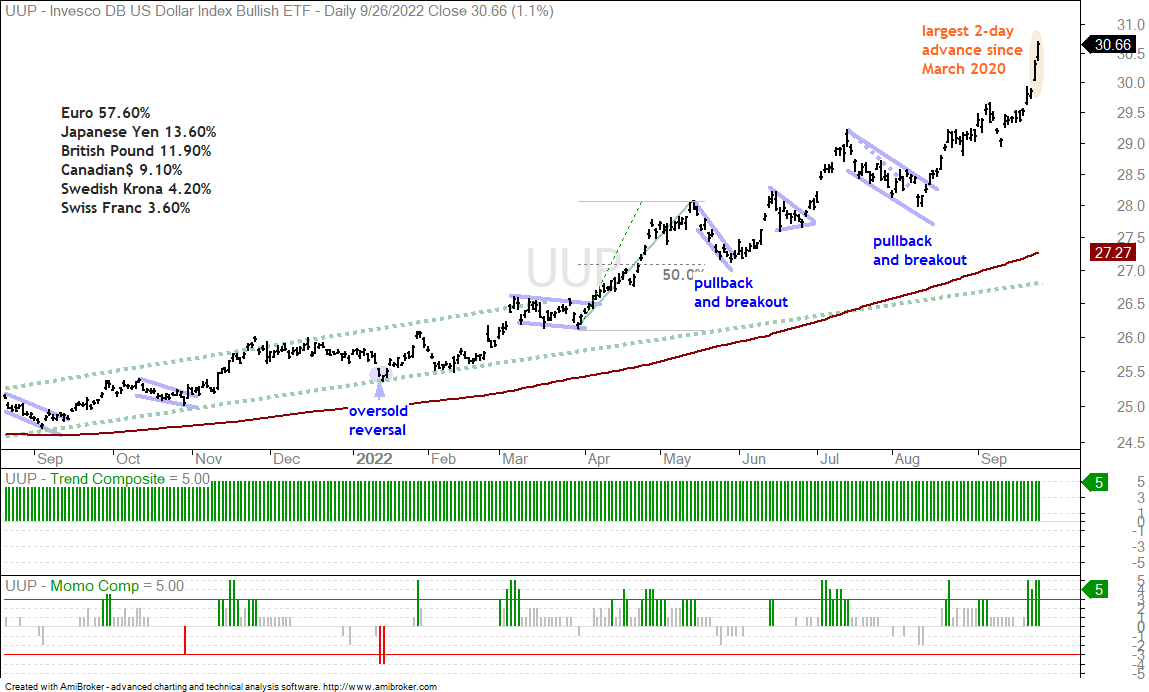
The Dollar Bullish ETF (UUP) surged 2.7% the last two days, which is a HUGE move for a currency ETF. This is the largest two-day advance since March 2020, which is when all kinds of chaos reigned. An outsized surge after an extended advance is a sign of excess that can lead to a consolidation or pullback. The long-term trend for the Dollar is still up and the greenback represents the risk-off trade as it is negatively correlated with stocks this year.
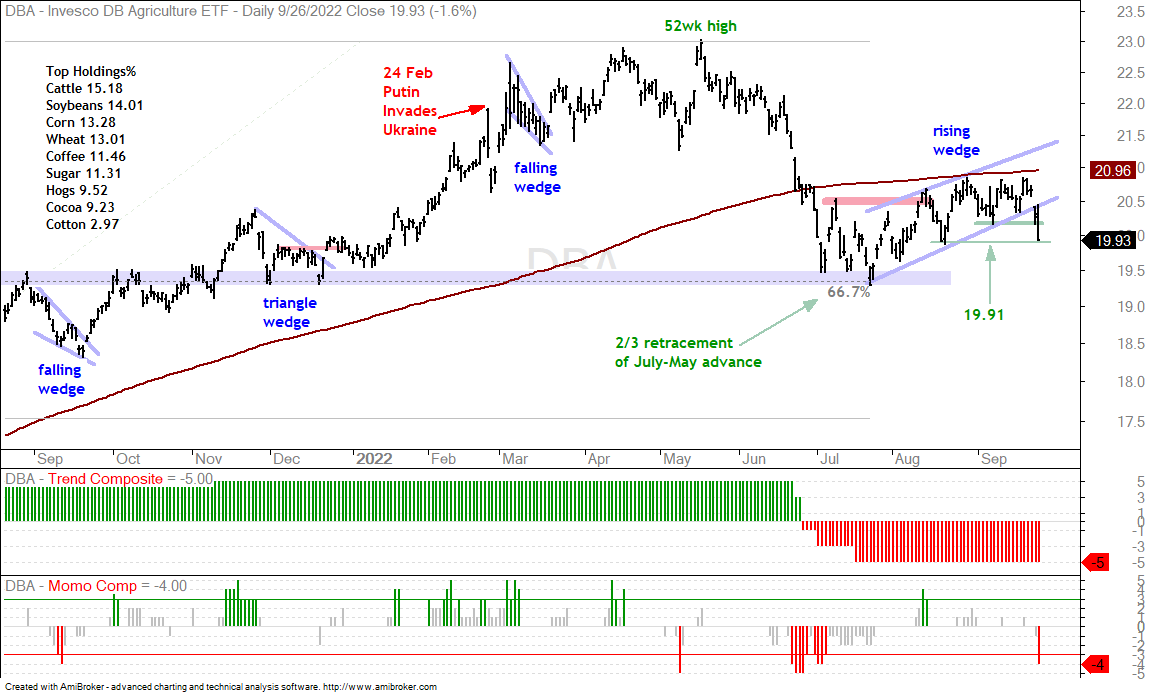
Agriculture ETF Takes a Hit
The DB Agriculture ETF (DBA) was holding up into mid September, but was also hit with a sharp decline the last four days. DBA broke the wedge line and exceeded the early September low. It looks like the wedge was a counter-trend bounce after the sharp decline and the ETF failed below the 200-day in September. Given the wedge break and overall market conditions, I do NOT expect the mid August closing low to hold (19.91).
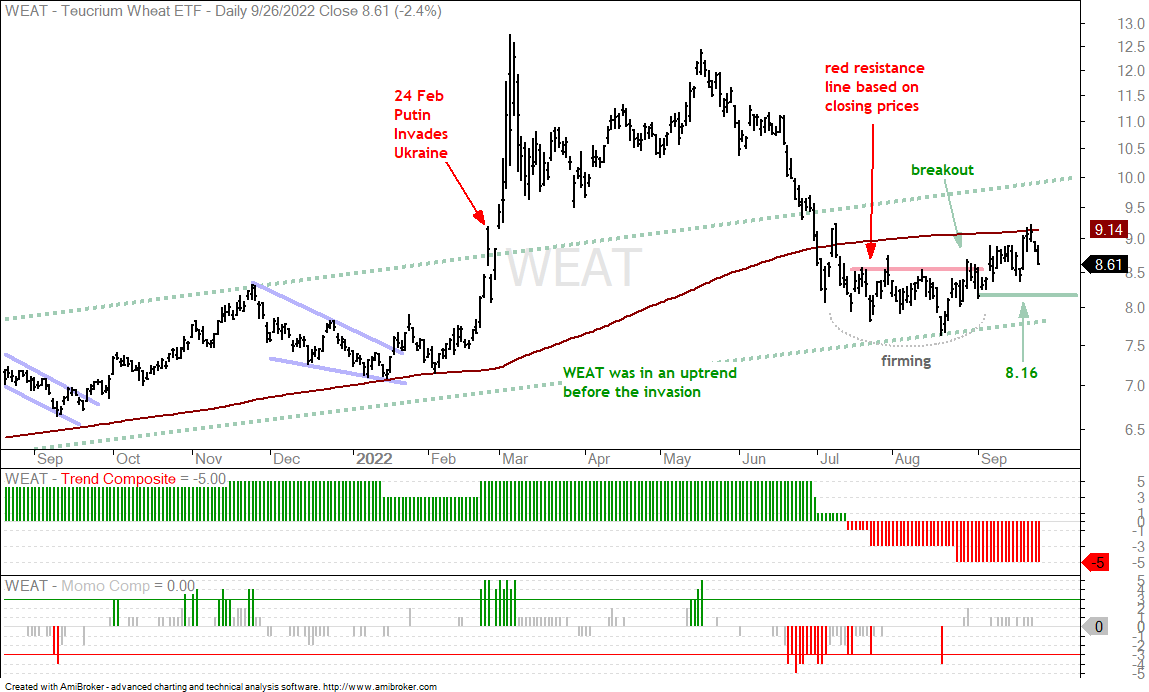
The Wheat ETF (WEAT) hit its rising 200-day SMA last week and fell back the last two days. Overall, the ETF is holding its late August breakout and the bulls have an edge as long as the early September closing low holds (8.16).
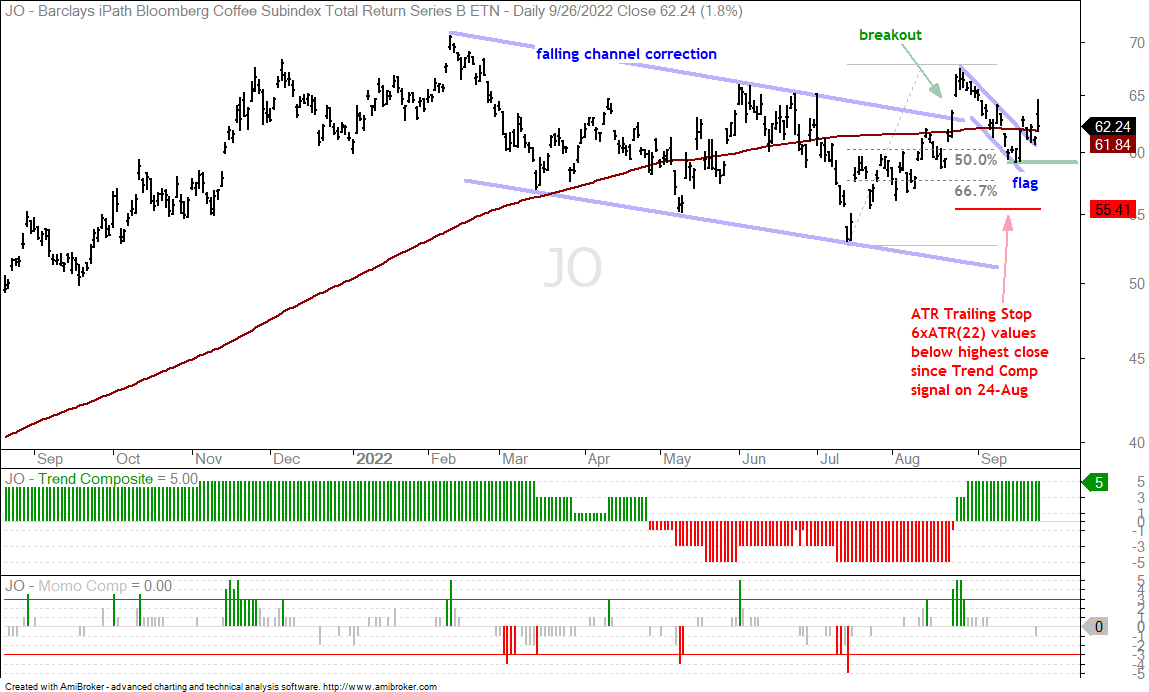
The Coffee ETF (JO) broke out of a falling flag early last week and moved higher on Monday. Long-term, I view the channel breakout in late August as bullish. The falling flag was a small correction after the advance from early July to late August. The flag breakout ended this correction and signaled a continuation higher. It also keeps the channel breakout alive. The flag lows mark first support to watch for the first sign of failure. A close below 59 would argue for a re-evaluation.
Palladium ETF Falls within Rising Channel (PALL)
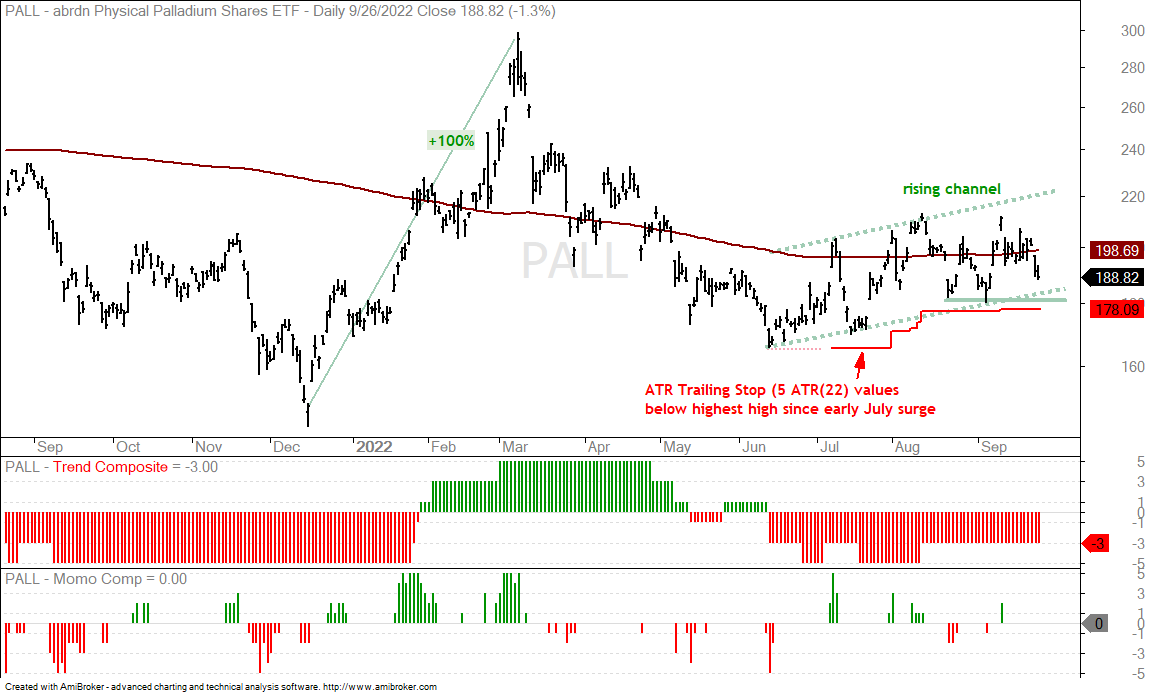
The Palladium ETF (PALL) remains the least dirty shirt in the industrial metals closet because it is holding above the early September low. Overall, the ETF remains within a rising channel and is performing much better than most ETFs this month. The lows in late August and early September mark support around 178. The ATR Trailing Stop is also in this area so a close below 178 would argue for a re-evaluation.
")