
Getting Started with Premium Services!
This page explains the Premium Services at TrendInvestorPro. We cover the publishing/update schedule, navigation links, our philosophy and the tools of the trade.
Trend Composite Signals for S&P 500 Stocks
This page shows Trend Composite signals for stocks in the S&P 500. The Trend Composite aggregate trend signals in five trend-following indicators. Recent signals appear at the top of the table. Users can also sort by different columns and single out specific sectors using the search function. Stocks in uptrends are color coded green for quick identification. This table includes the signal date, gain/loss since the signal and a chart link.

How to Improve your Trading Odds and Increase Opportunities
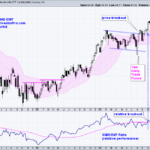
Chartists can improve their odds and increase the number of opportunities by trading short-term bullish setups within bigger trends. The first order of business is to identify the long-term trend using a trend-following indicator. Second, chartist can turn to more granular analysis to find short-term bullish setups. Today’s example will use the Cloud Computing ETF (SKYY).
Lagging Mid-cap ETF Hits its Moment of Truth
The S&P MidCap 400 SPDR (MDY) is trading at a moment of truth as its 5-day SMA returns to the 200-day SMA. A bearish trend signal triggered in early March. Despite a strong bounce from early April to mid May, this signal remains in force because it has yet to be proven otherwise. Today’s report will show how to quantify signals and reduce whipsaws using the percentage difference between two SMAs.

Three Sectors Stand Out, with One Sporting a Bullish Breakout
Three sectors stand out, with one sporting a recent breakout that argues for higher prices. Today’s report will highlight three criteria to define a leading uptrend. First, price should be above the rising 200-day SMA. Second, the price-relative should be above its rising

Tech ETFs are Leading Since April, but Another Group is Leading YTD
QQQ and tech ETFs are leading the surge off the April low, but there is another group leading year-to-date. Year-to-date performance is important because it includes two big events: the stock market decline from mid February to early April and the steep surge into early June. We need to combine these two events for a complete performance picture.

Moving from Thrust Signals to a Bull Market
The bullish signals stacked up in April and May, but most long-term breadth indicators are still bearish. SPY and QQQ showed signs of capitulation in early April and rebounded into mid April. A Zweig Breadth Thrust triggered on April 24th and several other thrust indicators turned bullish in May. We also saw SPY and QQQ break
SPY Recaptures 200-day – Tips to Reduce Whipsaws and Improve Performance
SPY and QQQ crossed above their 200-day SMAs with big moves on Monday, and held above these long-term moving averages the entire week. The V-Reversal was extraordinary and SPY seems short-term overbought, but this cross above the 200 day SMA cross is a bullish signal for the most important market benchmark. Despite a bullish signal, long-term moving averages are

What will Make or Break this V Reversal?
Stocks plunged into early April and surged into early May, suggesting that a “V” reversal is in the making. There are two parts to the V reversal. First, there is the V, which is the plunge and the rebound. Second, there is the breakout move that completes the reversal. SPY fulfilled the V part, but

Bottoming Process – Capitulation, Short and Medium Term Thrusts, Regime Change
The market does not always follow the same script or sequence, but bear markets end with a bottoming process that often goes in stages. First, there is the capitulation phase, which suggests that selling pressure reached extremes and a bottom may be close. There was a capitulation setup in early April. Second, short-term thrust indicators mark a sharp recovery after an

Equities? Fuhgeddaboudit! Alternative Assets are Leading
Trading is all about the odds. Trade when the odds are in your favor. Exercise patience and stand aside when the odds are NOT in your favor. Stocks are in a bear market and the vast majority of names are trading below their 200-day SMAs. Clearly, the odds are NOT in our favor for equities and equity ETFs. Traders need to look elsewhere. Today’s report will highlight some non-equity leaders and analyze Bitcoin as it sets up.

This Report Might Self Destruct in 5 Days – TLT Plunges as Yields Surge
With fast-moving markets, this report is vulnerable to self-destruction within 5 days. The bond vigilantes sent a message as long-term yields surged and bonds plunged. Unless reversed, these developments are negative for stocks, especially rate sensitive stocks.

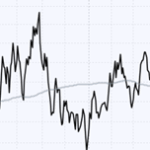
Bitcoin is Mostly Positively Correlated to SPY, but One Period Stands Out
With stocks in a bear market, I am looking for alternatives that are less correlated. Bitcoin is an alternative to stocks, but it shows a strong positive correlation to the S&P 500. The chart below shows SPY in blue and Bitcoin

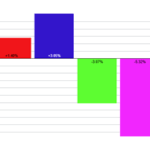
Performance Profile Paints Different Pictures for Commodity and Equity ETFs
The performance profile for 2025 says a lot about the state of the market. Commodity-related ETFs are leading, non-cyclical equity ETFs are holding up the best and cyclical names are performing the worst. Clearly, this is not a positive picture for the stock market. This report will show how to interpret the performance profile and separate the leaders from the laggards using a ChartList.

Two Ways to Use the Zweig Breadth Thrust Indicator
The Zweig Breadth Thrust is best known for its bullish reversal signals, which capture a material increase in upside participation. There is, however, more to the indicator because traders can also use the “setup” period to identify oversold conditions. This report will explain the original Zweig Breadth Thrust and show how these signals work.

SPY Reverses Long-term Uptrend with Outsized Move – Now What?
The weight of the evidence shifted to the bears over the last few weeks. First, the major index ETFs reversed their long-term uptrends with Bollinger Band signals, our breadth models turned net negative and yield spreads widened. This report will focus on the breakdown in the
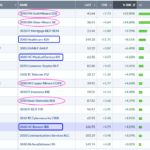
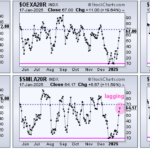
Commodity and Healthcare Related ETFs Lead in 2025 – Bullish Breakout in Biotechs
2025 is off to a rough start for stocks, but there are still some pockets of strength in the market. Year-to-date, SPY is down 1.73%, QQQ is down around 4% and the S&P SmallCap 600 SPDR (IJR) is down over 6%. ETFs with smaller losses show relative strength (less weakness), but ETFs with year-to-date gains show relative
Small-caps Trigger Bearish, but Large-caps Hold Uptrend and Present an Opportunity
The Russell 2000 ETF triggered a bearish trend signal this week and continues to underperform S&P 500 SPDR, which remains with a bullish trend signal. Today’s report shows the Keltner Channel signals in each. SPY is currently correcting within an uptrend and pullbacks within uptrends are opportunities

Stash that Flash Right in the Trash – 3 Prerequisites for Chartists – SPY Bullish Pattern
The news cycle is in high gear lately, leading to some extra volatility. Traders reacting to the news are getting whipsawed, while chartists remain focused on what really matters. Price. Price isn’t everything, it is the only thing. News, rumors, fundamentals, the Fed, government policy and
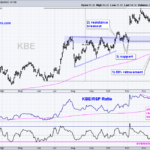
Bank SPDR Extends on Breakout – How to Find the Setup before the Breakout
The Finance sector is leading the market with a new high this week and the Bank SPDR (KBE) is extending on its breakout. Today’s report will outline the lessons of the early January setup and show the mid January breakout. We then show how to set a re-evaluation level that would prove the breakout wrong.
Cybersecurity Makes Yet Another Statement
The Cybersecurity ETF (CIBR) has been leading the market for a solid four months and recorded yet another new high this week. Chartists looking to take advantage of this leadership can use two timeframes: one to establish the absolute and relative trends, and another to identify tradable pullbacks along the way. Note that CIBR has been on our radar for four months and was featured in October.
Mid-Caps Make a Statement with a Breadth Thrust
Mid-caps show leadership and were the first to trigger a breadth thrust. Stocks surged this week with mid-caps showing the highest participation rate. Chartists can quantify the participation rate and identify breadth thrusts using the percentage of stocks above their 20-day SMAs. We will analyze these indicators for six broad indexes and show the breadth thrust for the S&P MidCap 400

Market Pullbacks Provide Opportunities to Build your WatchList – Here’s How
The stock market is in pullback mode with the S&P 500 EW ETF down 5.15% over the past month and down 1% year-to-date. This makes it a good time to monitor relative performance and create a relative strength watch list. Stocks and ETFs holding up best during pullbacks often lead when the market regains its footing. Today’s report will show a starter list and analyze the chart for an AI Robotics ETF.

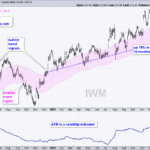
How to Trade Erratic Uptrends – An Example and Setup using IWM
The Russell 2000 ETF managed a double digit gain in 2024, but did it the hard way with several deep pullbacks along the way. Pullbacks within uptrends are opportunities and we can find such opportunities using %B. The chart below shows the Russell 2000 ETF (IWM) with the Zigzag(8) indicator. This indicator changes direction when there is a move greater than 8%, which means it ignores price moves that are less than 8%.

Is this Bounce a Robust Rebound or a Dead-Cat Bounce?
Breadth became oversold last week and stocks rebounded this week. Is this a robust rebound or a dead cat bounce? Today’s report will show a key short-term breadth indicator hitting its lowest level in 2024 and becoming oversold. A rebound is in place, but it is still to early to call this a robust rebound and we will show the critical level to watch.